Abstract
Background
To analyze the diagnostic value of color Doppler imaging (CDI) of blood flow in the retrobulbar vessels of eyes with primary open-angle glaucoma (POAG).
Methods
Pertinent publications were retrieved from the Cochrane Central Register of Controlled Trials, PubMed and the ISI Web of Knowledge up to October 2012. Changes in peak systolic velocity (PSV), end diastolic velocity (EDV) and resistive index (RI) of the ophthalmic artery (OA), central retinal artery (CRA) and short posterior ciliary artery (SPCA) of POAG eyes and normal controls were evaluated by CDI. Subgroup analyses were conducted according to whether patients received IOP-lowering drugs treatment and were defined as treated and untreated.
Results
PSV and EDV were statistically significantly reduced in the OA of POAG eyes (P = 0.0002; P<0.00001; respectively), with significant heterogeneity (Pheterogeneity<0.00001, I2 = 94%; Pheterogeneity<0.00001, I2 = 85%; respectively). Similar results were demonstrated for the CRA (P<0.00001; respectively) and SPCA (P = 0.005; P<0.00001; respectively), with significant heterogeneities for both the CRA (Pheterogeneity<0.00001, I2 = 81%; Pheterogeneity<0.00001, I2 = 98%; respectively) and the SPCA (Pheterogeneity<0.00001, I2 = 96%; Pheterogeneity<0.00001, I2 = 93%; respectively). Significant increases in RI were found in all retrobulbar vessels (P<0.00001; respectively), with significant heterogeneities (Pheterogeneity<0.00001, I2 = 95%; Pheterogeneity<0.00001, I2 = 94%; Pheterogeneity<0.00001, I2 = 97%; respectively).
Conclusions
This meta-analysis suggests that CDI is a potential diagnostic tool for POAG.
Introduction
Primary open-angle glaucoma (POAG) is multifactorial in origin and characterized by optic nerve head excavation, visual field defects and psychophysical changes [1]. One hypothesis for the pathogenesis of POAG is that a mechanical mechanism that elevated IOP blocks optic neuronal axoplasmic flow in the madreporite, ultimately leading to apoptosis of the ganglion cell [2]. However, despite therapeutic IOP reduction, some patients still show signs of disease progression, which indicates that other factors might be involved in the glaucomatous damage. Recently, a hypothesis concerning the vasogenic mechanism of POAG was suggested that considers vascular dysregulation [3]–[5]. Inability of the perfusion system to adapt to tissue blood flow requirements or changes in perfusion pressure may lead to chronically low or unstable ocular perfusion [6], which in turn may cause ischemia, oxidative stress or both, possibly leading to glaucomatous damage to the optic nerve head. It seems that vascular factors are important in the development and progression of POAG.
Various techniques have been used to evaluate ocular blood flow in patients with POAG, such as scanning ophthalmoscopy [7], scanning laser Doppler flowmetry [8], [9] and pulsatile ocular blood flow [10], [11]. Compared with these techniques, color Doppler imaging (CDI) has particular advantages in that it is noninvasive, is not affected by poor ocular media, requires no contrast or radiation, and has been used in ophthalmology for 20 years [12], [13]. This ultrasound technique combines simultaneous B-mode ultrasound imaging with colors representing movement based on Doppler frequency shifts. It allows the assessment of blood flow velocities including peak systolic velocity (PSV) and end diastolic velocity (EDV) in the ophthalmic artery (OA), central retinal artery (CRA) and short posterior ciliary artery (SPCA). In addition, resistive index (RI), a measure of peripheral vascular resistance, can be calculated for each retrobulbar vessel.
Numerous studies have reported reduced PSV and EDV and increased RI in the OA, CRA and SPCA in eyes of POAG [14]–[16]. Some studies have found reduced blood flow velocities and increased RI in only one [17]–[19] or two [20], [21] retrobulbar vessels. To the authors’ knowledge, no systematic review of the evidence for the diagnostic potential of CDI in POAG has been published. To obtain a better perspective of the above issues, we performed a meta-analysis of the literature to quantify the value of CDI in measuring the PSV, EDV and RI of the OA, CRA and SPCA in eyes with POAG compared with normal control subjects and to assess the diagnostic value of CDI in POAG.
Materials and Methods
Search and Selection
Two researchers independently searched the literature in three databases – the Cochrane Central Register of Controlled Trials, PubMed and the ISI Web of Knowledge – up to October 2012. The search terms were ‘color Doppler imaging or colour Doppler imaging or Doppler ultrasound or CDI’, ‘ocular blood flow or retrobulbar blood flow’ and ‘primary open-angle glaucoma or POAG’ in various combinations, with the language limited to English. The reference lists of case reports, studies and review articles were also reviewed for any additional citations. Publications that involved the use of CDI measurements made in a supine or sitting position in the diagnosis of POAG were included.
Inclusion Criteria
The definitions of POAG used in the included studies are shown in Table S2. Normal control subjects had IOP≤21 mm Hg, normal optic disc appearance and no visual field defect.
All relevant articles were extracted in print and the final selection was based on discussion among the researchers. Studies were included if they: (i) were randomized clinical controlled trials or observational studies; and (ii) compared blood flow velocities including PSV, EDV and RI in the OA, CRA and SPCA in POAG and normal eyes. When multiple publications from the same study population were available, we checked for duplicate analysis and only the most recent publication was included. For more detailed information, see the PRISMA checklist (Table S1).
Data Extraction
The following information was extracted by the investigators independently from the published reports, using a standardized protocol and reporting form: first author’s last name, year of publication, country of origin, number of enrolled eyes, mean age of subjects, definition of POAG, type of treatment, and mean change with standard deviations (SD) of measurement indicators.
Outcome Measures
All studies had PSV and EDV measured by CDI in the OA, CRA and SPCA as major outcomes. PSV (cm/s) was defined as the highest blood flow velocity achieved during systole and was calculated from the frequency of the peak in the Doppler-shifted waveform. EDV (cm/s) was defined as the lowest velocity occurring during diastole and was calculated from the frequency of the trough in the Doppler-shifted waveform. RI was calculated according to the method of Pourcelot [22] as RI = (PSV - EDV)/PSV.
Statistical Analysis
RevMan software (Review Manager, Version 5.1; The Cochrane Collaboration, 2011) was used for this meta-analysis. For every included study, we calculated the mean difference (MD) for the continuous outcomes (PSV, EDV or RI) along with 95% confidence intervals (95%CIs). The between-study heterogeneity (i.e. the variation in findings not compatible with chance alone) was tested using chi-square based Cochran’s statistics and the inconsistency index (I2) [23], which indicates the proportion of the variability across studies that is due to heterogeneity rather than sample error. Statistically significant heterogeneity was considered to be present when Pheterogeneity<0.05 and I2 >50%. In the presence of substantial heterogeneity (I2 >50%), a random effect model was adopted as the pooling method; otherwise, a fixed effect model was used. Beggar’s and Egger’s tests were used to determined publication bias [24], [25].
Topical antiglaucoma medications may influence ocular blood flow by increasing flow velocities and reducing RI [26], [27]. Subgroup analyses were conducted according to whether POAG eyes received IOP-lowering drugs and were defined as treated and untreated subgroups. The treated subgroup included eyes that received IOP-lowering drugs and had well controlled IOP (data on duration of medication use were not available); the untreated subgroup included eyes with IOP>21 mm Hg that was newly diagnosed and untreated. All data were displayed as forest plots.
Results
Study Characteristics
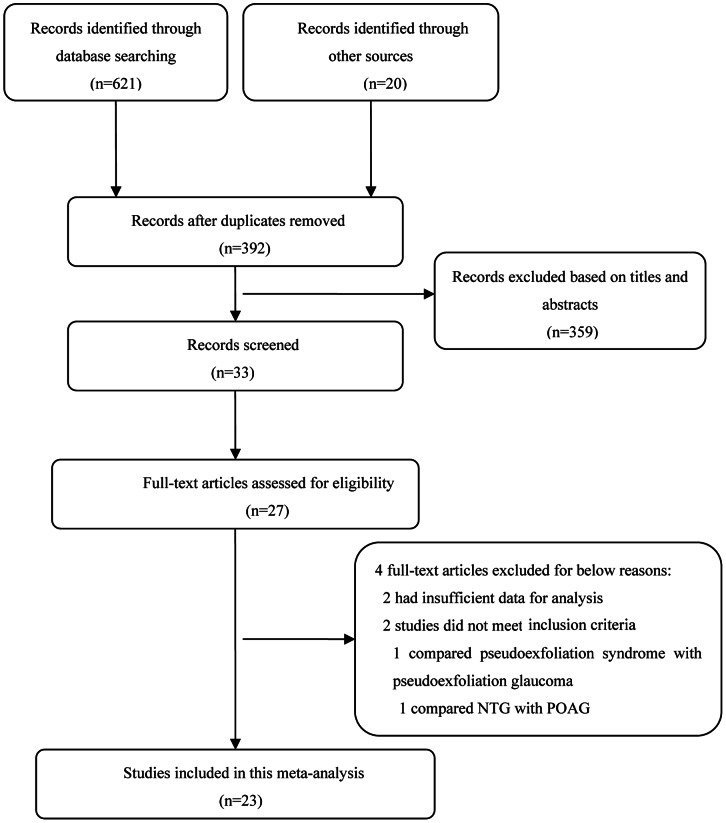
Figure 1 summarizes the selection of eligible studies. Twenty-three prospective observational studies of 1286 eyes with POAG and 1052 controls were included in the meta-analysis. Eighteen of the studies concerned POAG eyes that received IOP-lowering drugs and had well controlled IOP [14], [21], [28]–[43]; five studies concerned newly diagnosed and untreated POAG [19], [44]–[47]. CDI was conducted in a sitting position in three studies [31], [40], [44] and in a supine position in the remaining 20 studies [14], [19], [21], [28]–[30], [32]–[39], [41]–[43], [45]–[47]. All of the included studies were of reasonably good quality.
Figure 1. Flowchart of the literature selection process.
The detailed characteristics of the participants in the 23 studies are given in Table S2. The subjects’ ages ranged from 38.6 to 83.9 years old; the gender distributions of POAG patients and normal control subjects were similar. Clinical heterogeneity was observed in several areas, including the specific characteristics of glaucoma and different treatment protocols. However, these factors were not reported consistently in the publications and hence were not analyzed here.
Summary Results for PSV, EDV and RI
PSV
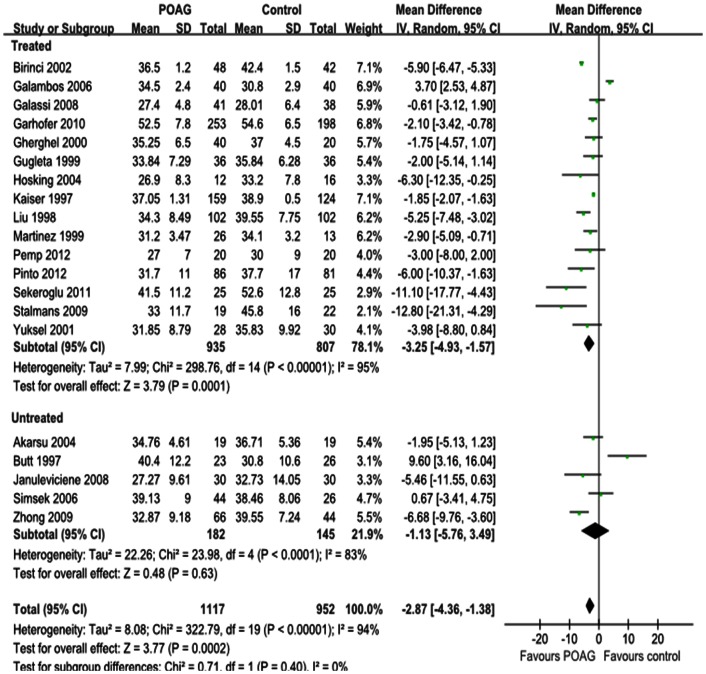
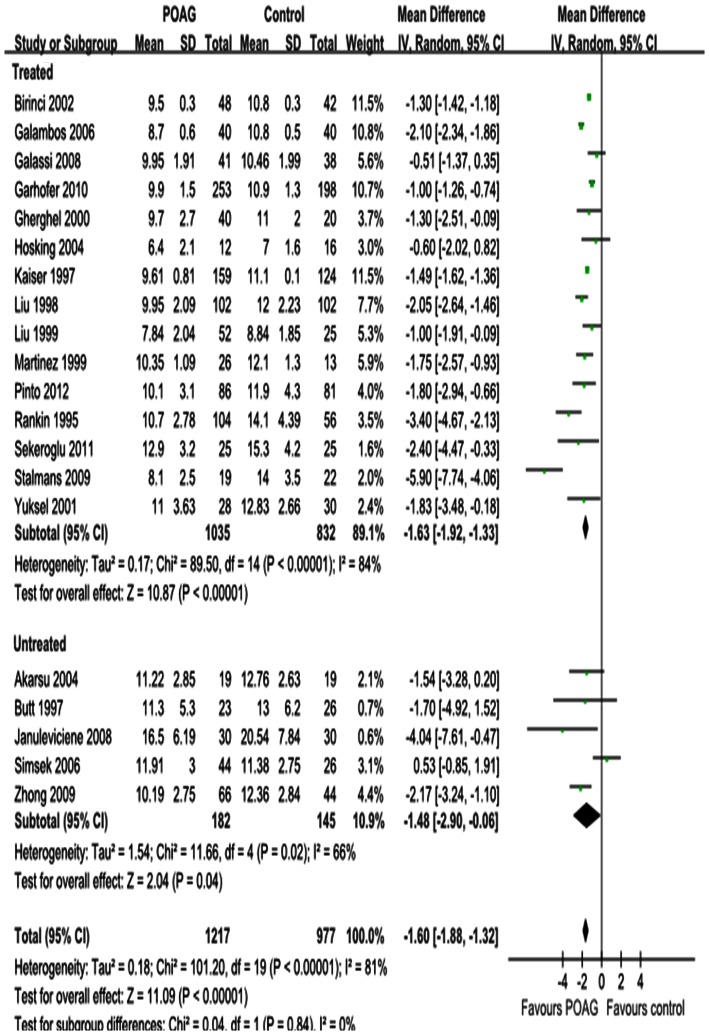
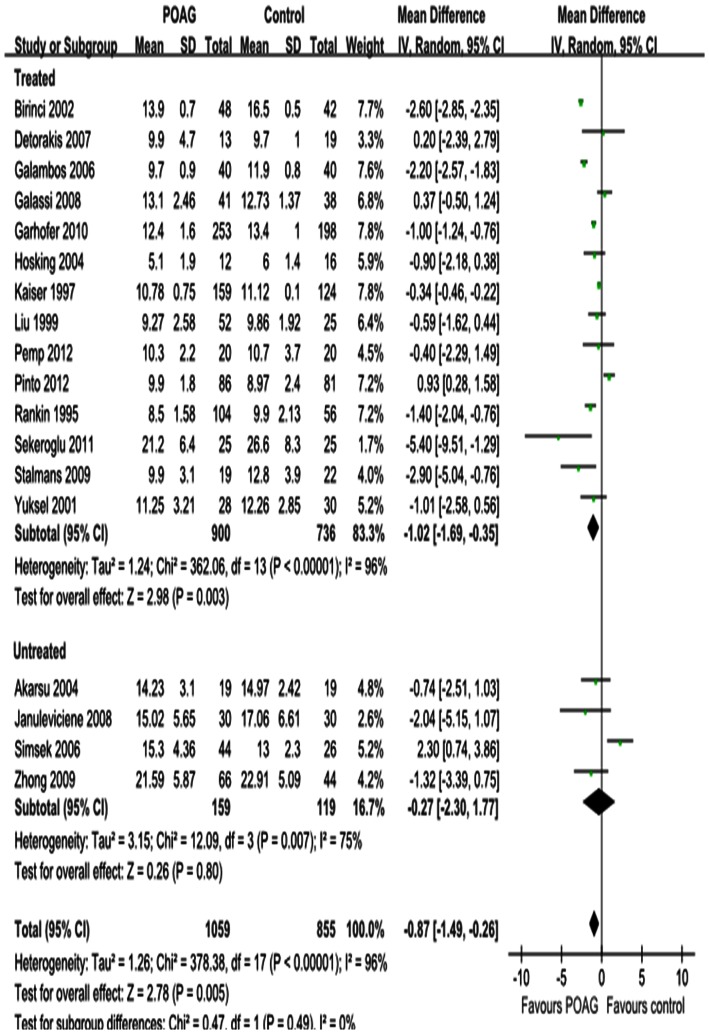
Differences in the mean change in PSV for each retrobulbar vessel, along with SDs and 95%CIs, are outlined in the forest plot displayed in Figure 2, 3 and 4. The dots represent MDs; the whiskers extending from the dots show the associated 95%CIs. Values on the left side of the vertical line at 0 represent greater changes in PSV in normal controls; values on the right side of the vertical line represent greater changes in eyes with POAG. 95%CIs that do not intersect with the vertical line at 0 indicate the results that were statistically significant at the 0.05 level.
Figure 2. Results of PSV in OA.
The forest plot showed the studies’ MDs in PSV in cm/s along with their associated 95%CIs, comparing POAG eyes with normal controls. PSV was significantly decreased in OA in POAG eyes. Subgroup analysis showed that the heterogeneity in OA was due to both the untreated and IOP-lowering drugs treatment subgroup. Negative values favored POAG eyes over normal controls; positive values favored normal controls over POAG eyes.
Figure 3. Results of PSV in CRA.
PSV was significantly decreased in CRA. Subgroup analysis showed that the heterogeneity in CRA was due to both the untreated and IOP-lowering drugs treatment subgroup.
Figure 4. Results of PSV in SPCA.
PSV was significantly decreased in SPCA. Subgroup analysis showed that the heterogeneity in SPCA was due to both the untreated and IOP-lowering drugs treatment subgroup.
Significant reductions in PSV in the OA and CRA of POAG eyes were found in 20 studies, with a total summary MDs of –2.87 cm/s (95%CI: –4.36 to –1.38, P = 0.0002; Figure 2) and –1.60 cm/s (95%CI: –1.88 to –1.32, P<0.00001; Figure 3) and significant heterogeneities (Pheterogeneity<0.00001, I2 = 94%; Pheterogeneity<0.00001, I2 = 81%; respectively). Significant reductions in PSV in the SPCA of POAG eyes were demonstrated in 18 studies, with a MD of –0.87 cm/s (95%CI: –1.49 to –0.26, P = 0.005; Figure 4) and significant heterogeneity (Pheterogeneity <0.00001, I2 = 96%). Subgroup analysis of PSV in the OA, CRA and SPCA found significant heterogeneities in both the treated and untreated subgroups (Pheterogeneity<0.00001, I2 = 95% and Pheterogeneity<0.0001, I2 = 83%, Figure 2; Pheterogeneity<0.00001, I2 = 84% and Pheterogeneity = 0.02, I2 = 66%, Figure 3; Pheterogeneity<0.00001, I2 = 96% and Pheterogeneity = 0.007, I2 = 75%, Figure 4).
EDV
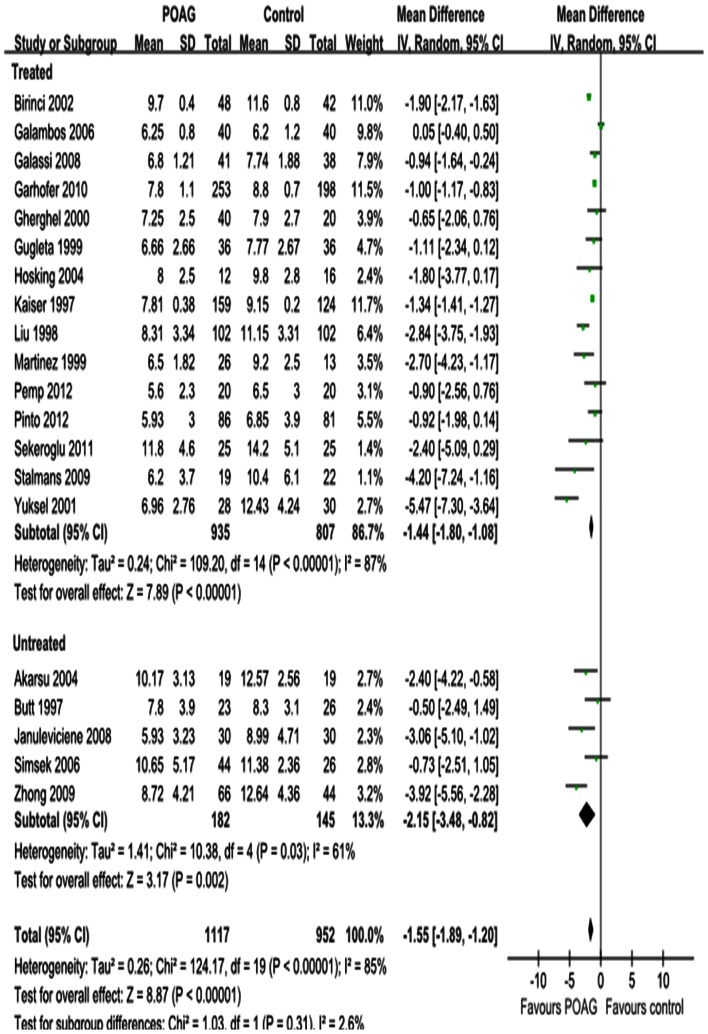
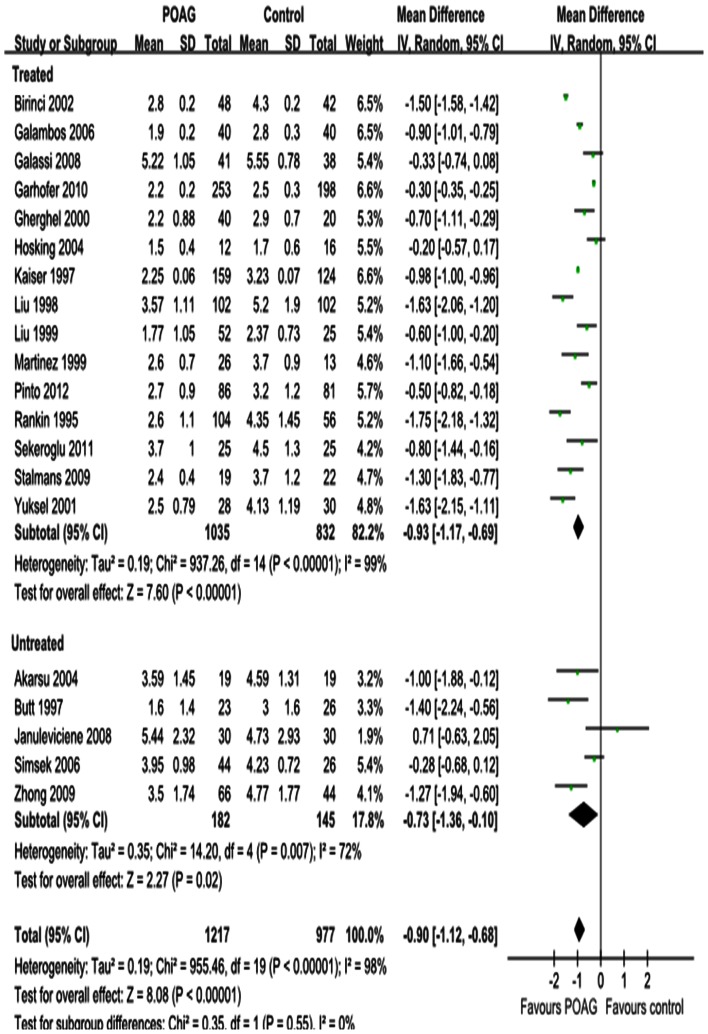
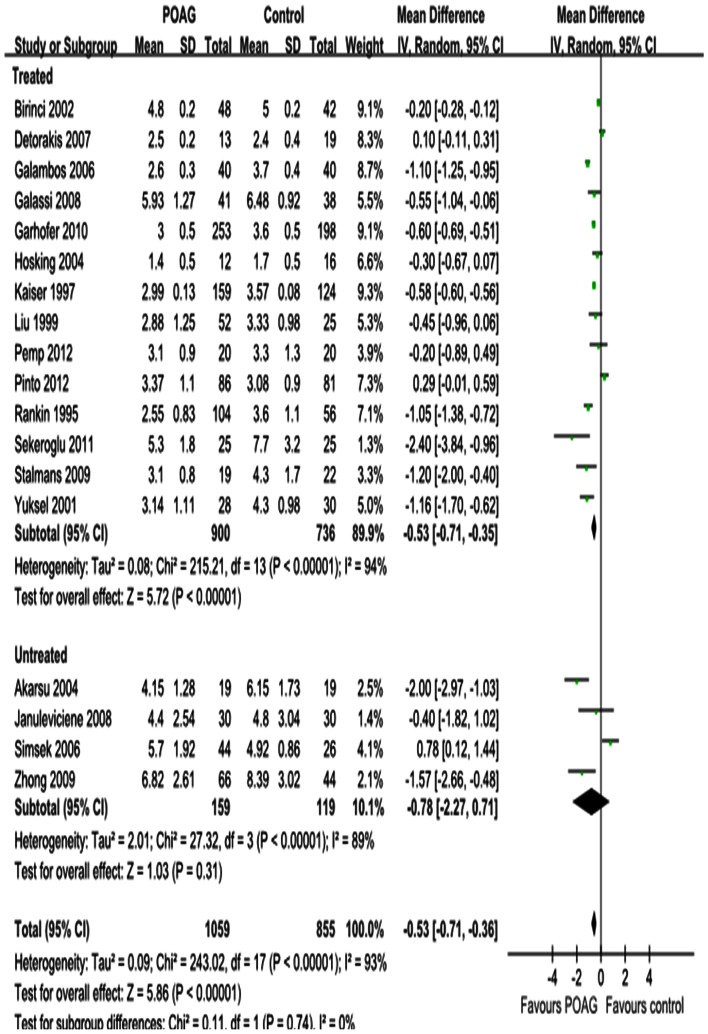
Figure 5, 6 and 7 show the forest plot for EDV in the OA, CRA and SPCA comparing POAG eyes with controls. Similar to the PSV outcomes, POAG eyes had significantly lower EDV in the OA with a MD of –1.55 cm/s (95%CI: –1.89 to –1.20, P<0.00001; Figure 5), in the CRA with a MD of –0.90 cm/s (95%CI: –1.12 to –0.68, P<0.00001; Figure 6) and in the SPCA with a MD of –0.53 cm/s (95%CI: –0.71 to –0.36, P<0.00001; Figure 7). The heterogeneity was significant for the EDV in each retrobulbar vessel (Pheterogeneity<0.00001, I2 = 85%; Pheterogeneity<0.00001, I2 = 98%; Pheterogeneity<0.00001, I2 = 93%; respectively). Subgroup analysis of EDV in the OA, CRA and SPCA found significant heterogeneities in both the treated and untreated subgroups (Pheterogeneity<0.00001, I2 = 87% and Pheterogeneit y = 0.03, I2 = 6 1%, Figure 5; Pheterogeneity<0.00001, I2 = 99% and Pheterogeneity = 0.007, I2 = 72%, Figure 6; Pheterogeneity<0.00001, I2 = 94% and Pheterogeneity<0.00001, I2 = 89%, Figure 7).
Figure 5. Results of EDV in OA.
The forest plot showed the studies’ MDs in EDV in cm/s along with their associated 95%CIs, comparing POAG eyes with normal controls. EDV was significantly decreased in OA in POAG eyes. Subgroup analysis showed the heterogeneity in OA was due to both the untreated and IOP-lowering drugs treatment subgroup. Negative values favored POAG eyes over normal controls; positive values favored normal controls over POAG eyes.
Figure 6. Results of EDV in CRA.
EDV was significantly decreased in CRA in POAG eyes. Subgroup analysis showed the heterogeneity in CRA was due to both the untreated and IOP-lowering drugs treatment subgroup.
Figure 7. Results of EDV in SPCA.
EDV was significantly decreased in SPCA in POAG eyes. Subgroup analysis showed the heterogeneity in SPCA was due to both the untreated and IOP-lowering drugs treatment subgroup.
RI
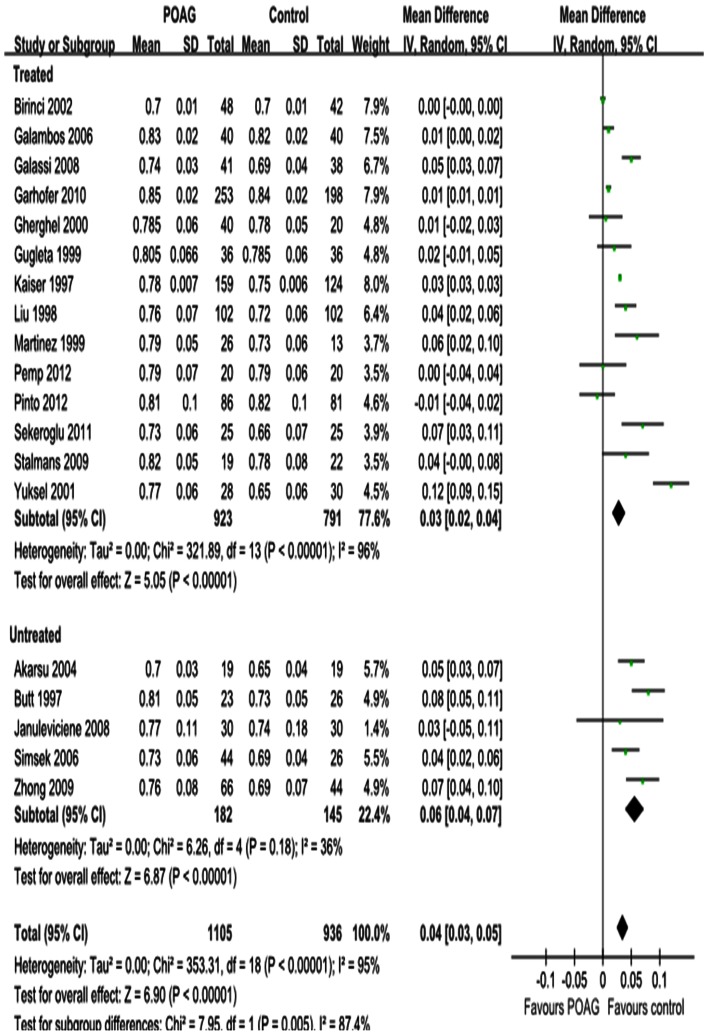
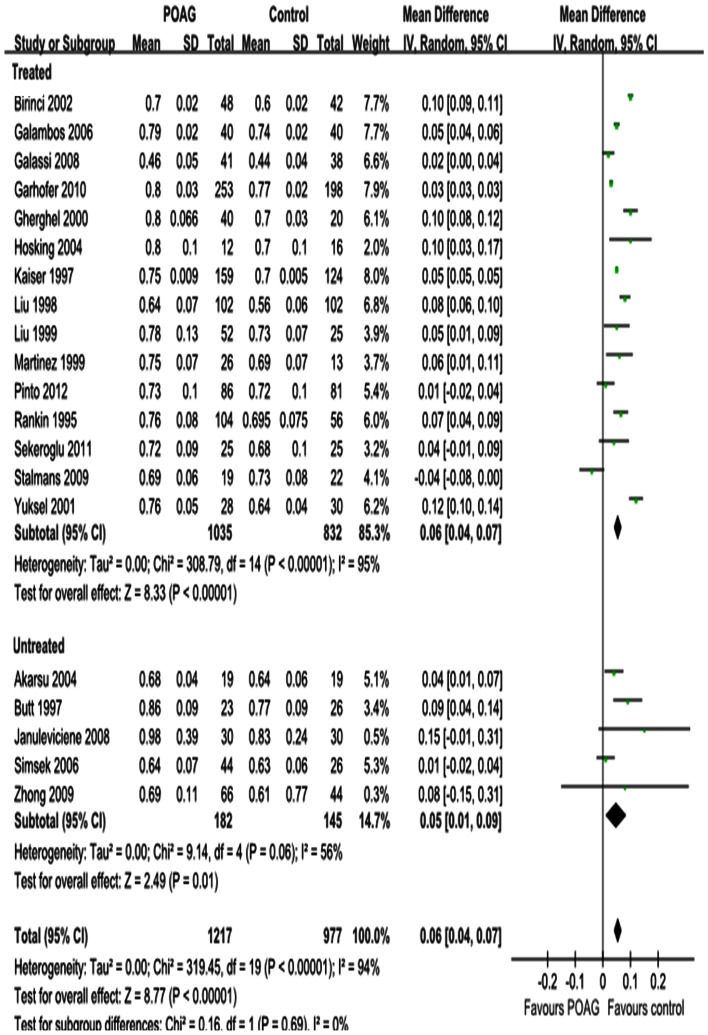
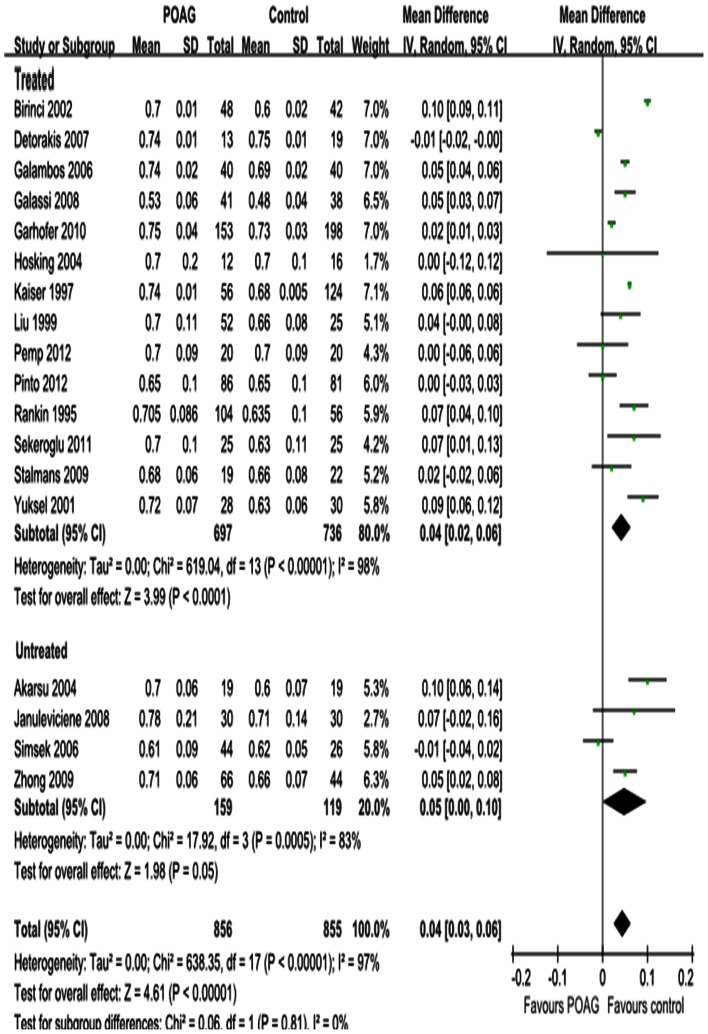
The results for RI in the OA, CRA and SPCA are shown in Figure 8, 9 and 10. Significant increases were observed; the MD was 0.04 in the OA (95%CI: 0.03 to 0.05, P<0.00001; Figure 8), 0.06 in the CRA (95%CI: 0.04 to 0.07, P<0.00001; Figure 9) and 0.04 in the SPCA (95%CI: 0.03 to 0.06, P<0.00001; Figure 10), with significant heterogeneities (Pheterogeneity<0.00001, I2 = 95%; Pheterogeneity<0.00001, I2 = 94%; Pheterogeneity<0.00001, I2 = 97%; respectively). Subgroup analysis demonstrated that the heterogeneities in OA and CRA were due to IOP-lowering drug treatment (Pheterogeneity<0.00001, I2 = 96%; Pheterogeneity<0.00001, I2 = 95%; Figure 8 and 9). The heterogeneity in the SPCA was significant in both the treated and untreated subgroups (Pheterogeneity<0.00001, I2 = 98%; Pheterogeneity = 0.0005, I2 = 83%; Figure 10).
Figure 8. Results of RI in OA.
The forest plot showed the studies’ MDs in RI along with their associated 95%CIs, comparing POAG eyes with normal controls. RI was significantly increased in OA in POAG eyes. Subgroup analysis demonstrated the heterogeneity in OA was due to the IOP-lowering drugs treatment. Negative values favored POAG eyes over normal controls; positive values favored normal controls over POAG eyes.
Figure 9. Results of RI in CRA.
RI was significantly increased in CRA in POAG eyes. Subgroup analysis demonstrated the heterogeneity in CRA was due to the IOP-lowering drugs treatment.
Figure 10. Results of RI in SPCA.
RI was significantly increased in SPCA in POAG eyes.
Discussion
POAG has long been recognized as the major cause for legal blindness worldwide [48]. For decades, extensive studies have been conducted in attempts to identify the precise pathogenesis of POAG and potential diagnostic methods for its detection.
This meta-analysis was conducted to evaluate the differences in blood flow parameters in the retrobulbar vessels using CDI. CDI measures blood flow velocity but not actual blood flow, because it is impossible to determine accurately the diameter of orbital vessels in vivo with this technique. Despite this limitation, blood flow velocity is probably a good indicator of blood flow within a given vessel [49],[50]. We found that, in eyes with POAG, PSV and EDV in the OA, CRA and SPCA were significantly decreased, whereas the RI in these retrobulbar vessels was significantly increased. The general consensus is that the main blood supply of the anterior optic nerve head is derived from the SPCA, with small contributions from the pial vessels and CRA; the retina derives its blood supply mainly from the CRA. Both the CRA and the SPCA are branches of the OA, which is the main arterial supply to the eyes; therefore, the hemodynamic parameters of the OA, CRA and SPCA reflect local blood supply conditions in the optic disc and retina. PSV reflects the strength of vessel perfusion, whereas EDV reflects the blood perfusion of distal organs and is a sensitive indicator of increased downstream impedance. RI is considered to reflect vascular resistance peripheral to the location where the measurements is made, but is not equivalent to vascular resistance because it depends on both vascular resistance and vascular compliance; only at high vascular compliance is RI an adequate measure of vascular resistance. However, the association of lower EDV with higher RI could be explained by increased vascular resistance [51],[52] and changes in resistance affect diastolic blood flow velocity more than systolic velocity [50], which further aggravates the ischemia of organs. Therefore, decreased blood velocity and increased RI can result in ischemia of the optic disc and, ultimately, glaucomatous damages to the optic nerve head [6].
In this meta-analysis, we found that PSV and EDV were decreased in each retrobulbar vessel in both untreated and IOP-controlled POAG eyes. Considering that the retinal nerve fiber layer in eyes with POAG has been reported to be thinner than that in normal eyes [53],[54], we believe that retrobulbar blood flow reductions affect not only the optic disc, but also the retina. Apoptosis of ganglion cells is probably due to blood flow reduction in the CRA, which is the main artery supplying the inner retina.
The primary limitation of this meta-analysis was that observational studies rather than randomized clinical controlled trials were included. Furthermore, only studies published in English were involved.
Publication bias could have distorted our findings, though no significant publication bias was found. Funnel plots were symmetric (Data not shown) and consistent results were obtained from the Beggar’s and Egger’s tests. Nevertheless, publication bias remains a possibility because studies that report statistically significant results are more likely to be published than those that report non-significant results. Moreover, we did not include unpublished data from conference abstracts, dissertations or pharmaceutical companies.
There was considerable heterogeneity between the studies assessed here, which may be attributable to patient characteristics, types of antiglaucoma medications used, sample size, diagnostic bias, operator experience or CDI devices used. As shown in Table S2, antiglaucoma medications and sample size varied and could have been a source of heterogeneity. The diagnostic criteria for POAG differed among the included studies, which might have led to diagnostic bias; definitions were based on a combination of glaucomatous visual field loss and optic disc abnormalities in most studies, with various criteria and cutoff points (Table S2). In addition, the interpretation of CDI measurements may be operator dependent and it is possible that this is reflected in the heterogeneity. Means of sensitivities, specificities and positive predictive values for different CDI devices are variable and may also resulted in heterogeneity in this meta-analysis. We were unable to conduct regression analysis of the results to explore study-level factors that might have explained some of the heterogeneity.
In summary, our data suggest that blood flow velocities were reduced and RI was increased in all retrobulbar vessels in POAG eyes. Changes of ocular blood flow are important in the development of POAG and CDI is therefore a potential diagnostic tool for this condition.
Supporting Information
PRISMA checklist.
(DOC)
characteristics of included studies.
(DOC)
Acknowledgments
The authors thank the authors whose studies were involved in this meta-analysis and provided useful data to us.
Contributions
Collection and management of the data: NM PZ HH JM YZ HL YQ. Conceived and designed the experiments: NM YQ. Analyzed the data: NM YQ. Contributed reagents/materials/analysis tools: PZ HH. Wrote the paper: NM YQ.
Funding Statement
This study was supported partly by Shandong Science and Technology Developing Project (2012GSF12121), Shandong Provincial Natural Science Foundation (Y2008C78) and Independent innovation foundation of Shandong University (IIFSDU 2012ZD025). The funders had no role in study design, data collection and analysis, decision to publish, or preparation of the manuscript.
References
- 1. Van Buskirk EM, Cioffi GA (1992) Glaucomatous optic neuropathy. Am J Ophthalmol 113: 447–452. [DOI] [PubMed] [Google Scholar]
- 2. Hayreh SS, Revie IH, Edwards J (1970) Vasogenic origin of visual field defects and optic nerve changes in glaucoma. Br J Ophthalmol 54: 461–472. [DOI] [PMC free article] [PubMed] [Google Scholar]
- 3. Resch H, Garhofer G, Fuchsjager-Mayrl G, Hommer A, Schmetterer L (2009) Endothelial dysfunction in glaucoma. Acta Ophthalmol 87: 4–12. [DOI] [PubMed] [Google Scholar]
- 4. Flammer J, Orgul S, Costa VP, Orzalesi N, Krieglstein GK, et al. (2002) The impact of ocular blood flow in glaucoma. Prog Retin Eye Res 21: 359–393. [DOI] [PubMed] [Google Scholar]
- 5. Costa VP, Harris A, Stefansson E, Flammer J, Krieglstein GK, et al. (2003) The effects of antiglaucoma and systemic medications on ocular blood flow. Prog Retin Eye Res 22: 769–805. [DOI] [PubMed] [Google Scholar]
- 6. Leske MC, Heijl A, Hyman L, Bengtsson B, Dong L, et al. (2007) Predictors of long-term progression in the early manifest glaucoma trial. Ophthalmology 114: 1965–1972. [DOI] [PubMed] [Google Scholar]
- 7. Wolf S, Arend O, Sponsel WE, Schulte K, Cantor LB, et al. (1993) Retinal hemodynamics using scanning laser ophthalmoscopy and hemorheology in chronic open-angle glaucoma. Ophthalmology 100: 1561–1566. [DOI] [PubMed] [Google Scholar]
- 8. Chung HS, Harris A, Kagemann L, Martin B (1999) Peripapillary retinal blood flow in normal tension glaucoma. Br J Ophthalmol 83: 466–469. [DOI] [PMC free article] [PubMed] [Google Scholar]
- 9. Michelson G, Langhans MJ, Groh MJ (1996) Perfusion of the juxtapapillary retina and the neuroretinal rim area in primary open angle glaucoma. J Glaucoma 5: 91–98. [PubMed] [Google Scholar]
- 10. Trew DR, Smith SE (1991) Postural studies in pulsatile ocular blood flow: II. Chronic open angle glaucoma. Br J Ophthalmol 75: 71–75. [DOI] [PMC free article] [PubMed] [Google Scholar]
- 11. Langham ME (1994) Ocular blood flow and vision in healthy and glaucomatous eyes. Surv Ophthalmol 38 Suppl: S161–168 [DOI] [PubMed] [Google Scholar]
- 12. Lieb WE, Cohen SM, Merton DA, Shields JA, Mitchell DG, et al. (1991) Color Doppler imaging of the eye and orbit. Technique and normal vascular anatomy. Arch Ophthalmol 109: 527–531. [DOI] [PubMed] [Google Scholar]
- 13. Kaiser HJ, Schotzau A, Flammer J (1996) Blood-flow velocities in the extraocular vessels in normal volunteers. Am J Ophthalmol 122: 364–370. [DOI] [PubMed] [Google Scholar]
- 14. Garhofer G, Fuchsjager-Mayrl G, Vass C, Pemp B, Hommer A, et al. (2010) Retrobulbar blood flow velocities in open angle glaucoma and their association with mean arterial blood pressure. Invest Ophthalmol Vis Sci 51: 6652–6657. [DOI] [PubMed] [Google Scholar]
- 15. Cellini M, Possati GL, Caramazza N, Caramazza R (1996) Colour Doppler analysis of the choroidal circulation in chronic open-angle glaucoma. Ophthalmologica 210: 200–202. [DOI] [PubMed] [Google Scholar]
- 16. Harris A, Sergott RC, Spaeth GL, Katz JL, Shoemaker JA, et al. (1994) Color Doppler analysis of ocular vessel blood velocity in normal-tension glaucoma. Am J Ophthalmol 118: 642–649. [DOI] [PubMed] [Google Scholar]
- 17. Erickson SJ, Hendrix LE, Massaro BM, Harris GJ, Lewandowski MF, et al. (1989) Color Doppler flow imaging of the normal and abnormal orbit. Radiology 173: 511–516. [DOI] [PubMed] [Google Scholar]
- 18. Abegao Pinto L, Vandewalle E, Stalmans I (2012) Disturbed correlation between arterial resistance and pulsatility in glaucoma patients. Acta Ophthalmol 90: 214–220. [DOI] [PubMed] [Google Scholar]
- 19. Butt Z, O'Brien C, McKillop G, Aspinall P, Allan P (1997) Color Doppler imaging in untreated high- and normal-pressure open-angle glaucoma. Invest Ophthalmol Vis Sci 38: 690–696. [PubMed] [Google Scholar]
- 20. Butt Z, McKillop G, O'Brien C, Allan P, Aspinall P (1995) Measurement of ocular blood flow velocity using colour Doppler imaging in low tension glaucoma. Eye (Lond) 9 (Pt 1): 29–33. [DOI] [PubMed] [Google Scholar]
- 21. Rankin SJ, Walman BE, Buckley AR, Drance SM (1995) Color Doppler imaging and spectral analysis of the optic nerve vasculature in glaucoma. Am J Ophthalmol 119: 685–693. [DOI] [PubMed] [Google Scholar]
- 22. Planiol T, Pourcelot L, Pottier JM, Degiovanni E (1972) [Study of carotid circulation by means of ultrasonic methods and thermography]. Rev Neurol (Paris) 126: 127–141. [PubMed] [Google Scholar]
- 23. Higgins JP, Thompson SG, Deeks JJ, Altman DG (2003) Measuring inconsistency in meta-analyses. Bmj 327: 557–560. [DOI] [PMC free article] [PubMed] [Google Scholar]
- 24. Egger M, Davey Smith G, Schneider M, Minder C (1997) Bias in meta-analysis detected by a simple, graphical test. Bmj 315: 629–634. [DOI] [PMC free article] [PubMed] [Google Scholar]
- 25. Begg CB, Mazumdar M (1994) Operating characteristics of a rank correlation test for publication bias. Biometrics 50: 1088–1101. [PubMed] [Google Scholar]
- 26. Baxter GM, Williamson TH, McKillop G, Dutton GN (1992) Color Doppler ultrasound of orbital and optic nerve blood flow: effects of posture and timolol 0.5%. Invest Ophthalmol Vis Sci 33: 604–610. [PubMed] [Google Scholar]
- 27. Steigerwalt RD Jr, Belcaro G, Cesarone MR, Laurora G, De Sanctis MT, et al. (1993) Doppler ultrasonography of the central retinal artery in normals treated with topical timolol. Eye (Lond) 7 (Pt 3): 403–406. [DOI] [PubMed] [Google Scholar]
- 28.Abegao Pinto L, Vandewalle E, De Clerck E, Marques-Neves C, Stalmans I (2012) Lack of spontaneous venous pulsation: possible risk indicator in normal tension glaucoma? Acta Ophthalmol. [DOI] [PubMed]
- 29. Birinci H, Danaci M, Oge I, Erkan ND (2002) Ocular blood flow in healthy and primary open-angle glaucomatous eyes. Ophthalmologica 216: 434–437. [DOI] [PubMed] [Google Scholar]
- 30. Detorakis ET, Achtaropoulos AK, Drakonaki EE, Kozobolis VP (2007) Hemodynamic evaluation of the posterior ciliary circulation in exfoliation syndrome and exfoliation glaucoma. Graefes Arch Clin Exp Ophthalmol 245: 516–521. [DOI] [PubMed] [Google Scholar]
- 31. Galambos P, Vafiadis J, Vilchez SE, Wagenfeld L, Matthiessen ET, et al. (2006) Compromised autoregulatory control of ocular hemodynamics in glaucoma patients after postural change. Ophthalmology 113: 1832–1836. [DOI] [PubMed] [Google Scholar]
- 32. Gherghel D, Orgul S, Gugleta K, Gekkieva M, Flammer J (2000) Relationship between ocular perfusion pressure and retrobulbar blood flow in patients with glaucoma with progressive damage. Am J Ophthalmol 130: 597–605. [DOI] [PubMed] [Google Scholar]
- 33. Gugleta K, Orgul S, Flammer J (1999) Is corneal temperature correlated with blood-flow velocity in the ophthalmic artery? Curr Eye Res 19: 496–501. [DOI] [PubMed] [Google Scholar]
- 34. Kaiser HJ, Schoetzau A, Stumpfig D, Flammer J (1997) Blood-flow velocities of the extraocular vessels in patients with high-tension and normal-tension primary open-angle glaucoma. Am J Ophthalmol 123: 320–327. [DOI] [PubMed] [Google Scholar]
- 35. Liu CJ, Chiou HJ, Chiang SC, Chou JC, Chou YH, et al. (1999) Variations in ocular hemodynamics in patients with early and late glaucoma. Acta Ophthalmol Scand 77: 658–662. [DOI] [PubMed] [Google Scholar]
- 36. Pemp B, Garhofer G, Lasta M, Schmidl D, Wolzt M, et al. (2012) The effects of moxaverine on ocular blood flow in patients with age-related macular degeneration or primary open angle glaucoma and in healthy control subjects. Acta Ophthalmol 90: 139–145. [DOI] [PubMed] [Google Scholar]
- 37. Sekeroglu MA, Irkec M, Mocan MC, Ileri E, Dikmenoglu N, et al. (2011) The association of ocular blood flow with haemorheological parameters in primary open-angle and exfoliative glaucoma. Acta Ophthalmol 89: 429–434. [DOI] [PubMed] [Google Scholar]
- 38. Stalmans I, Harris A, Fieuws S, Zeyen T, Vanbellinghen V, et al. (2009) Color Doppler imaging and ocular pulse amplitude in glaucomatous and healthy eyes. Eur J Ophthalmol 19: 580–587. [DOI] [PubMed] [Google Scholar]
- 39. Yuksel N, Karabas VL, Demirci A, Arslan A, Altintas O, et al. (2001) Comparison of blood flow velocities of the extraocular vessels in patients with pseudoexfoliation or primary open-angle glaucoma. Ophthalmologica 215: 424–429. [DOI] [PubMed] [Google Scholar]
- 40. Galassi F, Giambene B, Menchini U (2008) Ocular perfusion pressure and retrobulbar haemodynamics in pseudoexfoliative glaucoma. Graefes Arch Clin Exp Ophthalmol 246: 411–416. [DOI] [PubMed] [Google Scholar]
- 41. Martinez A GF, Capeans C (1999) Dorzolamide effect on ocular blood flow. 40: 1270–1275. [PubMed] [Google Scholar]
- 42. Hosking SL, Harris A, Chung HS, Jonescu-Cuypers CP, Kagemann L, et al. (2004) Ocular haemodynamic responses to induced hypercapnia and hyperoxia in glaucoma. Br J Ophthalmol 88: 406–411. [DOI] [PMC free article] [PubMed] [Google Scholar]
- 43. Liu X, Ge J, Zhou W, Lin Y, Cai X (1998) Hemodynamics of ophthalmic artery and central retinal artery and correlation with other factors in patients with primary open angle glaucoma. Yan Ke Xue Bao 14: 138–144. [PubMed] [Google Scholar]
- 44. Januleviciene I SI, Siesky B, Harris A (2008) Diagnostic compatibility of structural and haemodynamic parameters in open-angle glaucoma patients. Acta Ophthalmol 86: 552–557. [DOI] [PubMed] [Google Scholar]
- 45. Akarsu C, Bilgili MY (2004) Color Doppler imaging in ocular hypertension and open-angle glaucoma. Graefes Arch Clin Exp Ophthalmol 242: 125–129. [DOI] [PubMed] [Google Scholar]
- 46. Zhong Y, Min Y, Jiang Y, Cheng Y, Qin J, et al. (2009) Color Doppler imaging and pattern visual evoked potential in normal tension glaucoma and hypertension glaucoma. Doc Ophthalmol 119: 171–180. [DOI] [PubMed] [Google Scholar]
- 47. Simsek T, Yanik B, Conkbayir I, Zilelioglu O (2006) Comparative analysis of the effects of brimonidine and dorzolamide on ocular blood flow velocity in patients with newly diagnosed primary open-angle glaucoma. J Ocul Pharmacol Ther 22: 79–85. [DOI] [PubMed] [Google Scholar]
- 48. Quigley HA, Broman AT (2006) The number of people with glaucoma worldwide in 2010 and 2020. Br J Ophthalmol 90: 262–267. [DOI] [PMC free article] [PubMed] [Google Scholar]
- 49. Hansen NB, Stonestreet BS, Rosenkrantz TS, Oh W (1983) Validity of Doppler measurements of anterior cerebral artery blood flow velocity: correlation with brain blood flow in piglets. Pediatrics 72: 526–531. [PubMed] [Google Scholar]
- 50. Taylor GA, Short BL, Walker LK, Traystman RJ (1990) Intracranial blood flow: quantification with duplex Doppler and color Doppler flow US. Radiology 176: 231–236. [DOI] [PubMed] [Google Scholar]
- 51. Platt JF, Ellis JH, Rubin JM, DiPietro MA, Sedman AB (1990) Intrarenal arterial Doppler sonography in patients with nonobstructive renal disease: correlation of resistive index with biopsy findings. AJR Am J Roentgenol 154: 1223–1227. [DOI] [PubMed] [Google Scholar]
- 52. Rifkin MD, Needleman L, Pasto ME, Kurtz AB, Foy PM, et al. (1987) Evaluation of renal transplant rejection by duplex Doppler examination: value of the resistive index. AJR Am J Roentgenol 148: 759–762. [DOI] [PubMed] [Google Scholar]
- 53. Brusini P, Zeppieri M, Tosoni C, Parisi L, Felletti M, et al. (2008) Stratus-OCT imaging in early glaucomatous and in ocular hypertensive patients with and without frequency-doubling technology abnormalities. Eye (Lond) 22: 406–413. [DOI] [PubMed] [Google Scholar]
- 54. Sihota R, Sony P, Gupta V, Dada T, Singh R (2006) Diagnostic capability of optical coherence tomography in evaluating the degree of glaucomatous retinal nerve fiber damage. Invest Ophthalmol Vis Sci 47: 2006–2010. [DOI] [PubMed] [Google Scholar]
Associated Data
This section collects any data citations, data availability statements, or supplementary materials included in this article.
Supplementary Materials
PRISMA checklist.
(DOC)
characteristics of included studies.
(DOC)


