

Abstract
Purpose
To investigate the feasibility of using magnetic resonance elastography (MRE) for the evaluation of the stiffness of in vivo aortic wall.
Materials and Methods
To validate the experimental approach for imaging the aorta in vivo, a gel phantom with an embedded porcine aorta was imaged in the presence of fluid flow within the aorta. The potential changes in the elasticity of the vessel wall with changes in pressure were investigated. The feasibility of performing MRE of abdominal aorta was assessed in five volunteers (Age 22–40 years; BMI 21.5–25.2 kg/m2). The pulse-gated cine MRE technique was used to study the wave propagation along the aorta throughout the cardiac cycle and provide estimates of aortic stiffness in diastole.
Results
In the phantom study, the wave propagation was well visualized within the porcine aorta embedded in the gel phantom. An increase of the Young's modulus-wall thickness (E*t) product with the increase in static pressure was observed. In the in vivo study, the waves were well visualized within the lumen of abdominal aorta in the five volunteers in diastolic phase, but they were not well visualized during systole.
Conclusion
MRE is feasible for noninvasively assessing the stiffness of the abdominal aorta and merits further investigation.
Keywords: MRI, elastography, aorta, stiffness
In recent years, great emphasis has been placed on the role of arterial stiffness in the development of cardiovascular diseases. Arterial stiffening is associated with increased risk of cardiovascular events and mortality in hypertensive patients (1, 2). The aorta is a major vessel of interest when determining arterial stiffness for the reason that the thoracic and abdominal aorta makes the largest contribution to arterial buffering (3).
Early detection of arterial stiffening is important to better identify those at higher risk for subsequent cardiovascular outcomes, and to modify their clinical course by utilizing appropriate medical and behavioral interventions.
Several noninvasive techniques have been used for the assessment of arterial elasticity in vivo, such as aortic pulse wave velocity (PWV) and aortic augmentation index (AI). The main limitation of PWV and AI interpretation is that they are influenced by blood pressure (4). Reproducibility and operator dependence are barriers to their wide clinical use (5). Other MR method for determining aortic distensibility has been reported. The evaluation of cyclical changes in strain in the wall of aorta is feasible by using cine phase-contrast MRI (6, 7).
Magnetic resonance elastography (MRE) has been developed to noninvasively assess the mechanical properties of soft tissue by imaging the propagation shear waves in the tissue (8). MRE has been successfully used to study the viscoelastic properties of a variety of human organs in vivo (9–13). Prior studies have shown that MRE has the potential to evaluate the elastic properties of vessel walls by imaging propagating mechanical waves within fluid-filled vessels (14). Measurement of the elastic properties of ex vivo porcine aortas in control and hypertensive groups using MRE has been reported (15). Kolipaka et al. reported the first in vivo aortic MRE study in 3 normal and one hypertensive volunteers (16). The initial study was limited by the use of a nongated MRE protocol that included data from across the cardiac cycle and thus the feasibility of MRE in the evaluation of aortic stiffness in vivo has not been well studied. The hypothesis of this study is that MRE can assess the mechanical properties of the aortic wall in vivo by imaging these waves using a cardiac-gated MRE acquisition.
MATERIALS AND METHODS
Phantom Study
A phantom study was first performed to model the process of introducing mechanical waves into the aorta in vivo. A porcine aorta was harvested after euthanasia. The side branches of the aorta were tied off. The aortic sample was subjected to 10% neutral buffered formalin (Fisher Scientific Company L.L.C. Kalamazoo, MI) for 3 days. The aorta was connected to additional tubing so that water could be circulated through the aorta during the experiments. A tissue-simulating 10% B-gel (Bovine Skin Powder, Sigma-Aldrich, St. Louis, MO) was made in a cylindrical container to mimic the abdominal tissue the mechanical vibrations must pass through to get to the aorta in vivo. The porcine aorta was then embedded at the bottom of the gel phantom with the ends exposed.
In order to investigate the potential changes of elasticity in the vessel wall due to changes in pressure, static pressures of 20–120 were applied by changing the altitude of a saline bag connected to the aorta. The phantom was placed in a single-channel transmit-receive (T/R) head coil and shear waves were generated by placing a small plastic passive driver (6-cm diameter) on top of the phantom at one end of the aorta. The pneumatic driver system (12, 13) generated motion at the surface of the phantom which produced shear waves that propagated through the phantom and into the aorta. Imaging was performed using a 1.5-T whole-body imager (GE Medical Systems, Waukesha, WI, USA). Sagittal-oblique localizer images were first acquired using a T2-weighted single-shot fast spin echo (SSFSE) sequence. A two-dimensional nongated gradient-echo MRE sequence was used (8). Data acquisition parameters were as follows: one 24-cm FOV, 3-mm thick sagittal-oblique slice at the center of the aorta with frequency-encoding in the SI direction, TR/TE = 66.6/26.6 ms, 256 × 96 acquisition matrix with a 0.75 FOV in the phase-encoding direction (images interpolated to 256 × 256), 30° flip angle, and ±31.25-kHz bandwidth. One 16.7-ms, 1.6 G/cm, first gradient moment nulled motion-encoding gradient was applied in the frequency-encoding direction. The driver produced 60-Hz vibrations which were transmitted to the embedded vessel via the gel and caused harmonic mechanical waves to propagate longitudinally along the vessel. The imaging sequence sends out a TTL trigger pulse each TR to the driver system to resynchronize the imaging sequence with the motion to maintain a particular phase relationship between the motion and the imaging sequence (called a “phase offset”), and the motion trigger was adjusted during the scan to obtain images at 4 different phase offsets between the motion and the motion-encoding gradients equally spaced over one cycle of the motion.
The stiffness of the aorta was reported as the mean E*t product and calculated using the following expression, which was developed previously (14)
where E is the Young's modulus, t is the wall thickness of the aorta, ai is the interior aorta radius, ρ is the density of the interior fluid, λ is the wavelength, and f is the frequency of vibration. The wavelength of the waves in the aorta was calculated from the MRE wave images via peak-to-peak distance measurements. The interior diameter of the aorta was measured using SSFSE images.
To validate the ability to perform MRE under dynamic vascular flow conditions, a computer-controlled pump system was used to produce fluid flow in the aorta with deionized water. The system allows programmable flow rates for continuous and pulsatile flow profiles. Pulsatile flow at 20 beats per minutes with a peak velocity of 25 cm/s opposite of the location of the driver was used. A gated cine phase-contrast gradient echo MRE pulse sequence was used for data acquisition (Fig. 1). The multiphase cine MRE sequence performed continuous data acquisition throughout the pulse cycle with pulse gating and retrospective view sharing (2 views per segement, VPS) to reconstruct images at 10 phases of the pulse cycle. A single 3-mm-thick sagittal-oblique slice along the aorta was obtained. The imaging parameters included four phase offsets; one pair of 1.6 G/cm, 16.7-ms, first gradient moment nulled motion-encoding gradients in the SI direction; 220 × 64 acquisition matrix interpolated to 256 × 256; 15° flip angle; 24-cm FOV; TR/TE = 33.3/21 ms; ±62.5-kHz bandwidth; and SI frequency-encoding direction.
Figure 1.
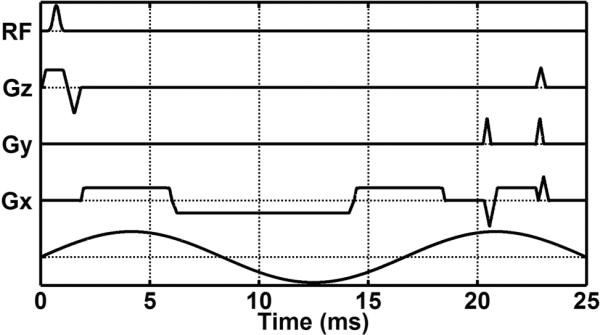
Diagram of the gated cine gradient-echo MRE pulse sequence. The multiphase cine MRE sequence performs continuous data acquisition throughout the cardiac cycle with gating and retrospective view sharing to reconstruct images at different phases of the cardiac cycle.
In vivo Aorta MRE
The feasibility of performing vascular MRE of the abdominal aorta in vivo was assessed in five healthy male volunteers (mean age: 32 ± 7.4 years, range 22 – 40 years; mean BMI: 23.0 ± 1.6 kg/m2, range 21.5 – 25.2 kg/m2). The Institutional Review Board approved the study and a written informed consent was obtained from all the volunteers. None of the volunteers had previous diagnoses of cardiovascular disease, diabetes mellitus, or hypertension.
The acoustic passive driver system utilized was similar to the previously described driver for the phantom study except that the drum-like driver was larger with a diameter of 19 cm. The volunteers were positioned in the supine position and placed feet first into the scanner. The passive driver was positioned against the lower anterior abdominal wall (with the center at the level of the L5 vertebral body) and secured with an elastic belt. The active driver, vibrating at 60 Hz, produced vibrations which were transmitted into the abdomen and produced waves within the abdominal aorta. Imaging was performed using an 8-channel receive-only coil. Before the MRE scan, sagittal-oblique images were first acquired using a cardiac gated T2-weighted SSFSE sequence to visualize the aorta itself. The same gated cine gradient-echo MRE pulse sequence used in the phantom study was used to acquire images showing the mechanical wave propagation within the abdominal aorta. 2 VPS were used during data acquisition for the view sharing and 10 phases across the cardiac cycle were reconstructed. A single 5-mm-thick sagittal-oblique slice along the abdominal aorta was obtained. The imaging parameters included four phase offsets; one pair of 1.6–2.8 G/cm, 16.7-ms, first gradient moment nulled motion-encoding gradients in the SI direction (the amplitude of the gradients was different for different subjects to maximize the motion sensitivity while maintaining an acceptable level of phase aliasing in the MRE phase images); 220 × 64 acquisition matrix (with an ASSET acceleration factor of 2) interpolated to 256 × 256; 15° flip angle; 33 cm FOV; TR/TE = 33.3/21 ms; ±62.5-kHz bandwidth; and SI frequency-encoding direction. End-expiration breathholds were employed to reduce respiratory artifacts for each acquisition. The total acquisition time was approximately 1–1.5 minutes split into 4 periods of suspended respiration.
The interior aorta diameter was measured on the SSFSE images at diastole. Preprocessing of the MRE data consisted of unwrapping the phase (displacement) data, Fourier transforming the displacement data through the time offsets to extract the motion at the fundamental frequency of the vibration, and directional filtering to isolate wave propagation occurring along the vessel (17). The directional filter was designed to be oriented in the SI direction to isolate wave propagation superiorly up the aorta with a cosine-squared angular weighting in the spatial-frequency domain and with a 4th-order Butterworth bandpass filter in the radial direction (cut-off frequencies of 4 and 40 cycles/FOV to reduce the effects of noise and low spatial frequency compressional wave motion). The wavelength of the motion was measured in the directionally filtered wave images. The wavelength of the wave images from the diastolic phase was measured and the stiffness (E*t product) was calculated as in the phantom study. At this frequency of vibration, 0.5 to 1.5 wavelengths of motion were observed in the segment of the aorta imaged. The wavelength was measured using the longest peak-to-peak or peak-to-trough distance observable in the filtered wave images.
Statistical Analysis
A spearman's linear regression was performed to compare the aortic wall stiffness and the static pressure applied in the first phantom study and to evaluate the relationship between aortic stiffness and age in human study. A value of p < 0.05 indicated a statistically significant difference. Statistical software (JMP 8.0; SAS, Cary, NC, USA) was used to perform the statistical analysis.
RESULTS
Phantom Study
The mechanical waves were easily transmitted to and well visualized within the lumen of the porcine aorta embedded in the gel phantom. An increase of the E*t product with the increase in static pressure was observed. Regression analysis revealed a strong correlation between E*t product and static pressure (r2=0.91, p<0.01) (Fig. 2). In the pulsatile flow experiments, the wave propagation within the lumen along the vessel was clearly visible during the diastolic phases of the pulsation, but the wave propagation was not as well visualized during the systolic phases (Fig. 3). When no external motion is applied, no discernible waves were seen.
Figure 2.
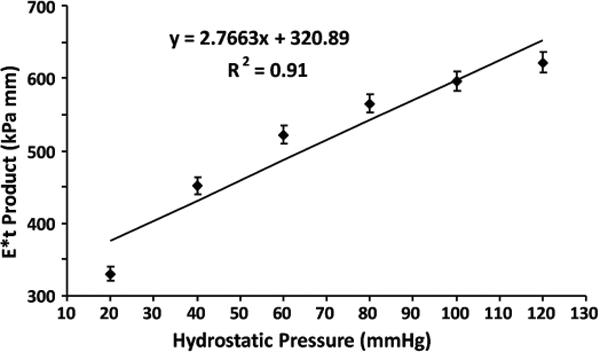
Relationship between stiffness of the aortic wall and the static pressure within the vessel. The E*t product increased with the increase in static pressure and a strong correlation was observed (p < 0.01).
Figure 3.

Wave propagation in the ex vivo porcine aorta embedded in the gel phantom (the bottom of the phantom is on the right side of these images). Images were obtained with a driver located on the bottom-left of these images. The magnitude image (A) shows the porcine aorta in the gel phantom. The phase/wave images (B, C, and D). were acquired with the gated cine MRE technique with the application of pulsatile flow in the aorta (20 BPM, peak velocity of 25 cm/s). Image was acquired with no external vibration at a diastolic phase (B). Images were acquired with external vibration of 60 Hz (C and D). The direction of wave propagation within the aorta was opposite of the direction of fluid flow. In the wave image in the systolic phase (C), the motion was dominated by fluid flow. However, the wave image in the diastolic phase (D) shows distinctive wave propagation.
In vivo Study
The external vibrations were well tolerated by all of the subjects and the mechanical waves were easily transmitted to and well visualized within the lumen of the abdominal aorta in all 5 subjects. The waves were well visualized during the diastolic phase, but the wave propagation was significantly influenced by blood flow during the systolic phase. Motion artifacts in the images caused by blood pulsation were also more severe in the systolic phase. The induced waves propagated longitudinally along the abdominal aorta within the lumen from the distal segment, which was the actuating side, to the proximal segment. When no external motion was applied, no discernible waves were observed (Fig. 4). The wave propagation was observed in the distal abdominal aorta just below the level of superior mesentery artery. The wave propagation was attenuated above the bifurcation of the superior mesentery artery and celiac artery. The wave images acquired during the systolic phase were not suitable for wavelength measurement. Regression analysis revealed a significant correlation between E*t product from wave images acquired during the diastolic phase in the five volunteers and their age (r2=0.81, p<0.05) (Fig. 5).
Figure 4.
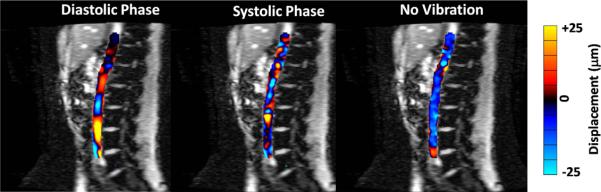
Wave images masked and overlaid on the magnitude images obtained with the pulse-gated cine MRE sequence in the abdominal aorta in a healthy volunteer. Wave images are shown at a diastolic phase (A) and a systolic phase (B). The mechanical wave propagation along the vessel was well visualized during diastole, but the wave propagation was significantly influenced by blood flow during systole. Wave data obtained with no external vibration during diastole shows that no waves are present without the external vibration (C).
Figure 5.
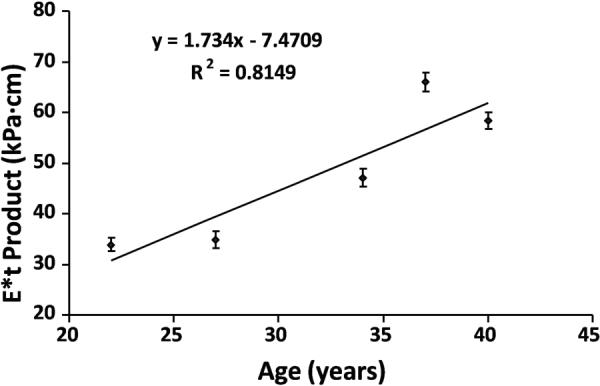
Relationship between the estimated stiffness of the aortic wall and the age of volunteers. A significant correlation was observed (p < 0.05).
DISCUSSION
The potential advantages of MRE for the evaluation of aortic stiffness include enabling the imaging plane to be placed longitudinal to the vessel in a reproducible location and less operator dependence on the measured stiffness values compared to ultrasound-based measurement.
Prior studies have shown MRE can be used to image propagating mechanical waves within fluid-filled vessels using an electromechanical driver directly coupled to the vessel wall (14, 15). However, this approach is not practical for applying mechanical waves to the abdominal aorta due to the presence of the peritoneal space and intestines. Therefore, we tested an approach in which longitudinal vibrations are applied to the abdominal wall via a passive driver. Our phantom study proved that the mechanical waves were well transmitted to the porcine aorta embedded in the bottom of gel and propagated longitudinally along the vessel lumen. We investigated the potential changes of stiffness in the aortic wall due to changes in pressure and the results demonstrated a strong correlation between E*t product and static pressure. Our investigation has been performed in a pilot study setting. This result is limited by too small sampling size to make a solid statement. We also have no well-established physical model for aorta stiffness versus pressure. The potential stiffness change with pressure indicates that it may be possible with MRE to detect differences in aortic wall stiffness between diastole and systole. Therefore, we developed a gated cine gradient-echo MRE sequence for data acquisition. This gated cine MRE sequence allows for continuous data acquisition throughout the cardiac cycle and the reconstruction of images at different phases of the cardiac cycle.
The velocity of blood flow during the postdiastolic and presystolic phases of the cardiac cycle is approximately zero in the abdominal aorta (18). Our in vivo study demonstrated that mechanical wave propagation was well visualized during diastole, while the wave propagation was significantly influenced by blood flow and not of sufficient quality for wavelength measurement during systole. The results were also confirmed by the phantom study with pulsatile flow using the cine MRE acquisition. Arterial walls stiffen with age (5). Our preliminary results revealed a significant correlation between estimated aortic wall stiffness and the age in the healthy volunteers, although this result is limited by very small number of subjects and without consideration of diastolic pressure change.
There were several limitations in this study to be addressed in future work. First, the reported E*t products measured by MRE in the phantom study and the in vivo study do not take into account the true 3D wave propagation within the aorta, the complex geometry of the aorta, or the nonlinear anisotropic viscoelastic nature of the aorta. Furthermore, determining the wavelength of the waves in the aorta by measuring the peak-to-peak distance of the waves could be further improved (both in precision and in resolution) using other techniques, such as fitting the measured displacement data to sinusoidal functions to directly determine the wavelength or to estimate it from the change in phase of the fits along the aorta. Second, in the phantom study, the computer-controlled pulsatile flow simulation was not able to fully reproduce the fully realistic physiological flow waveforms. Third, our preliminary in vivo study was limited by the small number of volunteers and the bias in the BMI distribution of this set of subjects. Larger volunteers were not tested and may offer additional challenges for transmitting the mechanical waves into the aorta. Fourth, our human study used a peripheral pulse signal rather than an ECG signal for the gating, which produced a subject-dependent unknown phase delay to the images of the aortic pulsation. Fifth, correlation result between estimated aortic wall stiffness and the age should be cautiously interpreted. The very preliminary result is limited by very small sample size and age distribution as well as without considering pressure change. Future work with a larger population of subjects would help to validate the result.
In this study, we investigated the feasibility of using MRE to assess the mechanical properties of the aortic wall in vivo by imaging the propagation of externally produced mechanical waves within the abdominal aorta. We believe this work provides preliminary evidence that the mechanical properties of the in vivo aorta can be measured with MRE. Additional future work will include refinements to the methodology (such as incorporating more accurate ECG gating, true three-dimensional data acquisition, and a more refined inversion algorithm) while evaluating the diagnostic potential of this technique (such as for hypertension, and studying age and gender-related changes in aortic stiffness, including animal studies).
Acknowledgments
This work has been supported by NIH grant EB001981, partly supported by the Natural Science Foundation of China (grant 81041013 and 81271542), International Collaboration Program from Chinese Ministry of Science and Technology (2010DFB30040), and a Program for Excellent Talents from Beijing city (2001D003034000030). The authors thank Diane M. Sauter for technical assistance.
REFERENCES
- 1.Laurent S, Boutouyrie P, Asmar R, et al. Aortic stiffness is an independent predictor of all-cause and cardiovascular mortality in hypertensive patients. Hypertension. 2001;37:1236–1241. doi: 10.1161/01.hyp.37.5.1236. [DOI] [PubMed] [Google Scholar]
- 2.Laurent S, Katsahian S, Fassot C, et al. Aortic stiffness is an independent predictor of fatal stroke in essential hypertension. Stroke. 2003;34:1203–1206. doi: 10.1161/01.STR.0000065428.03209.64. [DOI] [PubMed] [Google Scholar]
- 3.Laurent S, Cockcroft J, Van Bortel L, et al. Expert consensus document on arterial stiffness: methodological issues and clinical applications. Eur Heart J. 2006;27:2588–2605. doi: 10.1093/eurheartj/ehl254. [DOI] [PubMed] [Google Scholar]
- 4.Oliver JJ, Webb DJ. Noninvasive assessment of arterial stiffness and risk of atherosclerotic events. Arterioscler Thromb Vasc Biol. 2003;23:554–566. doi: 10.1161/01.ATV.0000060460.52916.D6. [DOI] [PubMed] [Google Scholar]
- 5.Lee HY, Oh BH. Aging and arterial stiffness. Circ J. 2010;74:2257–2262. doi: 10.1253/circj.cj-10-0910. [DOI] [PubMed] [Google Scholar]
- 6.Wedding KL, Draney MT, Herfkens RJ, et al. Measurement of vessel wall strain using cine phase contrast MRI. J Magn Reson Imaging. 2002;15:418–428. doi: 10.1002/jmri.10077. [DOI] [PubMed] [Google Scholar]
- 7.Draney MT, Herfkens RJ, Hughes TJ, et al. Quantification of vessel wall cyclic strain using cine phase contrast magnetic resonance imaging. Ann Biomed Eng. 2002;30:1033–1045. doi: 10.1114/1.1513566. [DOI] [PubMed] [Google Scholar]
- 8.Muthupillai R, Lomas DJ, Rossman PJ, et al. Magnetic resonance elastography by direct visualization of propagating acoustic strain waves. Science. 1995;269:1854–1857. doi: 10.1126/science.7569924. [DOI] [PubMed] [Google Scholar]
- 9.McKnight AL, Kugel JL, Rossman PJ, et al. MR elastography of breast cancer: preliminary results. AJR Am J Roentgenol. 2002;178:1411–1417. doi: 10.2214/ajr.178.6.1781411. [DOI] [PubMed] [Google Scholar]
- 10.Xu L, Lin Y, Han JC, et al. Magnetic resonance elastography of brain tumors: preliminary results. Acta Radiol. 2007;48:327–330. doi: 10.1080/02841850701199967. [DOI] [PubMed] [Google Scholar]
- 11.Ringleb SI, Bensamoun SF, Chen Q, et al. Applications of magnetic resonance elastography to healthy and pathologic skeletal muscle. J Magn Reson Imaging. 2007;25:301–309. doi: 10.1002/jmri.20817. [DOI] [PubMed] [Google Scholar]
- 12.Yin M, Talwalkar JA, Glaser KJ, et al. Assessment of hepatic fibrosis with magnetic resonance elastography. Clin Gastroenterol Hepatol. 2007;5:1207–1213. doi: 10.1016/j.cgh.2007.06.012. [DOI] [PMC free article] [PubMed] [Google Scholar]
- 13.McGee KP, Hubmayr RD, Ehman RL. MR elastography of the lung with hyperpolarized 3He. Magn Reson Med. 2008;59:14–18. doi: 10.1002/mrm.21465. [DOI] [PubMed] [Google Scholar]
- 14.Woodrum DA, Romano AJ, Lerman A, et al. Vascular wall elasticity measurement by magnetic resonance imaging. Magn Reson Med. 2006;56:593–600. doi: 10.1002/mrm.20991. [DOI] [PubMed] [Google Scholar]
- 15.Woodrum DA, Herrmann J, Lerman A, et al. Phase-contrast MRI-based elastography technique detects early hypertensive changes in ex vivo porcine aortic wall. J Magn Reson Imaging. 2009;29:583–587. doi: 10.1002/jmri.21702. [DOI] [PMC free article] [PubMed] [Google Scholar]
- 16.Kolipaka A, Woodrum DA, Gorny KR, et al. MR Elastography of the In Vivo Abdominal Aorta: Feasibility Study. Proceedings of the 19th Annual Meeting of ISMRM; Stockholm. 2010. abstract 1257. [Google Scholar]
- 17.Manduca A, Lake DS, Kruse SA, et al. Spatio-temporal directional filtering for improved inversion of MR elastography images. Med Image Anal. 2003;7:465–473. doi: 10.1016/s1361-8415(03)00038-0. [DOI] [PubMed] [Google Scholar]
- 18.Maier SE, Meier D, Boesiger P, et al. Human abdominal aorta: comparative measurements of blood flow with MR imaging and multigated Doppler US. Radiology. 1989;171:487–492. doi: 10.1148/radiology.171.2.2649924. [DOI] [PubMed] [Google Scholar]