Abstract
Pump-probe microscopy non-destructively differentiates eumelanin and pheomelanin and can be used to quantify melanin distributions in thin biopsy slices. Here we have extended that work for imaging eumelanin and pheomelanin distributions on a sub-cellular scale, allowing elucidation of characteristics of different cell types. The results show that melanin heterogeneity, previously found to be characteristic of melanomas, persists on the sub-cellular scale. We have also found spectral changes associated with melanin located in melanophages, which could potentially differentiate invasive pigmented melanocytes from melanophages without immunohistochemical staining.
Introduction
Melanoma diagnosis presents important unmet clinical challenges. On the one hand, the ramatic mismatch between increases in detection and mortality rates (report, 2010) may suggest significant overcalling (Glusac, 2011; Swerlick and Chen, 1996). On the other hand, nearly one in ten patients with thin melanomas (<1 mm) and no initial evidence of metastases develops recurrences (Kalady, White et al. 2003) – and there are no good markers to suggest which ones. Melanin chemistry is a natural biomarker of melanocyte activity, and is a promising marker to differentiate benign, dysplastic, and malignant pigmented lesions (Sealy et al, 1982; Lazova and Pawelek, 2009; Marchesini et al, 2009; Biesemeier et al, 2011). However, traditional methods lack critical spatial and morphological information. For example, a key metric for pathologists is melanocyte density and melanocyte-to-keratinocyte ratio (Herlyn and Shih, 1994), so it is important to differentiate cell type (melanocyte, keratinocyte, melanophage, etc.). Also, melanocytes in the dermis are very concerning (Clark et al, 1969), while macrophages are less concerning, even though both can be pigmented—hence the need for immunohistochemistry. Electron microscopy (Vinther et al, 2008; Jimbow et al, 1983) provides spatial information, but it is not quantitative, provides no molecular contrast, and is prone to mistaking melanosome shapes for other objects if the melanosomes are not purified. In this paper, we extend our recently demonstrated pump-probe technique for quantitative imaging of eumelanin and pheomelanin (Matthews et al, 2011) to extract subcellular resolution and morphological information not attainable by any other method.
Pump-probe imaging using the near-infrared spectrum is ideal for biological applications due to the enhanced penetration depth of near-infrared compared to ultra-violet or visible light, inherent sectioning capabilities, and low sample damage from heating (comparable to methods using very low power continuous wave lasers). We have previously shown that this method gives intrinsic contrast in a variety of biological applications, including differentiating oxy- and deoxyhemoglobin (Fu et al, 2007) and melanin distributions on a variety of scales, from skin cross sections (Matthews et al, 2011a) to entire pigmented lesions in vivo (Matthews et al, 2011b). Eumelanin and pheomelanin have broad, featureless linear absorption spectra; however they can be easily differentiated because their pump-probe spectra reflect many competing nonlinear processes (including excited state absorption, stimulated emission, and ground state depletion). Thus the technique is effective even when highly absorbing fluorophores are present (such as hematoxylin and eosin in previously stained slides) (Matthews et al, 2011a).
Specifically, we investigate a number of pigmented lesions with high spatial resolution and more spectroscopic detail, examining differences in pigment chemistry down to the level of individual melanosomes. We refine our distinction of melanins to not just eumelanin versus pheomelanin, but also sub-classes of eumelanin. Our multi-modality microscope (described in the materials and methods section) shows cell structure including melanocytic dendrites and melanosomes, cell nuclei, cell membranes, and presence of collagen. We observe melanin in macrophages that is spectroscopically different from melanin in epidermal cells, the random spatial distribution of melanin in melanocytic nests, supranuclear caps pointing perpendicular to the basal layer, and individual melanocytes and keratinocytes containing both eumelanin and pheomelanin.
Results
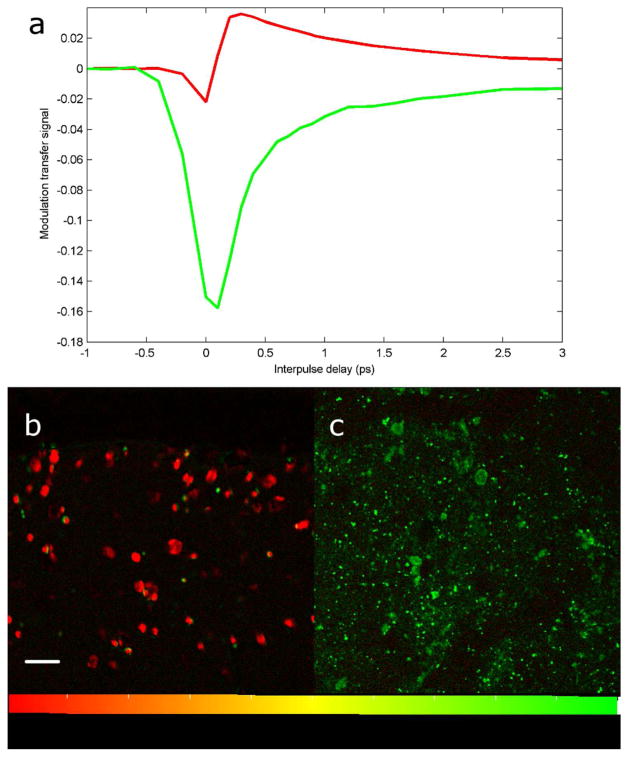
Melanin standards in figure 1 show that pump-probe microscopy differentiates skin phantoms containing eumelanin and pheomelanin.
Figure 1. Melanin spectroscopy and skin phantoms.
Pump-probe melanin spectra averaged over the entire field of view (a); sepia melanin in red, synthetic pheomelanin in green. Images of sepia melanin (b) and synthetic pheomelanin (c) embedded in agarose. Images have been processed using linear decomposition. Small artifacts in Figure 1b arise from residual motion in the agarose, and reflect the high sensitivity of the technique-this motion is not present in the skin samples in later figures. Scale bar = 100 μm.
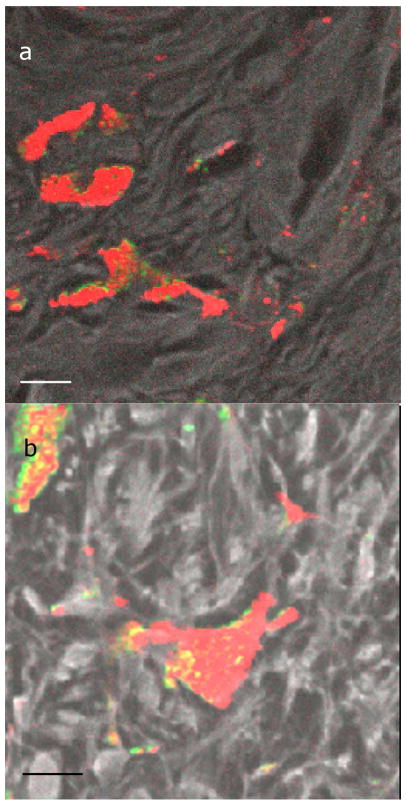
In fixed, thin tissue slices, macrophages were identified by their location in the collagen and by their coarse pigment (Massi and LeBoit, 2004). Figure 2 shows several examples of a macrophage containing melanin. Note that the melanin tends to be homogeneous, with mostly a uniform melanin type and that is spatially not changing rapidly.
Figure 2. Macrophages containing melanin.
Images of macrophages containing melanin in a benign lesion (a) and a malignant melanoma (b). Color bar is the same as in figure 1. The black and white color scale, overlaid with the melanin channel in some cases, is the fluorescence and second harmonic generation channel, which serves as a structural reference for interpreting the images. Scale bar = 10 μm.
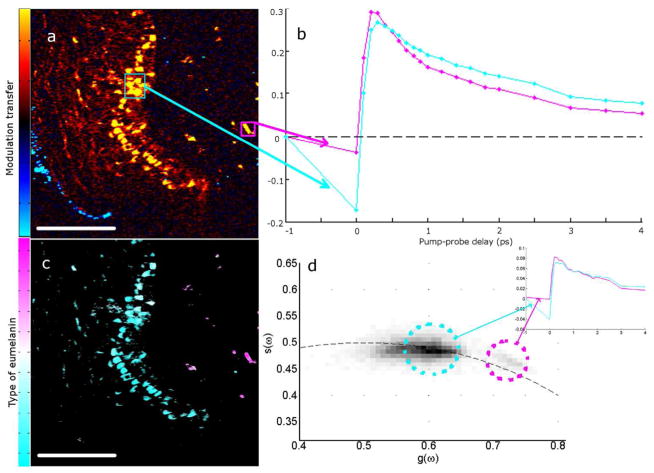
Further, we find that melanin contained in macrophages in the dermis has a slightly different spectrum than epidermal melanin. To demonstrate this we use a convenient method to capture the heterogeneity of pump-probe signatures called phasor analysis (Redford and Clegg, 2005; Robles et al, 2012), which highlights differences in the spectra of individual or ensembles of spatial pixels. This approach was previously used to differentiate components of complex fluorescence lifetime images (Redford and Clegg, 2005) and was recently applied to spectrally separate pump-probe signals of biological and historically significant art pigments (Robles et al, 2012). Phasor analysis also separates the spectra of eumelanin in the epidermis from eumelanin in the macrophages, as shown in figure 3. A thin skin slice is shown, along with the spectra of dermal and epidermal cells. Because they have differentiable spectra, they can be separated with phasor analysis because the pixels for each type of cell have separate locations on the phasor plot.
Figure 3. Melanin in macrophages differentiated from epidermal melanin.
(a) Malignant melanoma imaged at approximately 300fs pump-probe delay. Skin surface is on the left with the surgical ink appearing blue. False color scheme is the sign of the signal, yellow for positive and cyan for negative. (b) Delay traces averaged over two regions of interest in (a) of corresponding colors. (c) Image of (a) recolored using phasor analysis at 0.1 THz. (d) Phasor plot showing all of the pixels from 6 images that contain both epidermal and macrophage melanin. Pixels in (c) are colored magenta or cyan according to which population they fall into (or a combination of the colors if the pixel is in both populations). Inset graph shows the average spectrum of pixels in each population from the 6 images. Scale bar = 100 μm.
A high-magnification image of a single melanocyte in a melanocytic nest is shown in figure 4a, with the melanocytic nest identified by its location near the basal layer and nest-like in shape. This is made visible by the second-harmonic generation/fluorescence channel (shown in gray scale). In the nests, the melanin tends to be spatially disorganized, containing both eumelanin and pheomelanin very close to one another.
Figure 4. Melanin in a melanocytic nest.
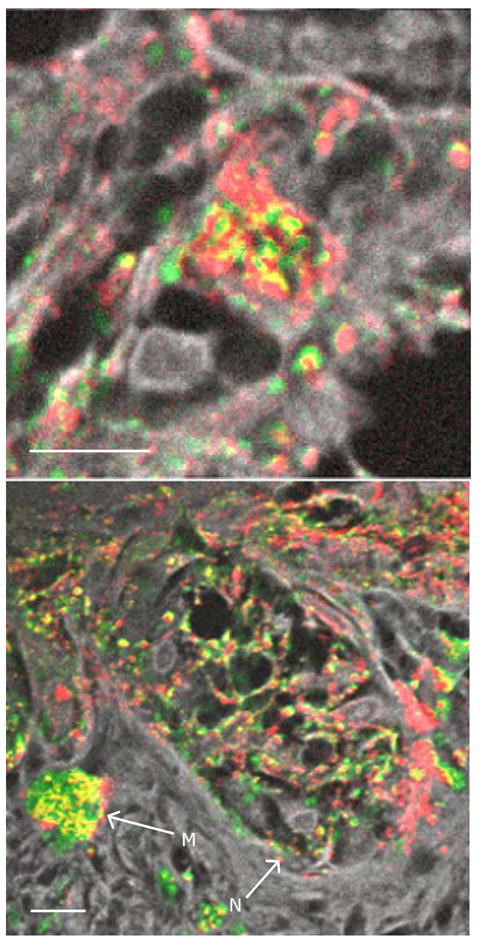
(a) High magnification of a malignant melanocyte in a melanocytic nest; (b) malignant melanocytic nest with arrows marking a macrophage (M) and a melanocytic nest (N). Color scheme is the same as figure 2. Scale bar = 10 μm.
While the majority of macrophages observed in this study contained mostly eumelanin, there were exceptions to this trend. Macrophages in regions of malignancy in melanomas tended to contain more pheomelanin than eumelanin. For example, figure 4b shows a pheomelanic macrophage in a malignant melanoma.
Our sample set also shows supranuclear melanin caps, which serve to protect nuclei from the damaging radiation of the sun (Kobayashi, 1998). Figure 5 shows examples of supranuclear melanin caps, both cross sections of caps (figure 5a) and an en face cap (figure 5b). In particular, a z-stack of an en face cap shows the contour of the cap, which is rendered in three-dimensions in figure 5c. Lastly, keratinocytes were located in different layers of the epidermis. They had both eumelanin and pheomelanin in present in almost every individual cell.
Figure 5. Examples of supranuclear melanin caps.
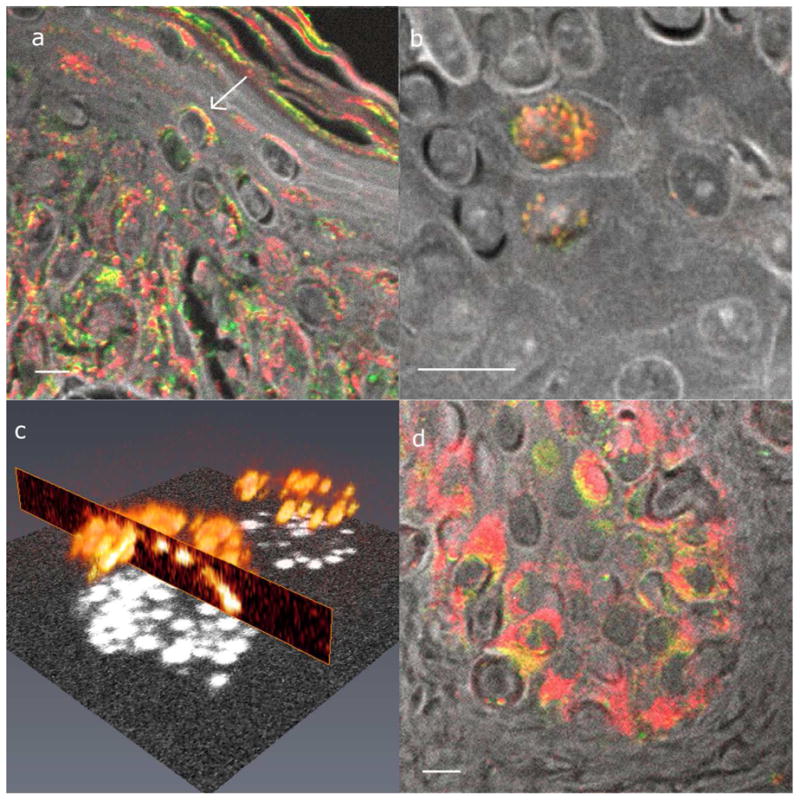
(a) Cross section of melanin caps on suprabasal cells. The arrow points to an example of a supranuclear cap. (b) En face supranuclear melanin cap. (c) Three-dimensional rendering of (b). (d) Cross section of melanin caps on basal cells. Images (a), (b), and (d) all have the same color scheme as figure 3, and the scale bars = 10 μm. (c) A rendering of the total melanin content, shown by the melanin signal at time zero.
Discussion
Most of the macrophages observed in this study appeared to contain eumelanin, even in cases where the epidermal melanin is composed mainly of pheomelanin. This is consistent with previous findings that melanosomes are broken down in phagocytes but melanin is not, and that pheomelanin is likely broken down more readily due to its increased solubility (Borovanský and Elleder, 2003). The exceptions to this finding were pheomelanic macrophages, found only in malignant regions of melanomas. If a melanoma is rapidly forming melanin, then the melanin could be building up in the macrophages and allowing observation of not yet degraded pheomelanin. Additionally, melanin in macrophages tends to lack a negative signal at zero delay, possibly due to thermal effects caused by concentrated melanin absorbing the laser light and dissipating it as heat or due to effects of oxidative degradation. This spectral difference is used to separate populations of melanin in the epidermis and in the macrophages using phasor analysis.
Both eumelanin and pheomelanin can be seen in the single melanocyte (figure 4b), supporting the previous finding that individual melanocytes can exhibit mixed melanogenesis (Jimbow et al, 1983; Ito and Wakamatsu, 2008). Similarly, both types of melanin were observed in single keratinocytes, which is consistent with previous findings using electron microscopy (Jimbow et al, 1983). In keratinocytes, the most efficient approach for the supranuclear caps to protect nuclei would be for the caps to point toward the source of the radiation (the skin surface), but cell signaling is directed from living cells, not the dead stratum corneum. Imaging cells at high magnification shows that melanin caps point perpendicular to the basal layer and not necessarily toward the skin surface (figure 5d). This supports the previous report of melanin caps covering the apical pole of a cell’s nucleus and not necessarily the top of the skin (Corcuff, 2001).
In summary, pump-probe microscopy has allowed the discrimination of eumelanin and pheomelanin non-destructively in individual cells. This method can be applied to answer questions regarding the subcellular distribution of melanins in fixed samples or in vivo and identify different cell types. In this work, it has been used to differentiate melanin in epidermal cells from melanin in macrophages, even when both melanin populations are eumelanin. This could help differentiate macrophages from pigmented dermal melanocytes in stained or unstained biopsy slides or even in vivo. This work also confirms previous findings that single keratinocytes and melanocytes can contain both eumelanin and pheomelanin.
Materials and Methods
The two-color pump-probe microscope used in this study is similar to the previously reported microscope in Ref (Matthews et al, 2011a). In brief, a 720 nm pump beam is modulated at 2 MHz, and a 810 nm probe beam is un-modulated. To characterize a sample’s nonlinear dynamic behavior, images are taken at a variety of interpulse delays including the following: time points with the probe preceding the pump (negative delay) for long lived signals on the order of nanoseconds, points when the pump and probe overlap for instantaneous signals, and points with the pump preceding the probe for measuring the dynamics of the excited state on the order of picoseconds. The light that passes through the sample filters out the pump beam, such that any modulation transferred from the pump beam to the probe beam is detected using a lock-in amplifier. The phase of the modulation is set to have positive signal for an absorptive event and negative for a transmissive event. In addition to the pump-probe system, other microscopy modalities are incorporated: a dichroic filter separates the combined fluorescence and second harmonic generated light that returns through the objective, and is detected using a photomultiplier tube. Most images were acquired using a 60x, 0.9 NA objective and a half milliwatt average power of pump and probe beam.
Melanin imaging standards were prepared by embedding separately sepia melanin (Sigma-Aldrich, Saint Louis, MI, USA) and in-house prepared synthetic pheomelanin (Ito, 1989) in 1% agarose. This preparation was molded into blocks and sliced to about 1 mm thickness, then mounted on a slide and cover-slipped. Unstained 5 μm slices of formalin-fixed, paraffin-embedded skin biopsies from pigmented lesions were obtained through an institutional review board-exempted protocol. Corresponding neighboring slices were H&E stained to allow identification of structural and cytological features. A dermatopathologist identified the clinically concerning regions of melanoma samples to ensure the fields of view included in the study were properly categorized.
For processing of the data, every pixel of each image was fit to spectra from melanin standards and then recolored to represent the fractional content of eumelanin (red) and pheomelanin (green), determined by the coefficients required for the fitting. The color intensity reflects the relative amounts of each melanin present. The precision of the melanin fraction calculation depends on the exact concentration of the melanin solutions used to calculate the coefficients, which is approximate because eumelanin is insoluble in water.
Acknowledgments
We gratefully acknowledge NIH grant number R01-CA166555.
Footnotes
The authors state no conflict of interest.
References
- Biesemeier A, Schraermeyer U, Eibl O. Quantitative chemical analysis of ocular melanosomes in stained and non-stained tissues. Micron. 2011;42(5):461–470. doi: 10.1016/j.micron.2011.01.004. [DOI] [PubMed] [Google Scholar]
- Borovanský J, Elleder M. Melanosome Degradation: Fact or Fiction. Pigment Cell Research. 2003;16(3):280–286. doi: 10.1034/j.1600-0749.2003.00040.x. [DOI] [PubMed] [Google Scholar]
- Cancer Facts and Figures. Atlanta: American Cancer Society; 2010. [Google Scholar]
- Clark WH, From L, Bernardino EA, et al. The Histogenesis and Biologic Behavior of Primary Human Malignant Melanomas of the Skin. Cancer Research. 1969;29(3):705–727. [PubMed] [Google Scholar]
- Corcuff P, Chaussepied C, Madry G, et al. Skin optics revisited by in vivo confocal microscopy: Melanin and sun exposure. Journal of Cosmetic Science. 2001;52:12. [PubMed] [Google Scholar]
- Fu D, Ye T, Matthews TE, et al. Two-color, two-photon, and excited-state absorption microscopy. Journal of Biomedical Optics. 2007;12(5):054004. doi: 10.1117/1.2780173. [DOI] [PubMed] [Google Scholar]
- Glusac EJ. The melanoma ‘epidemic’, a dermatopathologist’s perspective. Journal of Cutaneous Pathology. 2011;38(3):264–267. doi: 10.1111/j.1600-0560.2010.01660.x. [DOI] [PubMed] [Google Scholar]
- Herlyn M, Shih IM. Interactions of Melanocytes and Melanoma Cells With the Microenvironment. Pigment Cell Research. 1994;7(2):81–88. doi: 10.1111/j.1600-0749.1994.tb00025.x. [DOI] [PubMed] [Google Scholar]
- Ito S. Optimization of Conditions for Preparing Synthetic Pheomelanin. Pigment Cell Research. 1989;2(1):53–56. doi: 10.1111/j.1600-0749.1989.tb00158.x. [DOI] [PubMed] [Google Scholar]
- Ito S, Wakamatsu K. Chemistry of Mixed Melanogenesis—Pivotal Roles of Dopaquinone. Photochemistry and Photobiology. 2008;84(3):582–592. doi: 10.1111/j.1751-1097.2007.00238.x. [DOI] [PubMed] [Google Scholar]
- Jimbow K, Ishida O, Ito S, et al. Combined Chemical and Electron Microscopic Studies of Pheomelanosomes in Human Red Hair. J Investig Dermatol. 1983;81(6):506–511. doi: 10.1111/1523-1747.ep12522838. [DOI] [PubMed] [Google Scholar]
- Kalady MF, White RR, Johnson JL, et al. Thin Melanomas: Predictive Lethal Characteristics From a 30-Year Clinical Experience. Ann Surg. 2003;238(4):528–537. doi: 10.1097/01.sla.0000090446.63327.40. [DOI] [PMC free article] [PubMed] [Google Scholar]
- Kobayashi N, Nakagawa A, Muramatsu T, et al. Supranuclear Melanin Caps Reduce Ultraviolet Induced DNA Photoproducts in Human Epidermis. J Invest Dermatol. 1998;110(5):806–810. doi: 10.1046/j.1523-1747.1998.00178.x. [DOI] [PubMed] [Google Scholar]
- Lazova R, Pawelek JM. Why do melanomas get so dark? Experimental Dermatology. 2009;18(11):934–938. doi: 10.1111/j.1600-0625.2009.00933.x. [DOI] [PubMed] [Google Scholar]
- Marchesini R, Bono A, Carrara M. In vivo characterization of melanin in melanocytic lesions: spectroscopic study on 1671 pigmented skin lesions. Journal of Biomedical Optics. 2009;14(1):014027. doi: 10.1117/1.3080140. [DOI] [PubMed] [Google Scholar]
- Massi G, LeBoit PE. Histological diagnosis of nevi and melanoma. Springer; New York: 2004. p. 626. [Google Scholar]
- Matthews TE, Piletic IR, Selim MA, et al. Pump-Probe Imaging Differentiates Melanoma from Melanocytic Nevi. Science Translational Medicine. 2011;3(71):71ra15. doi: 10.1126/scitranslmed.3001604. [DOI] [PMC free article] [PubMed] [Google Scholar]
- Matthews TE, Wilson JW, Degan S, et al. In vivo and ex vivo epi-mode pump-probe imaging of melanin and microvasculature. Biomed Opt Express. 2011;2(6):1576–1583. doi: 10.1364/BOE.2.001576. [DOI] [PMC free article] [PubMed] [Google Scholar]
- Redford G, Clegg R. Polar Plot Representation for Frequency-Domain Analysis of Fluorescence Lifetimes. Journal of Fluorescence. 2005;15(5):805–815. doi: 10.1007/s10895-005-2990-8. [DOI] [PubMed] [Google Scholar]
- Robles FE, Wilson JW, Fischer MC, et al. Phasor analysis for nonlinear pump-probe microscopy. Opt Express. 2012;20(15):17082–17092. [Google Scholar]
- Sealy RC, Hyde JS, Felix CC, et al. Eumelanins and pheomelanins: characterization by electron spin resonance spectroscopy. Science. 1982;217(4559):545–547. doi: 10.1126/science.6283638. [DOI] [PubMed] [Google Scholar]
- Swerlick RA, Chen S. The melanoma epidemic. Is increased surveillance the solution or the problem? Arch Dermatol. 1996;132(8):881–884. doi: 10.1001/archderm.132.8.881. [DOI] [PubMed] [Google Scholar]
- Vinther J, Briggs DEG, Prum RO, et al. The colour of fossil feathers. Biology Letters. 2008;4(5):522–525. doi: 10.1098/rsbl.2008.0302. [DOI] [PMC free article] [PubMed] [Google Scholar]


