

Abstract
Depth-dependent fluorescence quenching is an important tool for studying the penetration of proteins and peptides into lipid bilayers. Extracting quantitative information from quenching data is, however, complicated by (1) a limited number of experimentally available quenchers and (2) by thermal disorder resulting in broad distributions of the transverse positions of both quenchers and fluorophores. Here we validate and refine a general approach to determining the location of a fluorescent probe along the bilayer normal from quenching data, based on a molecular dynamics (MD) simulation of a model compound, tryptophan octyl ester (TOE), in a 1-palmitoyl-2-oleoyl-sn-glycero-3-phosphocholine (POPC) bilayer. The TOE ring was found to lie deeply within the bilayer (most probable position of 13.3 Å and center-of-weight of the distribution of 14.8 Å from the bilayer center) and it was very broadly distributed (with 9 Å depth distribution width), which is consistent with previous experimental observations. The depth-dependent quenching profiles were simulated by treating carbon atoms of the lipid acyl chain of POPC as “pseudo-quenchers” and calculating appropriate transverse overlaps and collision rates with indole atoms of TOE. These simulated quenching profiles were well fitted by a Gaussian function of depth, as is routinely done with experimental data subjected to the Distribution Analysis procedure (Methods Enzymol. 1997, 278, 462–473). Comparison of the collisional pseudo-quenching profiles with the actual profiles of the indole moiety of TOE allows tests of the validity of the data analysis and identification of the possible sources of error in calculating depths of membrane penetration from quenching data.
Keywords: fluorescence quenching, depth-dependent quenching, distribution analysis, molecular dynamics simulations, lipid bilayer
INTRODUCTION
Depth-dependent fluorescence quenching allows estimation of the transverse location (along the direction normal to the membrane) of a fluorophore on a membrane protein in the lipid bilayer from a series of measurements with the quenchers attached to acyl chains at different positions along the chains, hence probing a range of depths.1 We have pioneered the Distribution Analysis (DA) methodology of extracting quantitative information on membrane penetration from depth-dependent fluorescence quenching experiments.2,3,4 It is based on the modern view of the structure of the lipid bilayer, which indicates that transverse distributions of lipid and protein moieties, reflecting their thermal motion in the bilayer, can be accurately described by Gaussian functions.5,6 DA provides not only the average position of the fluorophore in the bilayer, but other important structural characteristics as well, such as transverse heterogeneity (via the width of the distribution) and the exposure of the probe to lipids. While DA is now a well established approach used by many researchers,7,8,9,10,11 extracting quantitative information on membrane penetration is complicated by several factors. First, the limited number of experimentally available quenchers restricts the ability to verify important assumptions of the DA, which requires three fitting parameters. Second, the thermal disorder in lipid bilayers results in broad distributions in the transverse positions of both the quenchers and the fluorophores, which further complicates the analysis. Here we report an analysis of a molecular dynamics (MD) simulation that was designed to ascertain the implications of these limitations and to validate the DA methodology.
MD simulations have become well established as a powerful tool for providing atomic-scale insight into the structure and dynamics of membranes that is not available experimentally. Both constrained and unconstrained MD simulations have been successfully applied for studying alignment, localization, dynamics and partitioning free energies of various fluorescent probes in lipid bilayers,12,13,14 including indoles and their derivatives.15,16,17 Brownian dynamics simulations have also been utilized in the context of fluorescence quenching in membranes.18 Here we have applied MD simulations to an indole-containing compound, tryptophan octyl ester (TOE), placed in a 1-palmitoyl-2-oleoyl-sn-glycero-3-phosphocholine (POPC) bilayer. The fluorescence properties of TOE were reported by us previously,7 and they provide a useful reference for analyzing membrane protein fluorescence. In the analysis presented herein, we generate detailed depth-dependent collisional profiles by treating carbon atoms of acyl chain of POPC as pseudo-quenchers of TOE fluorescence, and use them validate and refine the general depth-dependent quenching approach (Scheme 1). We also compare the results of application of DA to those obtained by alternative approaches, specifically, by fitting with a Lorentzian function (LF) or the Parallax Method.19,20
Scheme 1.

Flow chart illustrating differences in experimental and MD approaches for validating depth-dependent quenching methodology. Because MD operates with vastly superior number of potential quenchers of known depth and because the target distribution of the fluorophore is also explicitly known, the MD-based validation of data analysis is preferable to experiment-based validation. Once the methodology is refined, it will be applied to analysis of experimental systems.
METHODS
Molecular Dynamics Simulation Setup
A bilayer composed of 288 POPC (1-palmitoyl-2-oleoyl-sn-glycero-3-phosphocholine) lipids was pre-equilibrated using an MD simulation in the NPT ensemble. A total of 8 L-Tryptophan Octyl Ester (TOE) molecules (4 in each bilayer leaflet) were placed into the vacancies left by the removal of 8 lipids from the bilayer. The molecular structure and atom labeling of TOE and POPC are shown in Scheme 2. Each TOE molecule was placed in the bilayer so that the nitrogen atom in the indole ring was in a region of the average position of the POPC headgroup phosphate along the bilayer normal. The L-Tryptophan and octyl ester moieties of TOE were constructed in accordance with the canonical bond distances and angles specified in the CHARMM2221 and CHARMM2722 topology files. The final POPC-TOE system consisted of 280 POPC lipid molecules (140 in each bilayer leaflet), 8 TOE molecules (4 in each leaflet), and 7,296 TIP323 water molecules. The initial MD simulation cell dimensions were 100 Å × 100 Å × 72 Å.
Scheme 2.
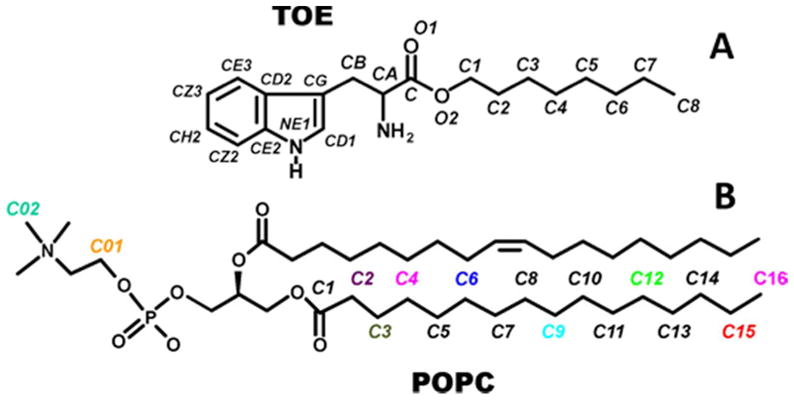
Chemical structure and atom labeling for (A) L-Tryptophan N-Octyl Ester (TOE) and (B) 1-palmitoyl-2-oleoyl-sn-glycero-3-phosphocholine (POPC). For POPC, only the “pseudo-quencher” carbon atoms are labeled and color coded.
The initial POPC-TOE system was subjected to several equilibration steps. First, the 1,000 time steps (1 ps) of conjugate gradient energy minimization were carried out during which all TOE atoms were held fixed. Second, 9,000 time steps (9 ps) of MD simulation at 296 K were performed in the canonical (NVT) ensemble. Following these initial pre-equilibration steps, positional restraints on the TOE atoms were removed, and the system was allowed to equilibrate freely under constant pressure (1 atm) and temperature (296 K) MD simulation for a total duration of 60 ns. The evolution of macroscopic system properties such as the area/lipid and interlamellar spacing were used to monitor the equilibration of the system, and we determined that the system reached equilibrium after ~9 ns of simulation. Therefore, the last 50 ns of MD trajectory were used for the analyses.
All MD simulations were carried out using the NAMD2 molecular dynamics program, version 2.5.24 The CHARMM potential energy function25 was used in conjunction with the all-atom CHARMM2221 and CHARMM2722,26 parameter sets for the TOE and lipid molecules, respectively. Periodic boundary conditions were employed in three dimensions. Electrostatic interactions were evaluated using the smooth particle mesh Ewald (PME) summation method.27 A splitting function with a cutoff distance of 10 Å was used for separation of long- and short-range electrostatic interactions. The van der Waals interactions were smoothly switched to zero within the region 10–11 Å. A nearest neighbor list with a 12.5 Å cutoff distance was used and updated every 8 time steps. The impulse-based Verlet-I/r-RESPA multiple time-stepping integration scheme28,29 was employed with timesteps of 4 fs for the evaluation of long-range electrostatic forces, 2 fs for evaluation of short-range nonbonded forces, and 1 fs for evaluation of bonded forces. Bonds between hydrogens and heavy atoms were held rigid during the simulations; the non-iterative SETTLE algorithm30 was used to keep water molecules rigid. Constant simulation temperature was maintained by means of Langevin dynamics with a 1 ps−1 damping coefficient. A flexible unit cell constrained to orthorhombic symmetry at 1 atm constant pressure was achieved by means of the Nosé-Hoover Langevin Piston method.31,32 All atomic coordinates of the system were recorded every 100 time steps (0.1 ps) for further analysis.
RESULTS AND DISCUSSION
Principles of Distribution Analysis (DA) of Membrane Penetration
The purpose of a depth-dependent fluorescence quenching experiment is to determine the transverse position of a fluorescent probe along the membrane normal, attached to the macromolecule of interest (protein or lipid), within a lipid bilayer.1 Normally one determines the fluorescence intensity (more seldomly the lifetime) of a probe as a function of the depth of the quencher, h, which is assumed to be known. For example, in the case of bromine quenchers, the location of bromine atoms in lipid acyl chains can be determined by x-ray diffraction measurements.33 A series of samples with quenchers at various depths are used and, the stronger the quenching, the closer the probe is to a particular quencher. The DA methodology,2,3,4 suggested for quantitative description of depth-dependent quenching, approximates the transverse quenching profile with a Gaussian function (Equation 1):
| Eq. (1) |
When analyzing deeply penetrating fluorophores, a symmetrical second Gaussian is added to account for trans-leaflet quenching.3 However, this was not necessary for the present study because of the relatively shallow penetration of the indole ring in a TOE molecule. Note, that either single or coupled double Gaussian fits use only three fitting parameters: the center (mean) of the quenching profile (hm), the width of the distribution (σ), and the area under the curve (S). These parameters are linked to the properties of the distribution of the probe in the membrane, such as the most probable depth of penetration, fluctuations in the transverse position, and overall accessibility to quenching (i.e., quenching efficiency). In order to investigate the validity of the DA approach, we used our MD simulation of TOE in POPC bilayer to generate pseudo-quenching profiles, analyze them using DA methodology, and compare the results with the underlying distributions of the probe computed directly from atomic positions sampled in the simulation (Scheme 1).
Distribution of TOE in a Bilayer
To facilitate sampling of possible depth positions and conformations of a probe molecule, we simulated a set of 8 TOE molecules distributed randomly in a lipid bilayer. The simulated system, composed of 8 TOE molecules per 280 lipids, corresponds to a probe/lipid molar ratio equal to 1:35. This concentration of 1.2 molar percent of TOE corresponds to typical concentration ranges used for fluorescence experiments. Figure 1 shows a snapshot of the equilibrated POPC-TOE system.
Figure 1.

Snapshot from an MD simulation of the POPC-TOE system at 296 K. The bilayer normal (z axis) is directed from the bottom to the top of the figure. The hydrophobic part of the lipid bilayer (hydrocarbon lipid tails) is depicted in green; water molecules are cyan. The 8 TOE molecules, shown in vdW space-filling representation, are seen to sample a wide range of conformations as well as transverse depths.
To ensure that the MD sampling produced a converged equilibrium distribution of the probes in a bilayer, the movement of the center-of-mass (COM) of each of the eight TOE indole rings along the bilayer normal z was monitored as a function of simulation time, t. The time evolution of the individual TOE COM transverse positions (measured with respect to the center of the lipid bilayer) is presented in Figure 2. The duration of the simulation was chosen so as to afford an examination of the system dynamics over a timescale that was many times longer than the reported 2.90 ns excited state lifetime of TOE fluorescence in the absence of quenchers.7
Figure 2.

Time evolution of the center-of-mass (COM) transverse depths of the TOE molecules during the MD simulation. The COM depths are plotted for the individual TOE molecules located in the upper and lower leaflets of the bilayer. For tracking purposes, the TOE molecules are numbered from 1 to 8.
Figure 2 shows that, after an equilibration period of 8–10 ns, the COM positions of all TOE molecules become fluctuating around the certain region in a bilayer and no events are observed for which TOE indole moieties crosses from the interfacial region of one leaflet to the interfacial region of another leaflet, or come in contact with each other. Some large-amplitude COM fluctuations could still be observed after 40 ns which indicate that TOE molecules are not kinetically trapped in some local minima and they have enough freedom to sample different regions across a bilayer.
Penetration Depth of TOE Indole
To estimate the average depth of TOE penetration into a POPC bilayer, the time- and molecule-averaged histogram of the transverse position of the heavy (non-hydrogen) atoms of a TOE indole ring was calculated. Fig. 3A shows the depth distribution of TOE in a bilayer, along with the distributions of the major molecular components of a POPC bilayer, such as phosphate and choline groups, glycerol, and carbonyl moieties. Due to the high degree of thermal disorder and structural heterogeneity, the TOE indole ring is broadly distributed along the bilayer normal. The most probable location of the TOE indoles is found to be at 13.3± 0.6 Å (measured from the center of a bilayer), and the FW (full width at half height) of the indole distribution is 9.1 Å. The distribution is somewhat asymmetric and the COW (center-of-weight of the distribution), defined as the follows COW(h)=Σ(Ih·h)/Σ(Ih) equals 14.8 Å.
Figure 3.

(A) Disposition of the major molecular components in the MD unit box estimated at 296 K. Transverse molecular fragment distributions are averaged over all 280 lipids and the heavy atoms of all 8 TOE indole ring (NE1, CD1, CG, CD2, CE2, CE3, CZ2, CZ3 and CH2, see Scheme 2B for more details) for the last 50 ns of the MD trajectory. (B) The transbilayer distribution of the heavy atoms of the TOE indole ring is shown in the context of the distributions of the palmitoyl chain carbon atoms considered as “pseudo-quenchers”. The carbon atom profiles (averaged over all 280 lipids) are given for representative carbon atoms in the palmitoyl chain that are color coded and labeled according to Scheme 2B. For clarity, the amplitude of the TOE indole ring distributions was multiplied by a factor of 25.
The interior of a lipid bilayer is highly heterogeneous and it contains both hydrophobic acyl chains and the initial portion of the polar lipid headgroups, as well as limited water penetration. Thus, our results are consistent with the well-established preference of tryptophan for the interfacial region of the bilayer, demonstrated in numerous experimental and computational studies of tryptophan residues in membrane proteins34,35,36,37 and for various indole derivatives in the bilayers. For example, Yau and co-workers38 used NMR to demonstrate that multiple indole derivatives reside in the vicinity of glycerol group in POPC bilayers. The calculated TOE depth agrees reasonably well with the depth positions of 11–13 Å estimated previously using MD-based calculations of the potential of mean force for an indole moiety of tryptophan analogs in a lipid bilayer.15,16,39 The MD results reported here are also overall consistent with experimental estimates based fluorescence quenching data for TOE.7,20 Although the main thrust of this study, illustrated in Scheme 1, is not a comparison of experimental and simulated position of TOE, we discuss some aspects of such a comparison below in the section Comparison to Experimental Quenching Data.
To evaluate the TOE indole depth as reported by the depths of lipid chain carbon atoms bearing quenching agents (Scheme 2B), under the assumption that the carbon atoms themselves can be considered as “pseudo-quenchers” of TOE fluorescence, distributions of the acyl chain carbons, as well as the mean transverse position (the first moment of the distribution) and standard deviation about the mean (square-root of the second moment of the distribution) of each carbon atom were calculated. The TOE ring in a bilayer is close to the peaks in the distributions of the palmitoyl chain carbon atoms C3–C5, respectively (Figure 3B). The mean transverse positions of the palmitoyl chain carbon atoms as a function of the carbon atom number are plotted in Figure 4. Linear regression analysis yielded the slope of the fitted line, corresponding to the incremental distance per CH2 (methylene) group in the chain as 1.063 Å/CH2, which is in good agreement with the canonical value 0.9 Å/CH2 observed in liquid crystalline phosphatidylcholines.40 For comparison, X-ray diffraction analysis performed on a set of phospholipids (BrPC) brominated at the 6,7-, the 11,12-, or the 15,16-positions of the sn-2 acyl chains found an increment in bilayer thickness of 0.9 Å per CH2 group in 6,7-BrPC and 11,12-BrPC, and an average 1.09 Å/CH2 increment in 15,16-BrPC.33 The MD estimated width of the depth distribution of different palmitoyl chain atoms is 5.3–5.8 Å (Figure 4), and is practically independent of the average depth, consistent with one of the assumptions of the depth calculations using the DA method.2,3,4 In order to increase our coverage of shallow depths we have included in our analysis two carbon atoms from the headgroup, C01 and C02 (Scheme 2B). The widths of their transverse distributions are somewhat wider, 6.6 and 7.2 Å for C01 and C02, respectively (Figure 3B). The combined use of acyl chain-attached and head-group attached quenchers is common in experimental measurements.20
Figure 4.

Plot of the mean transverse positions (green) and full width of distribution (blue) of palmitoyl chain carbon atoms vs. carbon atom number. The solid line is the best linear fit on the mean transverse position data.
Depth Overlap between TOE and Pseudo-Quenchers
We tested the application of the DA methodology for quenching analysis using a simplified approach, based on the overlap of transverse distributions of the fluorophore and the carbon atom pseudo-quenchers. If the carbon atom pseudo-quenchers are assumed to “quench” the TOE fluorescence depending on their relative depths in the bilayer, the depth distribution of the TOE indole ring and the palmitoyl chain carbons can be used for a simple estimate of depth-dependent fluorescence quenching. Consider the distributions of the TOE indoles and the carbon atom pseudo-quenchers along the depth coordinate z (the direction normal to the plane of the lipid bilayer). The most efficient quenching will occur when a fluorophore and a quencher are located both at the same depth in a bilayer. To simplify the analysis, we assume that the probability of TOE being quenched by a particular quencher depends only on the overlap of their transverse distributions (Fig. 5A). For determination of quantitative parameters for depth-dependent fluorescence quenching, we integrate each overlap function and plot the results against the average depth of the pseudo-quencher (Figure 5B).
Figure 5.
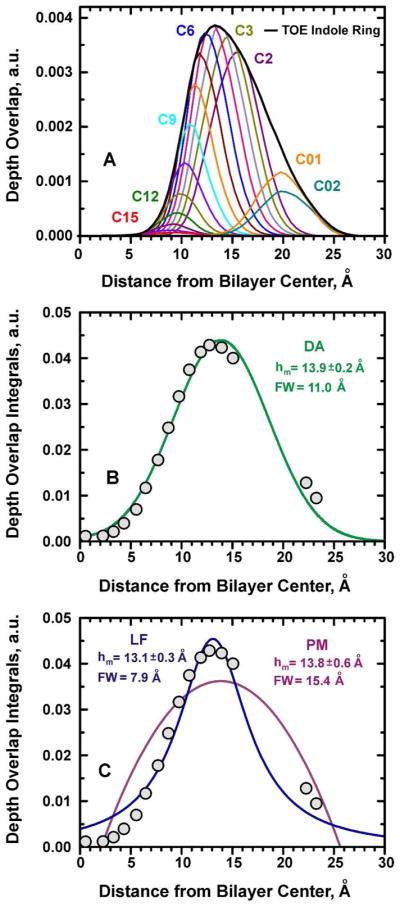
Comparison of the different methods of data analysis using MD-simulated pseudo quenching data. (A) Depth-overlap probability function calculated between a TOE indole fluorophore and each lipid chain carbon “pseudo quencher” atom. For the overlap calculations, all palmitoyl chain carbon atoms and two headgroup carbons C01 and C02 were used (see Scheme 2B for POPC atom numbering). For comparison, the depth probability of the TOE indole ring is also superimposed. (B) Plot of the overlap integral calculated for the overlap probabilities shown in Panel A. The integrals are shown as circles and the solid line represent DA’s Gaussian fit with Equation 1. (C) Same overlap data as in panel B are fitted with Equations 2 and 3, for LF and PM, respectively. The DA fit provides best representation of the pseudo quenching profile.
To validate the analytical expression for the quenching profile assumed by the DA method, the overlap integrals plotted in Figure 5B were fitted to the three-parameter Gaussian function (the analytical expression used in the DA method, Eq. 1). Despite the fact that the underlying indole distribution is clearly asymmetric, the Gaussian quenching profile of DA rather accurately describes the most probable depth of the fluorophore. While fitting with a more complicated, asymmetric function would result in an even more accurate description of the details of the transverse distribution of the fluorophore, its practical application for experimental data analysis would be limited by the small number of available quenchers.
Comparing Different Methods: DA vs PM vs LF
We compare the quality of fit of the simulated depth-dependent quenching profiles achieved by various methods. First, we examine the fit with Lorentzian function (LF) (Fig. 5C):
| Eq. (2) |
Next, we fitted the data with the function from which the conventional analytical expressions for the Parallax Method (PM)19,20 are derived as shown in Ref. 3–4:
| Eq. (3) |
where Rc is the quenching radius, and C is the concentration of quenching lipids, which is usually considered known. Here we used C as an independent fitting parameter, which would increase the quality of fit. This equation for PM has the same number of fitting parameters as DA and LF. As shown in Fig. 5C, the fit with Eq. 3 is very poor and the formalism used in PM does not capture the physics of the system (the reasons for this are discussed in previous publications).2,3,4
Despite the substantial differences in the quality of fit produced by the three methods (Figs. 5B, C), the positions of the maximum of the distributions are close to each other. This is not surprising, because each fit is determined by a substantial number of data points, 16. In real experiments the number of experimental points is limited, which will inevitably result in larger errors for the methods with poor fit. This problem will be especially detrimental for PM, where a common practice is to select just two data points and use analytical expression, rather than to do a residue minimization analysis on all of the available data. In contrast to the mean position, the width of the recovered distributions varies a lot depending on the method, with LF producing the narrowest (FW= 7.9 Å), and PM the widest distribution (FW= 15.4 Å). Note, that the width of the quenching profile, FW(QP), is always larger than the width of the underlying distribution of the fluorophore, FW(F). Previously we have suggested that the latter can be estimated if the width of the quencher distribution, FW(Q), is similar for all quenchers using the following equation:2,3,4
| Eq. (4) |
Because of the small variation in the width of distributions of the pseudoquenchers (Figs. 3B and 4) we can use the average value of FW(Q)=5.8 Å to examine which method gives best representation of the width. Using Eq. 4 we obtained the following values for the FW(TOE): 5.4 Å, 14.3 Å, and 9.3 Å for Lorentzian fit, PM and DA, respectively. The latter value, obtained by DA, practically coincides with the actual value of 9.1 Å for the width of the distribution of indole moiety of the TOE (Fig. 5A). This procedure for narrowing the quenching profile, based on the knowledge of the broadening introduced by the quencher, is known as an “Extended DA” procedure2 and is expected to result in more accurate representation of the fluorophore distribution. Indeed, the simulated Gaussian distribution with maximum of 13.9 Å and FW of 9.3 Å gives an excellent overlap with MD-generated indole distribution of TOE (see below). Thus, the Gaussian fit utilized in DA provides the most accurate description of the idealized depth-dependent quenching experiment modeled by MD simulation.
Collision Rate Analysis
Fluorescence quenching with lipid-attached quenchers is a dynamic process that involves collisions between the electronically excited fluorophore and the quenchers that result in the shortening of the fluorescence lifetime.7,41,42 To assess the extent to which depth-dependent quenching profiles are reflected in the collision dynamics, we have utilized the MD trajectories of TOE in a POPC bilayer to calculate the rate of collisions between TOE and the pseudo-quenching atoms of the palmitoyl lipid acyl chain and the choline headgroup. We define a “collision” as the event in which the specified lipid carbon atom comes within specified cutoff distance of any heavy atom (i.e. carbon or nitrogen, but not hydrogen) in the TOE indole ring. A range of collision cutoff distances was considered: 4.0 Å, 4.5 Å, 5.0 Å, and 6.0 Å, respectively. Within the selected cutoff, all collisions were counted and the average number of collisions counted per nanosecond was plotted for each pseudo-quencher carbon atom against its mean transverse position calculated from the MD simulation (Figure 4). Figure 6 shows collision frequency profiles for the POPC-TOE systems calculated for the different cutoff criteria.
Figure 6.

Collision frequency profiles for the POPC-TOE systems calculated with different collision criteria (cutoff radii). The solid line is the best fit of the collision profiles to a Gaussian function, assumed by DA method (for details see text and Table 1).
To recover depth-dependent fluorescence quenching profiles, the collision profiles were fitted to the three-parameter Gaussian function (Eq. 1). The fitted curves are also shown in Figure 6 and the corresponding parameters are collected in Table 1. The fitting results indicate that the collisional profiles are rather robust, and their mean position, hm, changes little with the variation of the cutoff distance. The width of the profiles, σ, increases only slightly with an increase of quenching radius, presumably because the profiles are already sufficiently broadened by thermal fluctuations in positions of both fluorophores and quenchers. As expected, the area under the profile, related to overall quenching efficiency, increases with increased quenching distance. How well do these Gaussian-fitted collisional profiles represent the underlying indole distribution in TOE molecule? The best way to quantitatively compare symmetric and asymmetric distributions is to compare their centers of weight. For the TOE indoles it is equal to 14.8 Å, which is close to the DA results (e.g. 16.0 Å for the collisional profile plotted in Figure 7B). The small discrepancy between the actual and DA values is likely due to the shielding effect of the TOE tail, which is located on average deeper than the indole moiety (Figure 7B), where it interferes with collisions of deeper quenchers.
Table 1.
Fitting parameters for the collision frequency profiles for the POPC-TOE systems shown in Figure 6. The Gaussian function (Eq. (1)) has the following three parameters: mean depth (hm), dispersion (σ), and area (S).
| Cutoffa(Å) | hm (Å) | σ (Å) | S | Baselineb | χ2 |
|---|---|---|---|---|---|
| 4.0 | 16.70±0.08 | 3.81±0.08 | 4830±95 | 205±53 | 0.99617 |
| 4.5 | 16.26±0.05 | 3.91±0.05 | 9711±107 | 459±68 | 0.99875 |
| 5.0 | 16.00±0.05 | 3.89±0.06 | 14370±173 | 808±114 | 0.99853 |
| 6.0 | 15.99±0.05 | 4.27±0.06 | 20531±236 | 1411±126 | 0.99863 |
|
| |||||
| 4.0 | 16.69±0.11 | 4.03±0.09 | 4976±120 | 0 (fixed) | 0.99148 |
| 4.5 | 16.26±0.08 | 4.15±0.08 | 10056±187 | 0 (fixed) | 0.99415 |
| 5.0 | 16.00±0.11 | 4.19±0.09 | 14986±300 | 0 (fixed) | 0.99279 |
| 6.0 | 15.97±0.11 | 4.65±0.09 | 21570±415 | 0 (fixed) | 0.99219 |
the cutoff is defined maximal distance between fluorophore and quencher at which quenching is assumed to occur in a simulation experiment.
baseline refers to a depth-independent constant added to a Gaussian distribution.
Figure 7.

Summary of validation of DA using MD simulations and application to experiment (see text for details). MD-generated distribution (density profiles) of the TOE indole ring (purple), are compared to Distribution Analysis of MD overlap profiles (A), MD collisional profiles (B) and experimental data (C). DA parameters are noted on each panel. (A) An idealized pseudo-quenching simulation based on transverse quencher-fluorophore overlaps (dashed line) demonstrates that DA is capable of not only of accurately estimating the average depth but also the width of the depth distribution (note that the dashed line is not a direct fit of the TOE profile). (B) The quenching collision profile (5.0 Å collision cutoff) for TOE indole ring is denoted by circles, and the red solid line is the best fit of the collision rate to the DA Gaussian function. MD collisional analysis suggests that shielding of the indole ring with TOE acyl chain (green) can affect determination of depth. For TOE, however, this effect is not very large and DA fit (red), with maximum of 16.0 Å, provides a close estimate of the COW of indole distribution (14.8 Å). (C) Squares represent TOE quenching with bromolipids7 and circles represent those with spin-labels,20 scaled by a factor of 1.5 for visual comparison. DA fit of spin label data (solid line) is a sum of two mirror-image distributions (positive distribution is depicted by dotted line) is also consistent with bromolipid data (see text for more).
Comparison with Experimental Quenching Dat
The two sets of TOE quenching data available from the literature are reproduced in Fig. 7C and compared to the MD-generated TOE distribution. Squares are the data of Ladokhin and Holloway7, who used 4 lipids with two bromine atoms attached to each in positions 4–5; 6–7; 9–10 and 11–12. The circles are the rescaled data from Abrams and London20, who used spin labels attached to positions 12 and 5 along the acyl chain to estimate the depth of 13.5 A using PM, and then assigned the depth of the headgroup-attached quencher to match the result. Here we have scaled their data by a factor of 1.5 to enhance the visual comparison with the bromolipid data. Such a scaling does not affect the average depth or width of the distribution recovered by the DA, it only increases the area under the curve related to quenching efficiency and quencher concentration.2,3,4 The DA fit of the spin label quenching data is shown as the solid curve. Because of the large width of the quenching profile the full DA fit which includes a mirror-image component was used2,3,4 (i.e. Quenching Profile = G(h) + G(−h), where G is given by Eq. 1). The individual component G(h) is shown in Fig. 7C as a dotted line and has the following parameters: hm=13.7±0.3 Å; σ=8.1±0.4 Å. The MD-generated TOE distribution fits comfortably inside of the experimental quenching profile, which is expected to be much broader due to distribution of quencher depth and physical sizes of quenchers and indole (note that the plotted TOE distribution is that for the COM of the indole heavy atoms).
Comparison of the experimental quenching data with MD clearly illustrates the challenges of the quenching measurements. First, only a limited number of quenchers is available and there is no bromolipid quencher to probe the shallower side of the TOE distribution. This is the reason why the original fitting of the bromolipid data7 gave a lower estimate for the TOE penetration (11.3 Å). It is clear however, that the actual data are also consistent with the fit centered at 13.7 Å (Fig. 7C). Second, the positions of quenchers are reasonably well known only for bromolipids,33 and only in a protein-free bilayer. Another often overlooked challenge of experimental determination of the depth is the possible variation of the quantum yield of the fluorophore, e.g. due to the water penetration. This will result in a deeper appearance of the quenching profile compared to the molecular distribution of the fluorophore, which is another possible explanation for the TOE depth from the bromolipids-only quenching data being 11.3 Å.7 Taken together, these uncertainties prevent accurate validation of the data analysis using experimental results. Instead, as demonstrated here and outlined in Scheme 1, various methods of analysis can be compared and refined using data simulated with MD (e.g., see Figs. 5B, C and 7A, B).
SUMMARY AND PERSPECTIVE
Dynamic disorder of the lipid bilayer presents a challenge for establishing structure-function relationships in membraneous systems. The resulting structural heterogeneity is especially evident for peripheral membrane proteins, which are not constrained by transmembrane topology and exert their action in the context of intimate interaction with lipids. One way to decipher dynamic interactions of peripheral membrane proteins with lipid bilayers would be to create a concerted approach, combining experimental methods of fluorescence spectroscopy with MD simulation. As a first step toward creating this integrated methodology, here we have applied MD simulations to validate the principles underlying the distribution analysis of experimental depth-dependent fluorescence quenching data.
The DA methodology used in experimental data analysis approximates the transverse quenching profile with a Gaussian function.2,3,4 While the exact mathematical form cannot be tested experimentally due to the limited number of available quenchers, the multitude of experimental data indicate that at least three fitting parameters are needed, and methods that use only two fitting parameters do not provide an adequate description.3,4 Here we used atomistic MD simulations of the indole-containing model compound TOE in a lipid bilayer to demonstrate that a Gaussian description provides a very good representation of the transverse profile of the rates of fluorophore-quencher collisions. First we used an idealized treatment in which quenching is assumed to be proportional to the overlap integral of transverse distributions of fluorophore and quencher. This analysis allowed us to compare various methods of data analysis, such as DA, PM and LF (Fig. 5). DA provides not only an accurate estimate of the average penetration, but also the width of the distribution (Fig. 7A). This “extended DA” procedure assumes that the width of the quencher distributions does not vary significantly with quencher depth, as seems to be the case in our simulation (Fig. 4). (A case of substantially different distributions is possible, but requires rather complex analysis as demonstrated by Fernandes and coworkers.18) Second, we have increased the complexity of simulated quenching by counting the collisions between atoms of indole ring and carbon pseudo-quenchers (Fig. 6, Table 1). The recovered value of the COW of the distribution estimated by DA from this collisional analysis is only about 1 Å shallower than the actual distribution of the indole moiety in TOE (Fig. 7B). We regard this as a negligible difference given the degree of thermal disorder in the bilayer and the width of the TOE distribution.
Our results also pointed to the likely source of this small variation, namely the shielding of deeper quenchers by the acyl tail of TOE. This suggests that, in more complex and biologically relevant systems, one can expect the shielding effects to be even more prominent. Another possible source of discrepancy between the results of quenching analysis of real experimental data using DA and the underlying distributions of the probe are the variation in the depth of quenchers close to the probe (e.g., due to protein-induced changes in lipid packing). It is expected that these lipid perturbations will be more prominent for proteins that do not penetrate deeply beyond the membrane-water interfacial region (e.g., the interfacially located melittin43). The penetration of water could constitute yet another possible source of error in the experimental determination of depth, as it will tend to quench fluorescence in a somewhat depth-dependent manner. Although these latter potential sources of errors were not specifically addressed in this study, the information needed for appropriate corrections (e.g., lipid perturbation and water penetration in the vicinity of the probe) is readily available from MD simulations. The validation of the Distribution Analysis approach presented here opens up new and exciting possibilities of using depth-dependent fluorescence quenching data as restraints in MD simulations to generate ensembles of structures that are compatible with the experimental data, by following an approach similar to one developed previously for density-based restraints from membrane lamella diffraction data.43
Acknowledgments
This research was supported by National Institutes of Health grants GM-069783 to ASL and GM-86685 to DJT.
ABBREVIATIONS USED
- TOE
Tryptophan Octyl Ester
- POPC
1-palmitoyl-2-oleoyl-sn-glycero-3-phosphocholine
- MD simulation
molecular dynamics simulation
- DA
Distribution Analysis
- PM
Parallax Method, LF, Lorentzian Function
- COM
Center-of-mass of the molecule with multiple atoms (e.g., indole in TOE)
- COW
Center-of-weight of the depth distriburion
- FW
full width at half height
- FW(F), FW(Q) and FW(QP)
FWs for transverse distributions of fluorophore, quencher and depth-dependent quenching profile, respectively
- Cutoff distance
maximal distance between fluorophore and quencher at which quenching is assumed to occur in a simulation experiment
References
- 1.London E, Ladokhin AS. Current Topics in Membranes. 2002;52:89–115. [Google Scholar]
- 2.Ladokhin AS. Distribution analysis of depth-dependent fluorescence quenching in membranes: A practical guide. In: Ludwig Brand MLJ, editor. Methods in Enzymology. Vol. 278. Academic Press; 1997. pp. 462–473. [DOI] [PubMed] [Google Scholar]
- 3.Ladokhin AS. Biophys J. 1999;76:946–955. doi: 10.1016/S0006-3495(99)77258-9. [DOI] [PMC free article] [PubMed] [Google Scholar]
- 4.Ladokhin AS. Analytical Biochemistry. 1999;276(2):65–71. doi: 10.1006/abio.1999.4343. [DOI] [PubMed] [Google Scholar]
- 5.Wiener MC, White SH. Biophys J. 1992;61(2):434–447. doi: 10.1016/S0006-3495(92)81849-0. [DOI] [PMC free article] [PubMed] [Google Scholar]
- 6.White SH, Wiener MC. Determination of the structure of fluid lipid bilayer membranes. In: Disalvo EA, Simon SA, editors. Permeability and Stability of Lipid Bilayers. CRC Press; Boca Raton: 1995. pp. 1–19. [Google Scholar]
- 7.Ladokhin AS, Holloway PW. Biophys J. 1995;69(2):506–517. doi: 10.1016/S0006-3495(95)79924-6. [DOI] [PMC free article] [PubMed] [Google Scholar]
- 8.Breukink E, van Kraaij C, van Dalen A, Demel RA, Siezen RJ, de Kruijff B, Kuipers OP. Biochemistry. 1998;37(22):8153–8162. doi: 10.1021/bi972797l. [DOI] [PubMed] [Google Scholar]
- 9.Kleinschmidt JH, Tamm LK. Biochemistry. 1999;38(16):4996–5005. doi: 10.1021/bi9824644. [DOI] [PubMed] [Google Scholar]
- 10.van Heusden HE, de Kruijff B, Breukink E. Biochemistry. 2002;41(40):12171–12178. doi: 10.1021/bi026090x. [DOI] [PubMed] [Google Scholar]
- 11.Phillips LR, Milescu M, Li-Smerin Y, Mindell JA, Kim JI, Swartz KJ. Nature. 2005;436(7052):857–60. doi: 10.1038/nature03873. [DOI] [PubMed] [Google Scholar]
- 12.Loura LMS, Prates Ramalho JP. Molecules. 2011;16:5437–5452. doi: 10.3390/molecules16075437. [DOI] [PMC free article] [PubMed] [Google Scholar]
- 13.Skaug MJ, Longo ML, Faller R. The Journal of Physical Chemistry B. 2009;113(25):8758–8766. doi: 10.1021/jp902877y. [DOI] [PubMed] [Google Scholar]
- 14.Kyrychenko A. Chemical Physics Letters. 2010;485(1–3):95–99. doi: 10.1016/j.cplett.2009.12.013. [DOI] [PMC free article] [PubMed] [Google Scholar]
- 15.Grossfield A, Woolf TB. Langmuir. 2002;18(1):198–210. [Google Scholar]
- 16.Norman KE, Nymeyer H. Biophys J. 2006;91(6):2046–2054. doi: 10.1529/biophysj.105.080275. [DOI] [PMC free article] [PubMed] [Google Scholar]
- 17.Kyrychenko A, Wu F, Thummel RP, Waluk J, Ladokhin AS. The Journal of Physical Chemistry B. 2010;114(42):13574–13584. doi: 10.1021/jp106981c. [DOI] [PMC free article] [PubMed] [Google Scholar]
- 18.Fernandes MX, García de la Torre J, Castanho MARB. Analytical Biochemistry. 2002;307(1):1–12. doi: 10.1016/s0003-2697(02)00024-6. [DOI] [PubMed] [Google Scholar]
- 19.Chattopadhyay A, London E. Biochemistry. 1987;26(1):39–45. doi: 10.1021/bi00375a006. [DOI] [PubMed] [Google Scholar]
- 20.Abrams FS, London E. Biochemistry. 1993;32(40):10826–10831. doi: 10.1021/bi00091a038. [DOI] [PubMed] [Google Scholar]
- 21.MacKerell AD, Bashford D, Bellott, Dunbrack RL, Evanseck JD, Field MJ, Fischer S, Gao J, Guo H, Ha S, Joseph-McCarthy D, Kuchnir L, Kuczera K, Lau FTK, Mattos C, Michnick S, Ngo T, Nguyen DT, Prodhom B, Reiher WE, Roux B, Schlenkrich M, Smith JC, Stote R, Straub J, Watanabe M, Wiórkiewicz-Kuczera J, Yin D, Karplus M. The Journal of Physical Chemistry B. 1998;102(18):3586–3616. doi: 10.1021/jp973084f. [DOI] [PubMed] [Google Scholar]
- 22.Feller SE, MacKerell AD. The Journal of Physical Chemistry B. 2000;104(31):7510–7515. [Google Scholar]
- 23.Jorgensen WL, Chandrasekhar J, Madura JD, Impey RW, Klein ML. Journal of Chemical Physics. 1983;79(2):926–935. [Google Scholar]
- 24.Kalé L, Skeel R, Bhandarkar M, Brunner R, Gursoy A, Krawetz N, Phillips J, Shinozaki A, Varadarajan K, Schulten K. Journal of Computational Physics. 1999;151(1):283–312. [Google Scholar]
- 25.Brooks BR, Bruccoleri RE, Olafson BD, States DJ, Swaminathan S, Karplus M. Journal of Computational Chemistry. 1983;4(2):187–217. [Google Scholar]
- 26.Feller SE, Yin D, Pastor RW, MacKerell AD., Jr Biophys J. 1997;73(5):2269–2279. doi: 10.1016/S0006-3495(97)78259-6. [DOI] [PMC free article] [PubMed] [Google Scholar]
- 27.Essmann U, Perera L, Berkowitz ML, Darden T, Lee H, Pedersen LG. Journal of Chemical Physics. 1995;103(19):8577–8593. [Google Scholar]
- 28.Tuckerman M, Berne BJ, Martyna GJ. Journal of Chemical Physics. 1992;97(3):1990–2001. [Google Scholar]
- 29.Grubmüller H, Heller H, Windemuth A, Schulten K. Molecular Simulation. 1991;6(1–3):121–142. [Google Scholar]
- 30.Miyamoto S, Kollman PA. Journal of Computational Chemistry. 1992;13(8):952–962. [Google Scholar]
- 31.Feller SE, Zhang Y, Pastor RW, Brooks BR. Journal of Chemical Physics. 1995;103(11):4613–4621. [Google Scholar]
- 32.Martyna GJ, Tobias DJ, Klein ML. Journal of Chemical Physics. 1994;101(5):4177–4189. [Google Scholar]
- 33.McIntosh TO, Holloway PW. Biochemistry. 1987;26(6):1783–1788. doi: 10.1021/bi00380a042. [DOI] [PubMed] [Google Scholar]
- 34.Landolt-Marticorena C, Williams KA, Deber CM, Reithmeier RAF. Journal of Molecular Biology. 1993;229(3):602–608. doi: 10.1006/jmbi.1993.1066. [DOI] [PubMed] [Google Scholar]
- 35.Heijne GV. Annual Review of Biophysics and Biomolecular Structure. 1994;23(1):167–192. doi: 10.1146/annurev.bb.23.060194.001123. [DOI] [PubMed] [Google Scholar]
- 36.Reithmeier RAF. Current Opinion in Structural Biology. 1995;5(4):491–500. doi: 10.1016/0959-440x(95)80034-4. [DOI] [PubMed] [Google Scholar]
- 37.White SH, Wimley WC. Annual Review of Biophysics and Biomolecular Structure. 1999;28(1):319–365. doi: 10.1146/annurev.biophys.28.1.319. [DOI] [PubMed] [Google Scholar]
- 38.Yau WM, Wimley WC, Gawrisch K, White SH. Biochemistry. 1998;37(42):14713–14718. doi: 10.1021/bi980809c. [DOI] [PubMed] [Google Scholar]
- 39.MacCallum JL, Bennett WFD, Tieleman DP. Biophys J. 2008;94(9):3393–3404. doi: 10.1529/biophysj.107.112805. [DOI] [PMC free article] [PubMed] [Google Scholar]
- 40.Lewis BA, Engelman DM. Journal of Molecular Biology. 1983;166(2):211–217. doi: 10.1016/s0022-2836(83)80007-2. [DOI] [PubMed] [Google Scholar]
- 41.Ladokhin AS, Holloway PW. Ukrainskii biokhimicheskii zhurnal. 1995;67(2):34–40. [PubMed] [Google Scholar]
- 42.Sassaroli M, Ruonala M, Virtanen J, Vauhkonen M, Somerharju P. Biochemistry. 1995;34(27):8843–8851. doi: 10.1021/bi00027a036. [DOI] [PubMed] [Google Scholar]
- 43.Benz RW, Nanda H, Castro-Román F, White SH, Tobias DJ. Biophys J. 2006;91(10):3617–3629. doi: 10.1529/biophysj.106.084483. [DOI] [PMC free article] [PubMed] [Google Scholar]