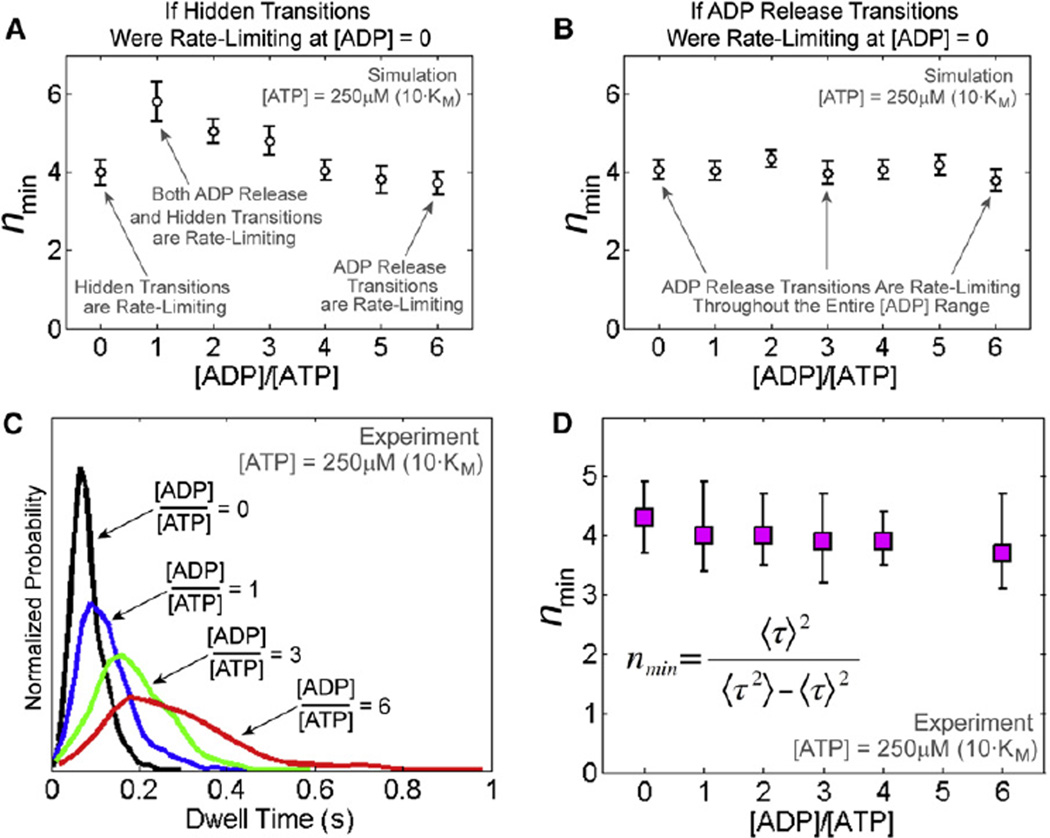
Figure 5. ADP Release Events Are Rate Limiting in the Dwell at Saturating [ATP].
(A) Simulated nmin dependence on [ADP] if four hidden transitions were rate-limiting during the dwell at saturating [ATP] and zero [ADP]. nmin is computed from the dwell time distribution and represents a lower limit for the number of rate-limiting transitions during the dwell. Error bars represent 95% confidence intervals.
(B) Simulated nmin dependence on [ADP] if four ADP release transitions were rate-limiting at saturating [ATP] and zero [ADP]. Error bars represent 95% confidence intervals.
(C) Experimental dwell time distributions at saturating [ATP] (250 µM) and various [ADP].
(D) nmin computed from experimental dwell time distributions at various [ADP]. Error bars represent 95% confidence intervals estimated via bootstrapping.

