

Abstract
Intrinsic connections in the anterior portion of the bed nucleus of the stria terminalis (BNST-A) were studied using patch recordings and ultraviolet (UV) glutamate uncaging (GU) in vitro. UV light was delivered at small BNST-A sites in a grid-like pattern while evoked responses were monitored in different BNST-A regions. Three sectors were distinguished in the BNST-A using fiber bundles readily identifiable in transilluminated slices: the anterior commissure, dividing the BNST-A into dorsal and ventral (BNST-AV) regions, and the intra-BNST component of the stria terminalis, subdividing the dorsal portion into medial (BNST-AM) and lateral (BNST-AL) regions. Overall, GU elicited GABAergic inhibitory postsynaptic potentials (IPSPs) more frequently than excitatory postsynaptic potentials. The incidence of intraregional connections was higher than interregional links. With respect to the latter, asymmetric connections were seen between different parts of the BNST-A. Indeed, while reciprocal connections were found between the BNST-AL and BNST-AM, BNST-AL to BNST-AM connections were more frequent than in the opposite direction. Similarly, while GU in the BNST-AM or BNST-AL often elicited IPSPs in BNST-AV cells, the opposite was rarely seen. Within the BNST-AM, connections were polarized, with dorsal GU sites eliciting IPSPs in more ventrally located cells more frequently than the opposite. This trend was not seen in other regions of the BNST. Consistent with this, most BNST-AM cells had dorsally directed dendrites and ventrally ramified axons, whereas this morphological polarization was not seen in other parts of the BNST-A. Overall, our results reveal a hitherto unsuspected level of asymmetry in the connections within and between different BNST-A regions, implying a degree of interdependence in their activity.
Keywords: bed nucleus of the stria terminalis, glutamate uncaging, fear, anxiety
the bed nucleus of the stria terminalis (BNST) is a poorly understood brain structure that has been implicated in a variety of functions, most relating to negative affects and stress. For instance, the anterior portion of the BNST (BNST-A) has been shown to regulate the hypothalamus-pituitary-adrenal axis (Radley and Sawchenko 2011; Ulrich-Lai and Herman 2009), to mediate stress-induced relapse to drug seeking (Erb and Stewart 1999), and to generate fear/anxiety responses to diffuse environmental cues (Davis et al. 2010) or predator odors (Fendt et al. 2005).
Although its name suggests otherwise, the BNST is a collection of nuclei. While there is disagreement regarding the number and boundaries of BNST nuclei (Andy and Stephan 1964; De Olmos et al. 1985; Ju and Swanson 1989; Moga et al. 1989), it is clear that different BNST regions form contrasting connections. Within the BNST-A, for instance, hypothalamus-pituitary-adrenal-regulating neurons are concentrated in its ventral (BNST-AV) and medial (BNST-AM) portions (Dong et al. 2001b; Dong and Swanson 2006a; Prewitt and Herman 1998). In contrast, neurons in the dorsolateral part of the BNST-A (BNST-AL) contribute most BNST outputs to brain stem structures regulating fear expression (Holstege et al. 1985; Moga et al. 1989; Sofroniew et al. 1983; Sun and Cassell 1993).
Similarly, many afferents to the BNST-A form heterogeneous connections with these different regions. For instance, subicular and medial prefrontal inputs target the BNST-AM and BNST-AV but not the BNST-AL, whereas insular axons show the opposite pattern or termination (for a review, see McDonald et al. 1999). Also, monoaminergic inputs are differentially distributed in the BNST-A (for a review, see Krawczyk et al. 2011). Furthermore, the main source of extrinsic input to the BNST, the amygdala, also contributes contrasting projections to different BNST-A regions (Dong et al. 2001a; Krettek and Price 1978b).
While this heterogeneous connectivity suggests a degree of functional specialization within the BNST-A, a comprehensive series of tracing studies by Swanson and colleagues (Dong and Swanson 2003, 2004, 2006a, 2006b, 2006c) suggested that different BNST-A regions do not act as independent processing channels but that they interact via inter-nuclear connections. For instance, they reported that components of the BNST-AL, particularly, the oval nucleus, strongly projects to parts of the BNST-AV, such as the fusiform nucleus (Dong and Swanson 2004). However, interpretation of these findings is complicated by the fact that the distance between different BNST regions is small relative to the considerable extent of dendritic trees in the BNST (Larriva-Sahd 2006; McDonald 1983). Moreover, this problem is compounded by tracer diffusion from the injection site in the small volume of BNST, particularly along the tract of the pipettes used to inject the tracers.
Another unresolved question relates to the transmitter(s) used by intrinsic BNST axons. Indeed, previous work has revealed that the BNST-A contains GABAergic and glutamatergic neurons (Cullinan et al. 1993; Polston et al. 2004; Poulin et al. 2009; Sun and Cassell 1993), with GABAergic cells accounting for the majority of BNST-A cells and glutamatergic neurons for a minority. Thus, the present study was undertaken to shed light on the organization of intrinsic BNST-A connections using a method that has higher spatial resolution than tract tracing and allows identification of the transmitters involved: glutamate uncaging (GU) coupled to patch recordings in vitro.
MATERIALS AND METHODS
The procedures used in the present study were approved by the Institutional Animal Care and Use Committee of Rutgers University in compliance with the National Institutes of Health Guide for the Care and Use of Laboratory Animals. Our subjects were male Lewis rats (4–5 wk old, Charles River Laboratories, New Field, NJ) maintained on a 12:12-h light-dark cycle. Rats were housed individually with ad libitum access to food and water. Before the experiments, rats were habituated to the animal facility and handling for 1 wk.
Slice Preparation
Rats were anesthetized with ketamine (80 mg/kp ip), pentobarbital (60 mg/kg ip), and xylazine (12 mg/kg ip). After abolition of all reflexes, rats were perfused through the heart with cold (4°C) modified artificial cerebrospinal fluid (aCSF) that contained (in mM) 248 sucrose, 2.5 KCl, 7 MgCl2, 23 NaHCO3, 1.2 NaH2PO4, and 7 glucose. Their brains were then extracted and cut into 400-μm-thick coronal slices with a vibrating microtome while submerged in the same solution as detailed above. After the cutting process, slices were transferred to an incubating chamber, where they were allowed to recover for at least 1 h at room temperature in control aCSF of the following composition (in mM): 124 NaCl, 2.5 KCl, 1.25 NaH2PO4, 26 NaHCO3, 1 MgCl2, 2 CaCl2, and 10 glucose (pH 7.3, 300 mOsm). Slices were then transferred one at a time to a recording chamber perfused with the latter solution (5 ml/min) plus caged glutamate [4-methoxy-7-nitroindolinyl-caged-l-glutamate (1.0 mM), Tocris Bioscience, Bristol, UK]. Before the recordings began, the temperature of the chamber was gradually increased to 32°C.
Electrophysiology
Under visual guidance with differential interference contrast and infrared video microscopy, we obtained whole cell patch recordings of BNST neurons using pipettes (7–10 MΩ) pulled from borosilicate glass capillaries and filled with a solution containing (in mM) 130 K-gluconate, 10 N-2-hydroxyethylpiperazine-N′-2-ethanesulfonic acid, 10 KCl, 2 MgCl2, 2 ATP-Mg, and 0.2 GTP-tris(hydroxy-methyl)aminomethane (pH 7.2, 280 mOsm). Biocytin (0.5%) was often added to the intracellular solution to label the recorded cells. The liquid junction potential was 10 mV with this solution, and the membrane potential was corrected accordingly. Current-clamp recordings were obtained with an Axoclamp 2B amplifier and digitized at 10 kHz with a Digidata 1200 interface (Axon Instruments, Foster City, CA).
To characterize the electroresponsive properties of recorded cells, a graded series of depolarizing and hyperpolarizing current pulses (20-pA steps, 500 ms in duration) was applied from rest and other prepulse potentials. The input resistance of the cells was estimated in the linear portion of current-voltage plots.
GU
To study the intrinsic connectivity of the BNST-A, we used ultraviolet (UV) GU at various sites with respect to the recorded cells. UV light pulses (50 ms) were delivered at 0.1 Hz by a light-emitting diode (LED) source (365 nm, 60 mW, CoolLED, Andover, UK) via a ×60 immersion objective, yielding UV light spots of ≈150 μm in diameter. The microscope rested on a computer-controlled motorized stage, allowing us to move the light spot in a grid-like pattern (50- or 110-μm steps) with respect to the recorded cell (Fig. 1A). At least three UV light pulses were applied at each site while the cells were kept at −90 mV with direct current injection. If a synaptic response was observed, the prestimulus membrane potential of recorded cells was sequentially set to two additional values (−80 and −65 mV), each for at least three light stimuli, and more when response latencies were variable. With this approach, ≈60 min was required to scan the entire BNST-A region in search of sites where UV light application elicited responses in a given postsynaptic cell. Postsynaptic potentials (PSPs) of ≤0.2 mV from a membrane potential of −90 mV were excluded.
Fig. 1.
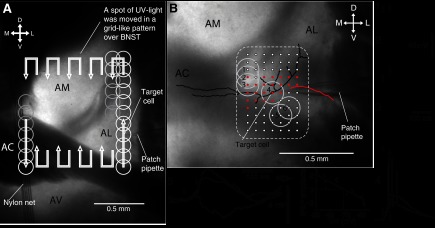
Approach used to study intrinsic connections of the bed nucleus of the stria terminalis (BNST). A: glutamate uncaging (GU) was used to study the intrinsic connectivity of the anterior portion of the BNST (BNST-A). Patch recordings of BNST-A cells were obtained under visual guidance. Pulses (50 ms) of ultraviolet (UV) light were delivered (0.1 Hz) at sites of 150 μm in diameter (white circles), uncaging glutamate at the stimulation site. The site of UV light stimulation was systematically moved over the entire BNST-A in a grid-like pattern. Multiple light pulses were applied at each site and from different membrane potentials. Three sectors were distinguished in the BNST-A using fiber bundles readily identifiable in transilluminated slices: the anterior commissure (AC), dividing the BNST-A into dorsal and ventral (BNST-AV) regions, and the intra-BNST component of the stria terminalis, subdividing the dorsal portion into medial (BNST-AM) and lateral (BNST-AL) regions. B: spatial selectivity of GU. A patch recording of a BNST-AL neuron was obtained, and the morphology of the cell was revealed with biocytin (black: soma and dendrites; red: axon). UV light was applied over, and in the vicinity of, the recorded cell. The center of the UV light spot was moved in steps of 50 μm. Sites evoking direct suprathreshold responses are shown by red circles; white circles indicate subthreshold responses. No suprathreshold responses could be elicited when the center of the UV light spot was >150 μm from the cell. Examples of direct responses from sites 1–4 are shown in 1–4. GU at sites 5 and 6 elicited GABA-A inhibitory postsynaptic potentials (IPSPs). Responses elicited from site 5 from different membrane potentials are shown in 5.
GU-evoked PSPs could easily be distinguished from spontaneous synaptic events because the latter occurred infrequently and showed no temporal relationship with respect to the light stimulus. Nevertheless, since anterior BNST neurons display spontaneous synaptic events (Dumont et al. 2005, 2008; Gosnell et al. 2011; Guo and Rainnie 2010; Kash et al. 2008) that could be erroneously interpreted as GU-elicited PSPs, the following approach was used to distinguish spontaneous versus GU-evoked PSPs. For each cell, we estimated the average interval between spontaneous PSPs [interspontaneous PSP interval (IsPSPI)] during the prestimulus period. Across all recorded cells, the average was 331 ± 30 ms. We then used the IsPSPI of each cell to determine the duration of a temporal window within which we required PSPs in at least eight of nine trials to consider them as GU elicited. This “detection window” was set to a quarter of the cell's IsPSPI. Within this window, the probability of getting eight or more spontaneous PSPs in nine traces by chance (i.e., the false positive rate) was P = 0.000107 (binomial test). We searched for GU-elicited PSPs in a 300-ms period after the stimulus onset by moving our detection window in nonoverlapping steps. The average number of nonoverlapping detection windows was four, resulting in a false positive probability of 0.000428 per stimulation site. The average number of stimulus sites per cell was 77, resulting in an average false positive probability of P = 0.0329 per cell. Since we recorded a total of 75 cells, the number of stimulus positions with PSPs falsely labeled as GU elicited was equal to (0.0329 × 75 = 2.467). Given that we observed 277 connections, this represents <1% of false positives.
Analyses were performed offline with IGOR (Wavemetrics), Clampfit (Axon Instruments), Stimfit (http://www.stimfit.org/), and custom-written software using Numpy and Scipy (http://www.scipy.org). Values are expressed as means ± SE. Three complementary statistical approaches were used to assess the significance of the results. The first approach consisted of comparing the proportion of cells showing particular response types [e.g., response vs. no response or excitatory PSP (EPSP) vs. inhibitory PSP (IPSP)] with a χ2-test. The second approach compared the proportion of stimulation sites eliciting particular response types across all recorded cells combined with a χ2-test. Third, the results obtained with the latter approach were verified by first computing the proportion of effective stimulation sites for each cell individually, averaging these for different response types, and comparing them with a paired t-test.
Biocytin Revelation for Morphological Identification of Recorded Cells
At the conclusion of the recordings, slices were removed from the chamber and fixed for 1–3 days in 0.1 M PBS (pH 7.4) containing 4% paraformaldehyde. Slices were then embedded in agar (3%) and sectioned on a vibrating microtome at a thickness of 100 μm. Sections were washed several times in phosphate buffer (PB; 0.1 M, pH 7.4) and then transferred to H2O2 solution (0.5%) in PB for 15 min. After numerous washes in PB, sections were incubated for 12 h in a solution containing 0.5% Triton X-100 plus 1% of solutions A and B of an ABC kit (Vector, Burlingame, CA) in PB. The next day, sections were washed in PB (5 × 10 min). Biocytin was visualized by incubating the sections in a 0.1 M PB solution that contained diaminobenzidine tetrahydrochloride (0.05%, Sigma), 2.5 mM nickel ammonium sulfate (Fisher), and H2O2 (0.003%) for 5–10 min. Sections were then washed in PB (5 × 10 min), mounted on gelatin-coated slides, and air dried. Sections were then counterstained with cresyl violet and coverslipped with Permount for later reconstruction.
Nomenclature Used to Designate Different BNST Subregions
Individual BNST subnuclei cannot be identified with precision in unstained, living slices. Therefore, we used a simpler subdivision of the BNST-A in three regions, based on the position of major fiber bundles that can be easily identified in transilluminated slices: the anterior commissure, dividing the BNST-A into dorsal and BNST-AV sectors, and the intra-BNST component of the stria terminalis, subdividing the dorsal portion into BNST-AM and BNST-AL regions. The correspondence between our subdivisions of the BNST-A and the subnuclei identified by Swanson and colleagues (Ju and Swanson 1989; Ju et al., 1989) is as follows: the BNST-AV corresponds to Sawnson's anteroventral, fusiform, parastrial, and dorsomedial subnuclei plus the subcommisural zone; the BNST-AL corresponds to Sawnson's oval, juxtacapsular, and anterolateral subnuclei; and the BNST-AM corresponds to Swanson's anterodorsal subnucleus.
RESULTS
Spatial Specificity of GU to Study Intra-BNST Connectivity
The usefulness of the GU method to study intrinsic BNST connections depends on whether it meets the following two criteria: 1) that the rise in glutamate concentration produced by UV light be high and rapid enough to reliably fire neurons located where the light stimulus is applied and 2) that the decay of glutamate concentration with distance from the UV light stimulus be sufficiently steep such that nearby neurons, not directly exposed to UV light, are not depolarized enough to fire. We first aimed to test whether the GU method met these criteria in the BNST.
To this end, the spot of UV light (150 μm in diameter and 50 ms in duration) was centered over recorded cells (n = 10) and then gradually displaced away from this site in various directions (steps of 50 μm). In these recordings, the pipette solution included biocytin to allow post hoc correlation of morphology and responsiveness to uncaged glutamate. A representative example of such an experiment is shown in Fig. 1B. The solid red and white circles in Fig. 1B mark the sites of UV light application that elicited supra- or subthreshold responses, respectively. Application of UV light over the soma (Fig. 1B,4) and its immediate vicinity always elicited robust spiking. This is a direct response to uncaged glutamate. However, when the center of the UV spot was moved away from the soma, these direct depolarizing responses eventually became subthreshold or vanished. These variations (amplitude reduction vs. disappearance) depended on the exact position of the cells' dendrites with respect to the position of the light spot, with stimuli located ≥150 μm from dendrites never eliciting spiking from rest. For instance, in the case shown in Fig. 1B, GU elicited spiking when the UV light was applied over the soma and proximal dendrites (red circles and Fig. 1B,2–4) but not when the stimulus was applied over more distal dendrites or at sites ≥150 μm from the soma and dendrites. At some of these sites (Fig. 1B,5 and 6), evidence of GABAergic synaptic connections was obtained. Across all the cells tested in this manner, we did not observe a single case where spiking could be elicited from stimulation sites located >200 μm from their somata. Typically, direct responses vanished within 150 μm. Thus, these results suggest that the GU method has sufficient spatial selectivity to study intrinsic BNST connections.
Another important consideration when assessing the usefulness of GU to study intrinsic BNST connections is whether depolarizing PSPs can be distinguished from direct subthreshold responses to uncaged glutamate. Indeed, when UV stimuli are applied near recorded cells, it is possible that the evoked depolarizations are not due to synaptically released transmitter but to uncaged glutamate. Fortunately, these two types of responses could be readily distinguished. Figure 2A, 1 shows three superimposed direct subthreshold responses to uncaged glutamate. As was typically observed when the light stimulus was applied near the recorded cell, this direct response started shortly after the onset of the light pulse, rose gradually for its entire duration, and began decaying shortly after its offset (Fig. 2A,1).
Fig. 2.

Distinguishing responses to uncaged glutamate versus synaptically released transmitters. A,1: direct subthreshold response to uncaged glutamate (three superimposed sweeps) from −90 mV. Note the slow and invariant rising phase. Downward and upward arrows indicate the onset and offset of UV light stimuli, respectively. A,2: case where a direct response and PSPs are triggered from the same stimulation site. Again, note the slow and invariant rising phase of the direct response that contrasts with the fast rising phase, variable latency, and number of evoked PSPs (four superimposed sweeps). B–D: example of direct suprathreshold response to uncaged glutamate and of PSPs in control artificial cerebrospinal fluid (aCSF; black), after the addition of 6-cyano-7-nitroquinoxaline-2,3-dione (CNQX; B and C, gray) or picrotoxin (D, gray). The direct suprathreshold response to uncaged glutamate resisted CNQX (B), whereas indirect glutamatergic responses were abolished (C). As shown in D, picrotoxin blocked IPSPs elicited by GU.
Compared with direct responses, synaptically evoked PSPs had a longer latency (PSPs: 79.0 ± 4.4 ms vs. direct responses: 8.3 ± 0.1 ms), they peaked more rapidly (PSPs: 27.8 ± 1.5 ms vs. direct responses: 74.7 ± 0.4 ms), the onset of their decay phase was not time locked to the offset of the light stimulus, and they sometimes showed conspicuous latency variations. The most direct illustration of the distinction between direct and synaptic responses are cases where both phenomena are elicited by UV light application at the same site. In the example shown in Fig. 2A,2, the responses elicited by multiple consecutive light stimuli are superimposed. All trials started with a direct response to uncaged glutamate that showed no latency variations. Superimposed on the decaying phase of these direct responses were depolarizing PSPs whose exact latencies and number varied from trial to trial. These latency variations, coupled to the differing time course of the two types of responses, leave no doubt as to their distinct origin. Of course, in the case of GABAergic PSPs, the distinction was further facilitated by the fact that IPSPs reversed in polarity when the cells were depolarized (see below and Fig. 1B,5).
It should be noted that latency variations were typically much smaller than those shown in Fig. 2A,2, as will become clear in the results shown in subsequent figures. However, since BNST-A neurons display spontaneous synaptic events (Dumont et al. 2005, 2008; Gosnell et al. 2011; Guo and Rainnie 2010; Kash et al. 2008) that could be erroneously interpreted as GU-elicited PSPs, the following approach was used to distinguish spontaneous versus GU-evoked PSPs. For each target cell independently, we computed the frequency of spontaneous PSPs and only considered PSPs that largely exceeded the chance expected (see details in materials and methods). With the approach we used, the estimated false positive rate was ∼1%.
Distinguishing GABAergic and Glutamatergic PSPs Elicited by Glutamate Uncaging
To identify the transmitters mediating GU-evoked PSPs, we primarily relied on their reversal potentials. That is, PSPs with extrapolated reversal potentials near 0 mV were assumed to be mediated by ionotropic glutamatergic receptors, whereas PSPs with reversal potentials negative to −60 mV were classified as being mediated by GABA-A receptors (Fig. 1B,5). In several cases, we verified these inferences by testing whether presumed glutamatergic or GABAergic PSPs were sensitive to drugs that block non-N-methyl-d-aspartate (NMDA) glutamate receptor [6-cyano-7-nitroquinoxaline-2,3-dione (CNQX; 10 μM); Fig. 2, B and C] or GABA-A [picrotoxin (75 μM); Fig. 2D] responses. In all tested cases (EPSPs: n = 5 and IPSPs: n = 7), the pharmacological experiments confirmed our electrophysiological inference. Here, it should be noted that due to the large rise in glutamate concentration produced by GU, the competitive receptor antagonist (CNQX) application did not block (only delayed) direct suprathreshold responses to uncaged glutamate (Fig. 2B). In contrast, EPSPs elicited by synaptically released glutamate were completely abolished (Fig. 2C). The differential sensitivity of direct versus synaptically mediated glutamatergic responses to CNQX has been previously reported in a study relying on local pressure applications of glutamate (Apergis-Schoute et al. 2007).
Mapping of Intrinsic BNST-A Connections With GU
We studied GU-evoked responses in 75 cells where long-term recording stability (≤10% variations in input resistance and ≤5 mV in resting potential) allowed extensive mapping of their intra-BNST connections with GU. These include 25 BNST-AL, 28 BNST-AM, and 22 BNST-AV neurons. Consistent with earlier reports on the electroresponsive properties of BNST-A neurons (Guo et al. 2009; Hammack et al. 2007; Hazra et al. 2011, 2012), regular spiking and low-threshold bursting neurons accounted for the vast majority of cells in the three regions examined. However, because no differences in the intrinsic connections were seen between physiological cell types [χ2(X, N = 75) = 7.64, P = 0.27], the results obtained in the various cell types were pooled below. In all cells combined, we tested the effects of UV light stimuli at 5,739 sites, usually separated by 110 μm. Overall, 5.1% of the stimulation sites elicited a synaptic response. Typical examples of intrinsic BNST-A connections evidenced with GU are shown for individual BNST-AM neurons in Fig. 3A, BNST-AL neurons in Fig. 3B, and BNST-AV neurons in Fig. 3C. We first provide a qualitative description of these response patterns; quantitative population analyses follow.
Fig. 3.
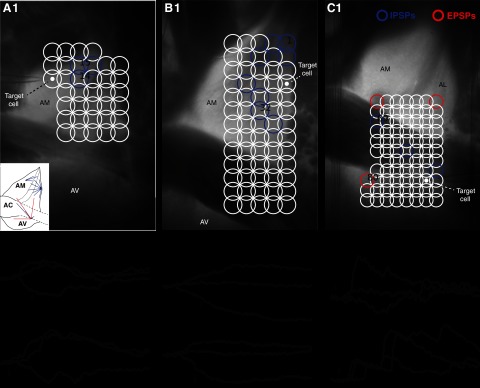
Examples of response patterns observed in BNST-AM (A), BNST-AL (B), and BNST-AV (C) neurons with GU. 1: photomicrographs of transilluminated slices with the positions of recorded cells (target cell, white circles) and UV stimulation sites (open circles). White circles indicate the sites of UV light application that elicited no response. At sites marked by blue circles, UV light elicited IPSPs. At sites marked by red circles, excitatory PSPs (EPSPs) were evoked. Examples of IPSPs (A,2 and 3, B,2 and 3, and C,2) and EPSPs (C,3) are shown. Numbers indicate the prestimulus membrane potentials (in mV) at which responses were observed. Upward arrows indicate the offset of 50-ms UV light stimuli that elicited the responses. The inset in A,1 shows a graphical summary of connections found in the three cells shown in A–C. Blue: inhibitory connections; red: excitatory connections.
In Fig. 3A,1–C,1, the colored circles mark UV stimulation sites that elicited IPSPs (blue), EPSPs (red), or no response (white). As was typically the case, these three cells responded to a minority of stimulation sites. Also representative of the overall response pattern, a majority of PSPs elicited with GU were IPSPs. Examples of evoked IPSPs are shown in Fig. 3, A, 2, B,2, and C,2. Examples of EPSPs are shown in Fig. 3C,3. The rise time and duration of evoked PSPs varied within and between cells. This variability probably reflects a number of factors, such as electrotonic distances between the activated synapse(s) and soma as well as differences in the number of spikes (and instantaneous firing frequency) of presynaptic neurons recruited by GU. Of course, it is also possible that the number of presynaptic neurons varied between stimulation sites.
The inset in Fig. 3A,1 shows a different representation of the results obtained in the same three neurons shown in Fig. 3. The same representation was used to illustrate the responsiveness of 20 additional neurons in Fig. 4. We will refer to the results obtained in these cells later on, when we describe the general trends identified in this study.
Fig. 4.

Plots of intra-BNST connections evidenced with GU in the dorsal (A) and ventral (B) parts of the BNST-AM (BNST-AMd and BNST-AMv, respectively), BNST-AL (C), and BNST-AV (D). Each of the images (A,1–4, B,1–6, C,1–4, and D,1–6) shows a different cell. Note that in dorsally located BNST-AM cells, intrinsic inputs prevalently ran dorsoventrally. This trend was generally not seen in cells recorded in the BNST-AL (B), BNST-AV (D), or ventral part of the BNST-AM (C). While excitatory connections to neurons in the BNST-AL and the dorsal part of the BNST-AM were rare, they were frequently encountered in the BNST-AV and ventrally located BNST-AM cells.
Intrinsic BNST-A Connections: Population Analyses
Consistent with the fact that GABAergic cells represent the main cell type in the BNST-A, most of the intrinsic connections disclosed with GU were inhibitory. Figure 5 shows this in two ways: first by showing a plot of the proportion of cells in which only IPSPs (blue circles), EPSPs (red circles), or both (intersection between the circles) were evoked by GU (Fig. 5A), and second by showing the proportion of stimulation sites that were effective in eliciting EPSPs or IPSPs across all cells (Fig. 5, B and C). With the first approach, the prevalence of inhibitory connections was apparent when we considered all BNST-A cells together [χ2(1, N = 75) = 7.18, P = 0.0074; Fig. 5A,1] or neurons in different parts of the BNST-A separately (Fig. 5A,2–4). However, the differing incidence of inhibitory and excitatory connections was especially marked in the BNST-AL [χ2(1, N = 25) = 4.53, P = 0.033; Fig. 5A,2] and progressively less so in the BNST-AM (P = 0.12; Fig. 5A,3) and BNST-AV (P = 0.6; Fig. 5A,4). This result pattern was confirmed using a different statistical approach where the proportion of effective stimulation sites was first determined for each cell, averaged across cells separately for IPSPs and EPSPs, and then compared with a paired t-test (Fig. 6A). This was used for all BNST-A neurons combined [t(74) = 3.87, P = 0.0002] as well as separately for BNST-AL [t(24) = 2.77, P = 0.011], BNST-AM [t(27) = 2.65, P = 0.013], and BNST-AV neurons [t(21) = 1.29, P = 0.212].
Fig. 5.

Relative incidence of inhibitory and excitatory connections within the BNST-A. A: proportion of cells that responded with glutamatergic (red; E) and/or GABAergic (blue; I) PSPs to GU. Graphs from left to right: all recorded cells irrespective of location, BNST-AL cells, BNST-AM cells, and BNST-AV cells. B and C: proportion of tested stimulation sites eliciting GABAergic (blue) or glutamatergic (red) PSPs when the stimulation and recording sites were in the same (B, intraregional) or different (C, interregional) sectors of the BNST-A.
Fig. 6.

Properties of intrinsic BNST connections. A: proportion of stimulation sites that elicited EPSPs (red) or IPSPs (blue) in BNST neurons. In contrast to the results shown in Fig. 5, the proportion of effective sites was computed for each cell separately and then averaged across cells (values are averages ± SE). B: proportion of effective stimulation sites (EPSPs and IPSPs combined) in intranuclear (black bar) or internuclear connections (open bar). As in A, the proportion of effective sites was computed for each cell separately and then averaged across cells.
The same conclusions emerged from the overall analysis of effective stimulation sites (Fig. 5, B and C). For intraregional connections (Fig. 5B), that is, cases where the stimulation sites and recorded neurons were in the same BNST-A region, a χ2-test revealed a significant dependence between response type (IPSP, EPSP, no response) and BNST region (BNST-AV, BNST-AM, and BNST-AV) [χ2(4, N = 2959) = 9.62, P = 0.047]. Post hoc tests showed that the proportion of stimulation sites eliciting IPSPs was higher in the BNST-AL than BNST-AV [χ2(2, N = 1979) = 7.56, P = 0.023] and that the proportions in the BNST-AM are intermediate and not significantly different from either the BNST-AL (P = 0.07) or BNST-AV (P = 0.23).
For interregional connections (Fig. 5C), namely, instances where the recording and stimulation sites were located in different BNST-A regions, a more complex picture emerged. First, irrespective of the type of response observed (IPSPs or EPSPs), the incidence of effective stimulation sites was much lower than that seen in intraregional connections [intraregional: 7.41% and interregional: 2.63%, χ2(1, N = 5,775) = 84.34, P < 0.0001]. As shown in Fig. 6B, the same conclusion was reached using a different statistical approach, namely, first determining the proportion of effective stimulation sites per cell for intra- versus interregional connections, averaging these values, and then comparing them with a paired t-test [t(74) = 2.93, P = 0.004].
Second, IPSPs did not prevail in all interregional connections. They did in connections from and to BNST-AL neurons (IPSPs: n = 46 and EPSPs: n = 16, binomial test, P < 0.0001), whereas in connections from and to the BNST-AV, the incidence of inhibitory connections could be equal to (BNST-AV to BNST-AM) or even lower than (BNST-AM to BNST-AV) that of excitatory connections. However, because the proportion of effective stimulation sites was low in these interregional connections, the latter difference did not reach statistical significance (binomial test, P = 0.5).
Properties of GU-evoked PSPs (rise time, amplitude, and duration) did not vary depending on the BNST-A region where the target cells were recorded or where the light stimuli were applied. This was true of EPSPs and IPSPs, even with significance levels uncorrected for multiple comparisons. Figure 7 shows the frequency distributions of IPSP and EPSP properties using results obtained in the three BNST-A regions combined. It should be noted that for these analyses, compound PSPs were not included, only well-isolated PSPs (presumed single-axon PSPs) that could be measured unambiguously. However, note that the rise times of compound events, particularly of IPSPs, were markedly slower than those of isolated PSPs.
Fig. 7.

Properties of IPSPs and EPSPs elicited by GU in intra- and inter-regional connections in all recorded neurons combined. A: frequency distributions of IPSP amplitudes (left), rise times (middle), and durations (right). B: frequency distribution of EPSP amplitudes (left), rise times (middle), and durations (right). This analysis only includes connections where individual PSPs could be resolved; compound events were excluded. All measures were performed from a membrane potential of −90 mV. PSP rise times correspond to times to half of peak amplitude.
Heterogeneous Directionality and Polarity of Intrinsic BNST Connections
There were marked differences in the directionality of intraregional connections in different sectors of the BNST-A. In the dorsal but not ventral portions of the BNST-AM, connections had a preferential directionality, with dorsal GU sites eliciting IPSPs in more ventrally located cells far more frequently than stimulation sites located ventrally to the recorded neurons (Fig. 4A). Although a few cells exhibited this phenomenon in other BNST regions (Fig. 4, B,4, C,2, and D,3 and 5), no overall preferential directionality of connections emerged in the BNST-AL (Fig. 4B,1–3 and 5 and 6), BNST-AV (Fig. 4D,1,2,4, and 6), or the ventral part of BNST-AM (Fig. 4C,1,3, and 4).
Another obvious difference between the dorsal (Fig. 4A) and ventral (Fig. 4C) parts of the BNST-AM was the incidence of neurons receiving excitatory inputs. All but one of the BNST-AM neurons in which intrinsic glutamatergic connections were disclosed (12 of 28 cells) were found in the ventral part of the BNST-AM. As in the ventral part of BNST-AM, a high incidence of neurons receiving intrinsic glutamatergic inputs was found in the BNST-AV (12 of 22 cells, or 55%; Fig. 4D), which was significantly higher than in the BNST-AL, where intrinsic glutamatergic inputs were infrequent (7 of 25 cells, or 28%, Fisher's exact test, P = 0.045).
Interregional connections were also asymmetric (Fig. 5C). Indeed, GU in the BNST-AM or BNST-AL elicited PSPs in BNST-AV cells (3.66%) much more frequently than in the opposite direction (1.38%, Fisher's exact test, P = 0.007). In addition, while reciprocal connections were found between the BNST-AL and BNST-AM, BNST-AL to BNST-AM connections were more frequent than in the opposite direction (percent tested stimulated sites: BNST-AM to BNST-AL, 2.78%; BNST-AL to BNST-AM, 3.56%, Fisher's exact test, P = 0.042).
Morphological Correlates
To test whether the contrasting directionality of intrinsic connections observed in different BNST-A sectors was dependent on the morphology of BNST-A neurons, we filled 38 neurons with biocytin (BNST-AM: n = 12, BNST-AL: n = 19, and BNST-AV, n = 7). Representative examples of biocytin-filled neurons are shown in Fig. 8A. After filling, slices were placed in fixative and resectioned at 100 μm, and biocytin was revealed. The morphology of recorded cells was reconstructed by performing drawings of all labeled elements found in the different sections. Based on the matching position of blood vessels and of the cut ends of dendritic and/or axonal segments, the labeling found in the different sections was then aligned. Figure 8B shows examples of such reconstructions.
Fig. 8.

Morphological correlates of intrinsic connectivity. A: photomicrographs showing examples of BNST neurons labeled with biocytin (1, BNST-AV; 2, BNST-AL). B: drawings of eight BNST-A neurons (red, axons; black, somata and dendrites). The neurons labeled 1 in B,1 and 2 in B,2 are the same cells as shown in A,1 and A,2, respectively. Note that because all our recordings were performed in the BNST-A, the rostrocaudal position of recorded cells did not vary much in our experiments (±250 μm).
Consistent with the prevalent dorsoventral connectivity seen in the dorsal portion of the BNST-AM, 11 of 12 cells recovered from the BNST-AM (n = 12) had dendrites that extended more in the dorsal (370 ± 157 μm) than the ventral (205 ± 69 μm) direction (t-test, P = 0.047). Moreover, all cells located in the dorsal portion of the BNST-AM (n = 4) contributed ventrally directed axons (BNST-AM; Fig. 8B,1 and 2). In contrast, cells in other parts of the BNST-A displayed no consistent morphological polarization (BNST-AL and BNST-AV; Fig. 8B,1 and 2). Of note, whereas the dendritic arbors of BNST-AL (n = 19) and BNST-AM (n = 12) neurons were typically confined to the BNST region where their soma was located, BNST-AV neurons often (4 of 7 cells) had dendrites that extended dorsally beyond the anterior commissure and into the BNST-AM or BNST-AL. This suggests that interregional connections targeting BNST-AL or BNST-AM neurons typically depended on axons that extended beyond the BNST sector where the parent soma was located. In contrast, for BNST-AV neurons, this was not necessarily the case.
DISCUSSION
It has been proposed that the BNST and central amygdala are part of an anatomic entity termed the extended amygdala (Alheid and Heimer 1988; deOlmos and Heimer 1999). This concept is based on similarities in neuronal morphology and transmitter content (for a review, see McDonald 2003), common inputs from the basolateral amygdala (Krettek and Prince 1978a, 1978b; Pare et al. 1995; Savender et al. 1995; Dong et al. 2001a), as well as overlapping projections to a network of motor and autonomic brain stem nuclei thought to generate various aspects of fear/anxiety responses (Hopkins and Holstege 1978; Veening et al. 1984; Holstege et al. 1985; Dong et al. 2000; Dong and Swanson 2003, 2004, 2006a, 2006b, 2006c).
In contrast to the amygdala, however, the physiological organization of the BNST is poorly understood. The BNST is composed of several subnuclei with much disagreement regarding their exact number and location (Andy and Stephan 1964; De Olmos et al. 1985; Ju and Swanson 1989; Ju et al. 1989; Moga et al. 1989). However, it is commonly accepted that different BNST regions form contrasting connections with the rest of the brain. This suggests a degree of functional specialization within the BNST, raising the question of whether different BNST regions interact with each other or whether they constitute independent processing modules.
The present study was undertaken to address this question, focusing on the intrinsic connections that exist in the BNST-A. Our study revealed the existence of asymmetric connections within and between different parts of the BNST-A. Because the incidence of inhibitory and excitatory connections varied as a function of the region contributing or receiving these intrinsic connections, our findings raise the possibility that both cooperative and competitive interactions take place within the BNST. Below, we summarize the pattern of intrinsic connections evidenced in the present study and discuss these results in light of earlier findings regarding the anatomy and physiology of the BNST-A.
Nature of the Synaptic Connections Evidenced in the Present Study
Several factors suggest that the vast majority of the synaptic connections evidenced in the present study are monosynaptic and had an intrinsic origin (the pre- and postsynaptic neurons were located within the BNST). All the glutamatergic EPSPs we elicited with the GU method were ≤6 mV in amplitude (mode of 1 mV). Since all the BNST neurons we recorded had a resting potential negative to −65 mV, it seems extremely unlikely that such low-amplitude EPSPs could cause enough depolarization to reach spiking threshold (−49.8 ± 0.3 mV) in a neuron not directly exposed to uncaged glutamate. Indeed, our control experiments (Fig. 1) revealed that unless the UV light stimulus was applied directly over the recorded soma or the proximal portion of the dendritic tree, it never elicited spiking. As a result, it seems extremely unlikely that the responses we observed were polysynaptic. Regarding the intrinsic versus extrinsic origin of the connections, the vast majority of the UV light stimuli used to uncage glutamate were applied entirely within the BNST. While some of the effective stimulation sites straddled BNST boundaries, they accounted for a minority of the connections we observed. Furthermore, many of these peripheral stimulation sites were located in the internal capsule, which is largely devoid of neurons, and the lateral ventricle.
One confound we cannot completely exclude, however, is the possibility that uncaged glutamate affected axon terminals contributed by neurons located in the BNST or elsewhere. Indeed, prior studies have revealed that the BNST contains a subpopulation of GABAergic axon terminals expressing NMDA receptors (Gracy and Pickel 1995; Paquet and Smith 2000). Under this scenario, uncaged glutamate would bind to presynaptic NMDA receptors and cause sufficient depolarization to trigger GABA release. While this phenomenon cannot be responsible for the glutamatergic EPSPs we observed, it could account for some of the GABAergic IPSPs. However, for this effect to occur, the axon terminal expressing NMDA receptors and its postsynaptic target would have to be located where the light stimulus is applied. Thus, this effect could only be involved in cases where both a direct response to uncaged glutamate and an IPSP were observed. However, such instances were rare in our database (<7.3% of the connections) and therefore cannot account for the pattern of results we obtained. Finally, while there is clear evidence that axon terminals in the BNST express metabotropic glutamate receptors (Gosnell et al. 2011; Grueter and Winder 2005; Grueter et al. 2006; Muly et al. 2007), it is unlikely that activation of these receptors by uncaged glutamate generated the fast synaptic events we examined because metabotropic glutamate receptors are G protein-coupled receptors that exert slow modulatory effects but do not mediate fast PSPs.
Overall Pattern of Intrinsic BNST-A Connections
Intraregional connections.
With respect to intraregional connections, a marked difference was found between the dorsal part of the BNST-AM and the rest of the BNST-A. In most of the BNST-A, intraregional connections displayed no preferential directionality. However, in the dorsal part of the BNST-AM, intrinsic connections had a predominant dorsoventral orientation (Fig. 9). Importantly, we found a parallel for this in the morphology of individual BNST-A neurons. Indeed, our reconstructions of biocytin-filled cells revealed that most BNST-AM neurons were morphologically polarized in a way consistent with the directionality of intrinsic connections, that is, their dendrites extended more in the dorsal than in the ventral direction and contributed axons that coursed ventrally. In contrast, neurons recovered from other sectors of the BNST-A showed no consistent orientation of their axons and dendrites.
Fig. 9.

Overall pattern of intrinsic BNST-A connections revealed with GU. Red and blue arrows correspond to glutamatergic (Glu) and GABAergic (GABA) connections, respectively. For intraregional connections, the number of blue and red arrows approximates the relative frequency of inhibitory and excitatory connections, respectively. For interregional connections, the thickness of the arrows was adjusted to represent the relative incidence of connections.
Although a prior study has examined the connectivity of the BNST-AM with Phaseolus vulgaris leucoagglutinin (Dong and Swanson 2006a), it did not comment on the peculiar organization we observed in the dorsal part of the BNST-AM. However, this is likely due to technical limitations inherent to tracing techniques. To disclose the type of organization we observed with GU, one would need to perform extremely small tracer injections, which is nearly impossible.
Another finding that emerged from our study is that the relative incidence of GABAergic and glutamatergic connections varied markedly in the different regions examined. Although GABAergic connections were prevalent overall, in some BNST-A regions glutamatergic connections were nearly as frequent. The incidence of glutamatergic connections was lowest in the BNST-AL and dorsal part of the BNST-AM. In contrast, in the BNST-AV and ventral region of BNST-AM, they accounted for about half of the connections (Fig. 8).
The varying incidence of GABAergic and glutamatergic connections in different BNST-A regions is consistent with the results of previous reports that used immunohistochemistry (Esclapez et al. 1993; Hur and Zaborszky 2005; Sun and Cassell 1993) or in situ hybridization (Day et al. 1999; Poulin et al. 2009; Kudo et al. 2012) to study the distribution of neurons that are GABAergic (expressing mRNA for glutamic acid decarboxylase 65 and/or 67) and/or glutamatergic [expressing mRNA for vesicular glutamate transporter 2 (VGLUT2)] in the BNST. Considered together, these studies demonstrated that GABAergic neurons are abundant in all divisions of the BNST-A, whereas the incidence of glutamatergic neurons show marked interregional variations. In particular, consistent with our observations, no (or very few) VGLUT2-positive cells were seen in the BNST-AL, whereas a significant number was seen in the BNST-AV and BNST-AM.
Interregional connections.
The connections between different BNST-A regions were asymmetric, that is, for all pairs of regions examined, connections were significantly more frequent in one direction than the other (Fig. 9). This was the case for all interregional projections involving the BNST-AL: there was a higher incidence from the BNST-AL to BNST-AM and BNST-AV than from the latter two to the BNST-AL. Conversely, all interregional connections ending in the BNST-AV were stronger than the reciprocal connections: there was a lower incidence from the BNST-AV to BNST-AM and BNST-AL than from the latter two to the BNST-AV.
This pattern of connections is consistent with the findings of earlier anterograde (Dong and Swanson 2004, 2006a) and retrograde (Shin et al. 2008) tracing studies. Indeed, these studies revealed that components of the BNST-AV receive convergent inputs from the BNST-AL and BNST-AM and that subregions of the BNST-AL and BNST-AM are reciprocally connected. However, it is difficult to compare the relative strength of the connections evidenced here with that seen in tracing studies because the size of the various Phaseolus vulgaris leucoagglutinin injection sites was not constant. Nevertheless, the results of Swanson and colleagues appear generally consistent with the notion that BNST-AL to BNST-AM connections (Dong and Swanson 2004) are stronger than in the opposite direction (Dong and Swanson 2006a). Also consistent with our findings, BNST-AL projections to the BNST-AV (Dong and Swanson 2004) appear denser than in the opposite direction (Dong et al. 2001b).
In the present study, interregional connections also differed in the relative incidence of GABAergic and glutamatergic inputs (Fig. 9). Paralleling the intraregional connections, the projections of the BNST-AL to BNST-AM or BNST-AV were almost exclusively GABAergic. Similarly, return projections from the BNST-AM and BNST-AV to BNST-AL were also characterized by a scarcity of glutamatergic connections. In contrast, the connections between BNST-AM and BNST-AV included both glutamatergic and GABAergic projections.
The notion that a proportion of GABAergic and glutamatergic BNST-A neurons contribute axons that extend beyond the confines of the subregion where their somata is located is supported by results from earlier anatomic and physiological studies. For instance, it has been reported that GABAergic cells in the BNST-AM and BNST-AV project to the paraventricular hypothalamic nucleus (Herman et al. 2004; Radely et al. 2009; Radley and Sawchenko 2011). Similarly, it has been reported than GABAergic BNST-AL neurons project to the central amygdala (Sun and Cassell 1993). Finally, with respect to excitatory outputs, it has been shown that the BNST-AV contains glutamatergic neurons that project to the ventral tegmental area (Georges and Aston-Jones 2001, 2002; Jalabert et al. 2009; Kudo et al. 2012).
Functional Implications
The pattern intrinsic connectivity disclosed in the present study implies that different BNST-A sectors do not act independently. In particular, because the projections of the BNST-AL to BNST-AM and BNST-AV are purely inhibitory and stronger than the reciprocating pathways, the BNST-AL is strategically positioned to determine, or at least modulate, activity levels in the rest of the BNST-A. This suggests an arrangement where the BNST-AL, via its inhibitory projections to the BNST-AM and BNST-AV, acts as a gating mechanism for many BNST-A outputs. When BNST-AL activity is high, this tends to reduce firing rates in BNST-AM and BNST-AV neurons. Conversely, a reduction in BNST-AL activity could cause a positive (or self-reinforcing) feedback effect where disinhibition of the BNST-AM from BNST-AL inputs would increase return inhibitory projections from the BNST-AM to BNST-AL, resulting in a further disinhibition of the BNST-AM, and so on. In addition to these competitive interactions, our findings raise the possibility that other sectors of the BNST-A entertain cooperative relations. Indeed, the high incidence of glutamatergic connections between the BNST-AV and ventral part of the BNST-AM suggest that neurons in these two regions may mutually enhance their excitability.
At present, it is difficult to assess how significant the impact of intrinsic BNST-A connections might be. While the incidence of interregional connections was relatively low, it was likely underestimated because many connections, particularly the longer ones, are lost when slices are prepared. In addition, it is likely that intrinsic inputs ending in the distal dendrites of BNST neurons could not be detected due to electrotonic attenuation. Besides, the influence of intrinsic BNST connections depends on a variety of factors, including moment-to-moment variations in the activity of extrinsic afferents as well as modulatory inputs. In any event, the above considerations highlight the difficulty of interpreting lesion and pharmacobehavioral studies. Depending what exact BNST-A sector is lesioned or inactivated, opposite behavioral consequences can emerge.
GRANTS
This work was supported by National Institute of Mental Health Grant R01-MH-098738.
DISCLOSURES
No conflicts of interest, financial or otherwise, are declared by the author(s).
AUTHOR CONTRIBUTIONS
Author contributions: H.K.T. and O.E.R.-S. performed experiments; H.K.T. and D.P. analyzed data; H.K.T. interpreted results of experiments; H.K.T. and D.P. prepared figures; H.K.T. and O.E.R.-S. edited and revised manuscript; H.K.T., O.E.R.-S., and D.P. approved final version of manuscript; D.P. conception and design of research; D.P. drafted manuscript.
REFERENCES
- Alheid GF, Heimer L. New perspectives in basal forebrain organization of special relevance for neuropsychiatric disorders: the striatopallidal, amygdaloid, and corticopetal components of substantia innominata. Neuroscience 27: 1–39, 1988 [DOI] [PubMed] [Google Scholar]
- Andy OJ, Stephan H. The septum of the cat. Springfield: Thomas, 1964 [Google Scholar]
- Apergis-Schoute J, Pinto A, Pare D. Muscarinic control of long-range GABAergic inhibition within the rhinal cortices. J Neurosci 27: 4061–4071, 2007 [DOI] [PMC free article] [PubMed] [Google Scholar]
- Cullinan WE, Herman JP, Watson SJ. Ventral subicular interaction with the hypothalamic paraventricular nucleus: evidence for a relay in the bed nucleus of the stria terminalis. J Comp Neurol 13: 1258–1279, 1993 [DOI] [PubMed] [Google Scholar]
- Davis M, Walker DL, Miles L, Grillon C. Phasic vs sustained fear in rats and humans: role of the extended amygdala in fear vs anxiety. Neuropsychopharmacology 35: 105–135, 2010 [DOI] [PMC free article] [PubMed] [Google Scholar]
- Day H, Curran EJ, Watson S, Jr, Akil H. Distinct neurochemical populations in the rat central nucleus of the amygdala and bed nucleus of the stria terminalis: evidence for their selective activation by interleukin-1β. J Comp Neurol 413: 113–128, 1999 [PubMed] [Google Scholar]
- De Olmos JS, Heimer L. The concepts of the ventral striatopallidal system and extended amygdala. Ann NY Acad Sci 877:1–32, 1999 [DOI] [PubMed] [Google Scholar]
- De Olmos JS, Alheid GF, Beltramino CA. Amygdala. In: The Rat Nervous System. Forebrain and Midbrain, edited by Paxinos G. Orlando, FL: Academic, 1985, vol. 1, p. 509–603 [Google Scholar]
- Dong HW, Swanson LW. Projections from the rhomboid nucleus of the bed nucleus of the stria terminalis: implications for cerebral hemisphere regulation of ingestive behaviors. J Comp Neurol 463: 795–799, 2003 [DOI] [PubMed] [Google Scholar]
- Dong HW, Swanson LW. Organization of axonal projections from the anterolateral area of the bed nuclei of the stria terminalis. J Comp Neurol 468: 277–298, 2004 [DOI] [PubMed] [Google Scholar]
- Dong HW, Swanson LW. Projections from bed nuclei of the stria terminalis, anteromedial area: cerebral hemisphere integration of neuroendocrine, autonomic, and behavioral aspects of energy balance. J Comp Neurol 494: 142–178, 2006a [DOI] [PMC free article] [PubMed] [Google Scholar]
- Dong HW, Swanson LW. Projections from bed nuclei of the stria terminalis, magnocellular nucleus: implications for cerebral hemisphere regulation of micturition, defecation, and penile erection. J Comp Neurol 494: 108–141, 2006b [DOI] [PMC free article] [PubMed] [Google Scholar]
- Dong HW, Swanson LW. Projections from bed nuclei of the stria terminalis, dorsomedial nucleus: implications for cerebral hemisphere integration of neuroendocrine, autonomic, and drinking responses. J Comp Neurol 494: 75–107, 2006c [DOI] [PMC free article] [PubMed] [Google Scholar]
- Dong HW, Petrovich GD, Swanson LW. Organization of projections from the juxtacapsular nucleus of the BST: a PHAL study in the rat. Brain Res 859: 1–14, 2000 [DOI] [PubMed] [Google Scholar]
- Dong HW, Petrovich GD, Swanson LW. Topography of projections from amygdala to bed nuclei of the stria terminalis. Brain Res Brain Res Rev 38: 192–246, 2001a [DOI] [PubMed] [Google Scholar]
- Dong HW, Petrovich GD, Watts AG, Swanson LW. Basic organization of projections from the oval and fusiform nuclei of the bed nuclei of the stria terminalis in adult rat brain. J Comp Neurol 436: 430–455, 2001b [DOI] [PubMed] [Google Scholar]
- Dumont EC, Rycroft BK, Maiz J, Williams JT. Morphine produces circuit-specific neuroplasticity in the bed nucleus of the stria terminalis. Neuroscience 153: 232–239, 2008 [DOI] [PMC free article] [PubMed] [Google Scholar]
- Dumont EC, Mark GP, Mader S, Williams JT. Self-administration enhances excitatory synaptic transmission in the bed nucleus of the stria terminalis. Nat Neurosci 8: 413–414, 2005 [DOI] [PMC free article] [PubMed] [Google Scholar]
- Erb S, Stewart J. A role for the bed nucleus of the stria terminalis, but not the amygdala, in the effects of corticotropin-releasing factor on stress-induced reinstatement of cocaine seeking. J Neurosci 19: C1–C6, 1999 [DOI] [PMC free article] [PubMed] [Google Scholar]
- Esclapez M, Tillakaratne N, Tobin AJ, Houser CR. Comparative localization of two forms of glutamic acid decarboxylase with nonradioactive in situ hybridization methods. J Comp Neurol 331: 339–362, 1993 [DOI] [PubMed] [Google Scholar]
- Fendt M, Siegl S, Steiniger-Brach B. Noradrenaline transmission within the ventral bed nucleus of the stria terminalis is critical for fear behavior induced by trimethylthiazoline, a component of fox odor. J Neurosci 25: 5998–6004, 2005 [DOI] [PMC free article] [PubMed] [Google Scholar]
- Georges F, Aston-Jones G. Potent regulation of midbrain dopamine neurons by the bed nucleus of the stria terminalis. J Neurosci 21: RC160, 2001 [DOI] [PMC free article] [PubMed] [Google Scholar]
- Georges F, Aston-Jones G. Activation of ventral tegmental area cells by the bed nucleus. J Neurosci 22: 5173–5187, 2002 [DOI] [PMC free article] [PubMed] [Google Scholar]
- Gosnell HB, Silberman Y, Grueter BA, Duvoisin RM, Raber J, Winder DG. mGluR8 modulates excitatory transmission in the bed nucleus of the stria terminalis in a stress-dependent manner. Neuropsychopharmacology 36: 1599–1607, 2011 [DOI] [PMC free article] [PubMed] [Google Scholar]
- Gray KN, Pickel VM. Comparative ultrastructural localization of the NMDAR1 glutamate receptor in the rat basolateral amygdala and bed nucleus of the stria terminalis. J Comp Neurol 362: 71–85, 1995 [DOI] [PubMed] [Google Scholar]
- Grueter BA, Winder DG. Group II and III metabotropic glutamate receptors suppress excitatory synaptic transmission in the dorsolateral bed nucleus of the stria terminalis. Neuropsychopharmacology 30: 1302–1311, 2005 [DOI] [PubMed] [Google Scholar]
- Grueter BA, Gosnell HB, Olsen CM, Schramm-Sapyta NL, Nekrasova T, Landreth GE, Winder DG. Extracellular-signal regulated kinase 1-dependent metabotropic glutamate receptor 5-induced long-term depression in the bed nucleus of the stria terminalis is disrupted by cocaine administration. J Neurosci 26: 3210–3219, 2006 [DOI] [PMC free article] [PubMed] [Google Scholar]
- Guo JD, Rainnie DG. Presynaptic 5-HT1B receptor-mediated serotonergic inhibition of glutamate transmission in the bed nucleus of the stria terminalis. Neuroscience 165: 1390–1401, 2010 [DOI] [PMC free article] [PubMed] [Google Scholar]
- Guo JD, Hammack SE, Hazra R, Levita L, Rainnie DG. Bi-directional modulation of bed nucleus of stria terminalis neurons by 5-HT: molecular expression and functional properties of excitatory 5-HT receptor subtypes. Neuroscience 164: 1776–1793, 2009 [DOI] [PMC free article] [PubMed] [Google Scholar]
- Hammack SE, Mania I, Rainnie DG. Differential expression of intrinsic membrane currents in defined cell types of the anterolateral bed nucleus of the stria terminalis. J Neurophysiol 98: 638–656, 2007 [DOI] [PubMed] [Google Scholar]
- Hazra R, Guo JD, Ryan SJ, Jasnow AM, Dabrowska J, Rainnie DG. A transcriptomic analysis of type I-III neurons in the bed nucleus of the stria terminalis. Mol Cell Neurosci 46: 699–709, 2011 [DOI] [PMC free article] [PubMed] [Google Scholar]
- Hazra R, Guo JD, Dabrowska J, Rainnie DG. Differential distribution of serotonin receptor subtypes in BNST(ALG) neurons: modulation by unpredictable shock stress. Neuroscience 225: 9–21, 2012 [DOI] [PMC free article] [PubMed] [Google Scholar]
- Herman JP, Mueller NK, Figueiredo H. Role of GABA and glutamate circuitry in hypothalamo-pituitary-adrenocortical stress integration. Ann NY Acad Sci 1018: 35–45, 2004 [DOI] [PubMed] [Google Scholar]
- Holstege G, Meiners L, Tan K. Projections of the bed nucleus of the stria terminalis to the mesencephalon, pons, and medulla oblongata in the cat. Exp Brain Res 58: 379–391, 1985 [DOI] [PubMed] [Google Scholar]
- Hopkins DA, Holstege G. Amygdaloid projections to the mesencephalon, pons and medulla oblongata in the cat. Exp Brain Res 32: 529–547, 1978 [DOI] [PubMed] [Google Scholar]
- Hur EE, Zaborszky L. Vglut2 afferents to the medial prefrontal and primary somatosensory cortices: a combined retrograde tracing in situ hybridization study. J Comp Neurol 483: 351–373, 2005 [DOI] [PubMed] [Google Scholar]
- Jalabert M, Aston-Jones G, Herzog E, Manzoni O, Georges F. Role of the bed nucleus of the stria terminalis in the control of ventral tegmental area dopamine neurons. Prog Neuropsychopharmacol Biol Psychiatry 33: 1336–1346, 2009 [DOI] [PMC free article] [PubMed] [Google Scholar]
- Ju G, Swanson LW. Studies on the cellular architecture of the bed nuclei of the stria terminalis in the rat: I. Cytoarchitecture. J Comp Neurol 280: 587–602, 1989 [DOI] [PubMed] [Google Scholar]
- Ju G, Swanson LW, Simerly RB. Studies on the cellular architecture of the bed nuclei of the stria terminalis in the rat: II. Chemoarchitecture. J Comp Neurol 280: 603–621, 1989 [DOI] [PubMed] [Google Scholar]
- Kash TL, Nobis WP, Matthews RT, Winder DG. Dopamine enhances fast excitatory synaptic transmission in the extended amygdala by a CRF-R1-dependent process. J Neurosci 28: 13856–13865, 2008 [DOI] [PMC free article] [PubMed] [Google Scholar]
- Krawczyk M, Georges F, Sharma R, Mason X, Berthet A, Bézard E, Dumont EC. Double-dissociation of the catecholaminergic modulation of synaptic transmission in the oval bed nucleus of the stria terminalis. J Neurophysiol 105: 145–153 2011 [DOI] [PMC free article] [PubMed] [Google Scholar]
- Krettek JE, Price JL. A description of the amygdaloid complex in the rat and cat with observations on intra-amygdaloid axonal connections. J Comp Neurol 178: 255–280, 1978a [DOI] [PubMed] [Google Scholar]
- Krettek JE, Price JL. Amygdaloid projections to subcortical structures within the basal forebrain and brainstem in the rat and cat. J Comp Neurol 178: 225–254, 1978b [DOI] [PubMed] [Google Scholar]
- Kudo T, Uchigashima M, Miyazaki T, Konno K, Yamasaki M, Yanagawa Y, Minami M, Watanabe M. Three types of neurochemical projection from the bed nucleus of the stria terminalis to the ventral tegmental area in adult mice. J Neurosci 32: 18035–18046, 2012 [DOI] [PMC free article] [PubMed] [Google Scholar]
- Larriva-Sahd J. Histological and cytological study of the bed nuclei of the stria terminalis in adult rat. II. Oval nucleus: extrinsic inputs, cell types, neuropil, and neuronal modules. J Comp Neurol 497: 772–807, 2006 [DOI] [PubMed] [Google Scholar]
- McDonald AJ. Neurons of the bed nucleus of the stria terminalis: a golgi study in the rat. Brain Res Bull 10: 111–120, 1983 [DOI] [PubMed] [Google Scholar]
- McDonald AJ, Shammah-Lagnado SJ, Shi C, Davis M. Cortical afferents to the central extended amygdala. Ann NY Acad Sci 877: 309–338, 1999 [DOI] [PubMed] [Google Scholar]
- McDonald AJ. Is there an amygdala and how far does it extend? An anatomical perspective. Ann NY Acad Sci 985: 1–21, 2003 [DOI] [PubMed] [Google Scholar]
- McElligott ZA, Klug JR, Nobis WP, Patel S, Grueter BA, Kash TL, Winder DG. Distinct forms of Gq-receptor-dependent plasticity of excitatory transmission in the BNST are differentially affected by stress. Proc Natl Acad Sci USA 107: 2271–2276, 2010 [DOI] [PMC free article] [PubMed] [Google Scholar]
- Moga MM, Saper CB, Gray TS. Bed nucleus of the stria terminalis: cytoarchitecture, immunohistochemistry, and projection to the parabrachial nucleus in the rat. J Comp Neurol 283: 315–332, 1989 [DOI] [PubMed] [Google Scholar]
- Muly EC, Mania I, Guo JD, Rainnie DG. Group II metabotropic glutamate receptors in anxiety circuitry: correspondence of physiological response and subcellular distribution. J Comp Neurol 505: 682–700, 2007 [DOI] [PubMed] [Google Scholar]
- Paquet M, Smith Y. Presynaptic NMDA receptor subunit immunoreactivity in GABAergic terminals in rat brain. J Comp Neurol 423: 330–337, 2000 [DOI] [PubMed] [Google Scholar]
- Paré D, Smith Y, Paré JF. Intra-amygdaloid projections of the basolateral and basomedial nuclei in the cat: phaseolus vulgaris-leucoagglutinin anterograde tracing at the light and electron microscopic level. Neuroscience 69: 567–583, 1995 [DOI] [PubMed] [Google Scholar]
- Polston EK, Gu G, Simerly RB. Neurons in the principal nucleus of the bed nuclei of the stria terminalis provide a sexually dimorphic GABAergic input to the anteroventral periventricular nucleus of the hypothalamus. Neuroscience 123: 793–803, 2004 [DOI] [PubMed] [Google Scholar]
- Poulin JF, Arbour D, Laforest S, Drolet G. Neuroanatomical characterization of endogenous opioids in the bed nucleus of the stria terminalis. Prog Neuropsychopharmacol Biol Psychiatry 33: 1356–1365, 2009 [DOI] [PubMed] [Google Scholar]
- Prewitt CM, Herman JP. Anatomical interactions between the central amygdaloid nucleus and the hypothalamic paraventricular nucleus of the rat: a dual tract-tracing analysis. J Chem Neuroanat 15: 173–185, 1998 [DOI] [PubMed] [Google Scholar]
- Radley JJ, Gosselink KL, Sawchenko PE. A discrete GABAergic relay mediates medial prefrontal cortical inhibition of the neuroendocrine stress response. J Neurosci 29: 7330–7340, 2009 [DOI] [PMC free article] [PubMed] [Google Scholar]
- Radley JJ, Sawchenko PE. A common substrate for prefrontal and hippocampal inhibition of the neuroendocrine stress response. J Neurosci 31: 9683–9695, 2011 [DOI] [PMC free article] [PubMed] [Google Scholar]
- Savander V, Go CG, LeDoux JE, Pitkänen A. Intrinsic connections of the rat amygdaloid complex: projections originating in the basal nucleus. J Comp Neurol 361: 345–368, 1995 [DOI] [PubMed] [Google Scholar]
- Shin JW, Geerling JC, Loewy AD. Inputs to the ventrolateral bed nucleus of the stria terminalis. J Comp Neurol 511: 628–657, 2008 [DOI] [PMC free article] [PubMed] [Google Scholar]
- Sofroniew MV. Direct reciprocal connections between the bed nucleus of the stria terminalis and dorsomedial medulla oblongata: evidence from immunohistochemical detection of tracer proteins. J Comp Neurol 213: 388–405, 1983 [DOI] [PubMed] [Google Scholar]
- Sun N, Cassell MD. Intrinsic GABAergic neurons in the rat central extended amygdala. J Comp Neurol 330: 381–404, 1993 [DOI] [PubMed] [Google Scholar]
- Ulrich-Lai YM, Herman JP. Neural regulation of endocrine and autonomic stress responses. Nat Rev Neurosci 10: 397–409, 2009 [DOI] [PMC free article] [PubMed] [Google Scholar]
- Veening JG, Swanson LW, Sawchenko PE. The organization of projections from the central nucleus of the amygdala to brainstem sites involved in central autonomic regulation: a combined retrograde transport-immunohistochemical study. Brain Res 303: 337–357, 1984 [DOI] [PubMed] [Google Scholar]