

Abstract
We have determined the change in the number of proteins bound non-specifically to DNA as a function of applied force using force–extension measurements on tethered DNA. Using magnetic tweezers, single molecules of λ DNA were repeatedly stretched and relaxed in the absence and presence of 170 nM λ repressor protein (CI). CI binds to six specific sites of λ DNA with nanomolar affinity and also binds non-specifically with micromolar affinity. The force versus extension data were analyzed using a recently developed theoretical framework for quantitative determination of protein binding to the DNA. The results indicate that the non-specific binding of CI changes the force–extension relation significantly in comparison to that of naked DNA. The DNA tether used in our experiment would have about 640 bound repressors, if it was completely saturated with bound proteins. We find that as the pulling force on DNA is reduced from 4.81 to 0.13 pN, approximately 138 proteins bind to DNA, which is about 22% of the length of the tethered DNA. Our results show that 0.13 pN is not low enough to cause saturation of DNA by repressor and 4.81 pN is also not high enough to eliminate all the repressors bound to DNA. This demonstrates that the force–extension relation provides an effective approach for estimating the number of proteins bound non-specifically to a DNA molecule.
1. Introduction
Protein binding to DNA plays a fundamental role in many cellular and viral functions, including gene expression, physical chromosome organization, chromosome replication, and genetic recombination [1–3]. Therefore, quantitative approaches with which to elucidate the physics of protein–DNA binding could provide for a deeper understanding of cellular function. Many transcriptional regulators are known to bind to DNA both specifically and non-specifically, thus non-specific binding may play a biological role. Experiments have shown that the rate of binding the target site increases when non-specific binding increases. This was shown by extending the DNA chain around the specific target as well as by decreasing the salt concentration (for a review see [4]). In transcription, this effect of non-specific binding on target binding could manifest itself, for example, in the control of transcriptional noise and in the facilitation of cooperative interactions. Furthermore, non-specific binding of proteins to DNA is a ubiquitous phenomenon in genomes. Notable examples are those of histones in eukaryotes, which display weakly sequence-dependent affinity [5, 6], and of nucleoid-associated proteins in prokaryotes [7, 8]. In some cases, the equilibrium constants for non-specific binding have been measured [9] and non-specific binding has been found to occur with a relatively high probability compared to specific binding [10]. While specific DNA binding is easily characterized with a variety of established biochemical techniques, such as gel electrophoresis, which use short DNA sequences, non-specific binding is more difficult to characterize.
Another example of biological phenomenon which could be heavily influenced by non-specific binding is that of protein-mediated DNA loop formation. This is a paradigmatic mechanism for transcriptional regulation where proteins bound to distant specific sites interact creating a loop in the intervening DNA. DNA looping may stimulate or repress transcription according to the specific genetic system. Novel experimental techniques based on single molecule microscopy have provided much new insight into the long-range, regulatory interactions involved in protein-mediated transcriptional looping. See, for example [11–16]. The role of non-specific binding in this regulatory looping has not, however, been investigated. While it is easy to imagine that, depending on the length of the separation between the specific sites that give rise to DNA looping, non-specific binding may help shorten such distances considerably (if it is accompanied by DNA bending). Non-specific binding may therefore increase the probability of the specific interaction, and prove instrumental for the regulatory looping to take place. DNA bending by non-specific protein binding has indeed been reported before, for example in [17–22], using single molecule manipulation techniques. However, characterization of the level of a protein non-specific binding to DNA has been difficult mostly because of the lack of a model that would allow quantitative determination of the number of bound proteins from the experimental data.
Recently, Zhang and Marko [23] proposed a thermodynamic approach, which may be used to estimate the number of non-specifically bound proteins from extension versus force measurements. In this paper, we determine the change in the number of λ repressor proteins bound to a 16 kbp-long fragment of λ DNA by applying the Zhang–Marko approach [23] to our experimental data. The λ repressor, also known as CI protein, binds both specifically and non-specifically to DNA. Specific cooperative binding mediates a 2.3 kbp loop in λ DNA between the oL region (containing specific binding sites oL1, oL2 and oL3) and the oR region (containing specific binding sites oR1, oR2 and oR3) [14]. CI-mediated DNA looping provides stability to the quiescent (lysogenic) state of the λ bacteriophage after infection of its host, E. coli and, simultaneously, guarantees efficient switch to virulence (lysis) when triggered by environmental conditions [24, 25]. Non-specific binding may facilitate loop formation by shortening the effective loop length and may also provide further loop stabilization by enhancing the long-range interaction. Non-specific binding has a substantial free energy of 4.1 kcal mol−1 [26], which suggests that most, if not all, of the CI protein available in the cell is DNA bound and supports the hypothesis of the biological relevance of non-specific binding.
Here, significant CI non-specific binding is confirmed by force versus DNA extension curves obtained with magnetic tweezers. The change in amount of non-specifically bound protein is then estimated using the Zhang–Marko approach [23].
The outline of the paper is as follows. In section 2, sample preparation and experimental technique are described. The experimental force versus extension results are described in section 3. The theoretical framework utilized and the calculation of the change in the number of bound proteins from our experimental data are discussed in section 4. Finally, in section 5 we comment on the significance of our results
2. Materials and methods
The CI protein was kindly provided by the Adhya group at NIH/NCI. The λ DNA tethers used were produced using plasmid pKLJ12wt, provided by the Yang group [27]. The plasmid, which is approximately 16 kbp-long, was digested with SacI and SacII restriction enzymes to give a linear 15546 base pair DNA fragment. Approximately 2 kbp biotin- and digoxigenin-labeled fragments were created using polymerase chain reaction (PCR) and, cut with SacI or SacII to generate complementary ends for attaching to the main DNA fragment by ligation [28]. Single molecules of this DNA were attached at one end to the antidigoxigenin-coated glass surface of a flow-chamber and at the other end to a 2.8 μm streptavidin-coated, super-paramagnetic bead (Invitrogen, Carlsbad, CA, USA) (see figure 1).
Figure 1.
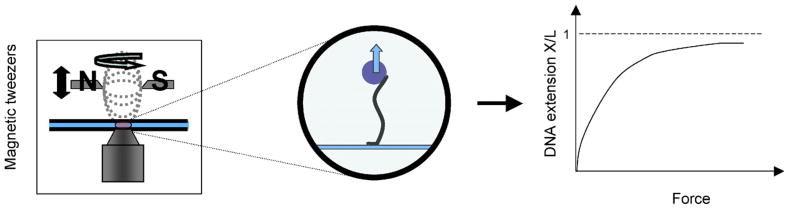
Schematic diagram of the magnetic tweezer setup and the expected force–extension curve.
They were observed in a buffer containing: 10 mM TrisHCl pH 7.4, 200 mM KCl, 5% DMSO, 0.1 mM EDTA, 0.2 mM DTT and 0.1 mg ml−1 casein.
Magnetic tweezers (MT) were used to stretch the DNA tethers. MT most commonly consist of a pair of magnets placed on a mount above the microscope stage that can be both translated along or rotated around the optical axis of the microscope. The magnetic field attracts a DNA-tethered super-paramagnetic bead, and stretches the DNA tether (see figure 1). Therefore, the distance of the magnets above the stage of the microscope from the sample can control the tension on the DNA tethers, which in our setup was limited to 10 pN maximum. Individual λ DNA molecules were stretched according to [29], both in the absence and in the presence of 170 nM CI. After their contour length was determined at high forces (10 pN), molecules were relaxed and stretched several times and their extension was recorded as a function of force during each relaxation and stretching cycle. This was done by moving the magnet through 18–20 different positions which corresponded to forces in the range from 10 to 0.02 pN approximately.
At each position, data were acquired at a rate of 20 frames s−1 before moving to the next magnet position. The extension, l = 〈z〉, of the molecule of the DNA was monitored with an error of about 10 nm with 1 s averaging using three-dimensional, video-rate tracking of the bead [30]. The horizontal motion of the bead 〈Δx2〉 allowed the determination of the tension in the molecule via the equipartition theorem: F = kBT l/〈Δx2〉 with 10% accuracy. Mechanical drift in the data was eliminated using differential tracking of a second bead stuck on the surface. Data were analyzed as described in [31].
3. Results
Figure 2 shows the extension versus force curves for a representative DNA tether which was subjected to 10 cycles of stretching and relaxation, first in the absence of protein and, then, in the presence of 170 nM CI. The data clearly show that more force is needed to stretch the DNA molecule in the presence of protein. Note that the 2.3 kbp-long, DNA loop between the specific binding sites in the oL and oR regions mediated by CI is never detected, because the tension suppresses Brownian fluctuations large enough to bring such distant sites in the reciprocal vicinity. The difference between the control data (circles) and the overall protein data (diamonds) at a given force (magnet position) also appears to increase as the force decreases. This may indicate that at lower forces, it is easier for more proteins to bind non-specifically, as one would expect from work indicating that tension drives off proteins from the molecule [29].
Figure 2.

Extension X/L versus force data obtained by stretching a single molecule of DNA in the presence of 170 nM CI using MT. The data points represent averages at each force (magnet position). The symbols are as follows: black circles represent the control data (absence of CI); green diamonds represent the data in the presence of 170 nM CI; red open diamonds represent half of the data in the presence of protein while the molecule was being stretched; blue crosses represent half of the data in the presence of protein while the molecule was being relaxed. The error bars represent one standard deviation in the DNA extension.
4. Calculation of the change in the number of bound proteins
The change in the number of non-specifically bound CI proteins (all bound proteins except the six specifically bound) in these data was estimated using a theory proposed by Zhang and Marko [23]. The Zhang–Marko approach is based on writing a microscopic energy function describing the equilibrium thermodynamics of a finite-length DNA molecule interacting with protein, in the form:
| (1) |
Here τ is the external constant torque, coupled to the DNA linking number expressed as an angle, and the constant force f is coupled to one space component of the end-to-end extension X. The finite sum is over all binding positions i with binding affinities Ki, where ni denotes binding position-occupation number and protein concentration c is related to the chemical potential μ. The last term Eint is the internal energy due to conformational fluctuations of the DNA molecule and bound proteins. Writing the exact differential of the energy as a function of its proper thermodynamic variables f, μ, and τ, Zhang and Marko derive three Maxwell relations. One of the relations,
| (2) |
relates the average end-to-end extension 〈X〉 to the average number of bound proteins 〈N〉. This relation implies that, if one measures extension as a function of force and protein concentration, the change, ΔN = 〈N〉f,μ,τ − 〈N〉f0,μ, τ, in number of bound proteins as a function of the pulling force, f, can be calculated by carrying out the integration,
| (3) |
where f0 is a reference value of the force. We used our experimentally measured, force–extension data for λ DNA to evaluate the integral numerically employing two different methods. In the first method, we used a Riemann sum approach calculating the integral by summing the areas under the data points. In the second method, we first fitted the data to a convenient functional form and then evaluated the integral analytically.
The force–extension data, shown in figure 2, were obtained by plotting the average change in the extension of the molecule obtained in the absence of CI and in the presence of 170 nM CI, as a function of force. For the numerical integration, we estimated the derivative (∂〈X〉/∂μ)f, τ in equation (3) from the shift in extension between the two sets of measurements (one in the absence of protein and the other at 170 nM protein concentration) at different forces. To do so, we first recognize that μ = kBT ln(c) and substitute it in equation (3) to express the integrand in terms of the experimentally known quantity c:
| (4) |
We, then approximate the derivative ∂〈X〉/∂c at c = 170 nM as ΔX/Δc with Δc = 170 nM. Figure 3 shows the shift in extension, ΔX, along with its error, as a function of force.
Figure 3.

Shift in DNA extension ΔX versus force. The error bars are the sum of the standard deviations of the extension measurements at each concentration, divided by the square root of the number of measurements, which is 10. The continuous curves are the best least squares fit to the data using the analytic function of the form a/(1 + bx). The solid line shows the best fit to the experimental data (circles), the dotted curve shows the best fit to the upper bound of the data (× symbols), and the dashed curve is the best fit to the lower bound of the data (+ symbols).
Based on the calculations described above, table 1 shows the estimated reduction ΔN at c = 170 nM as the calibrated force increases from f = 0.13 pN to f0 = 4.81 pN. We report the results based on two integration methods, one using the Riemann sum approximation and the other using analytic curve-fitting on the data. For each method, in addition to integrating along the average data points, we integrated along the upper and lower bounds of the error bars. This was done to show the impact of the error on the estimated change in the number of bound proteins. The second method used to calculate the change in the number of bound proteins was to fit the shift versus force data to a continuous function and then integrate it analytically over the desired range of forces. We fitted the data to the functional form a/(1 + bx), because of its analytic simplicity and the fact that the data appear to have the functional form of the usual Langmuir adsorption curve. As shown in figure 3, we obtained excellent least squares fit to the data, as well as the upper and lower bound values of the data with one standard deviation of error. The values of the parameters a and b for all three cases are also reported in table 1. Finally, in figure 4, we also show the increase of the non-specific binding as the force is reduced from 4.81 to 0.13 pN.
Table 1.
The reduction in the number of bound proteins calculated from (3) as the force increases from f = 0.13 pN to f0 = 4.81 pN. The calculated values using the Riemann sum approach, and an analytical integration of a function of the form a/(1 + bx), are given for the average data points, as well as the upper bound and the lower bound values. The values of a and b from the best least squares fit are also shown.
| Data points | a | b | Analytic | Riemann sum |
|---|---|---|---|---|
| Average | 592.6 | 2.345 | 138 | 136 |
| Lower bound | 515.8 | 3.103 | 98 | 76 |
| Upper bound | 667.0 | 1.864 | 184 | 196 |
Figure 4.

The change ΔN/(L/d) in protein occupancy for DNA at 170 nM CI as the force reduces from 4.81 to 0.13 pN. Here, L is the length of the DNA molecule and d is the length of a single binding site. The blue dots represent the change as estimated using the average data points and are shown along with their error bars defined by upper and lower bound values.
Based on the fact that the length L of the DNA tether is about 16 kbp, and assuming that a non-specifically bound protein occupies a length d of about 25 bp, a tether that is completely saturated with protein would have about 640 bound repressors. We observe from figure 4 that, at 170 nM CI, as the pulling force on DNA is reduced from 4.81 to 0.13 pN, an additional 22% of the length of the tethered DNA becomes bound by CI proteins. Furthermore, we observe that the nonzero slope of the curve at 0.13 pN in figure 4 suggests that this force is not low enough to cause saturation of DNA by repressors. Likewise, the non-zero slope at 4.81 pN suggests that this force is not high enough to minimize the number of repressors bound to DNA.
5. Conclusion
In this work, the difference between force versus DNA extension curves obtained in the absence and presence of protein were analyzed using a recent implementation of the Maxwell relations [23] in order to quantify the number of DNA bound proteins. Although this is a proof of principle report, with measurements performed using only one protein concentration, it clearly shows the applicability of the Zhang and Marko approach [23] and the biophysical significance of this kind of experiment and analysis. A more detailed study is in progress using different protein concentrations which will allow determination of the protein binding affinity of the absolute number of proteins bound. Indeed, a detailed and quantitative characterization of non-specific protein binding to DNA is essential to the understanding of this extremely important physiochemical phenomenon, which is involved in many (in time, we may find all) DNA transactions and may be a significant part of most regulatory mechanisms based on long-range protein–protein interactions on the genomic scaffold.
Acknowledgments
We would like to thank Haw Yang for sharing his plasmids, Sankar Adhya and Dale Lewis for providing the CI protein, and Carlo Manzo for preliminary work. This work was supported by the Human Frontier Science Programme Organization (RGP0050/2002-C to LF); Emory University Research Council-2006 and NIH R01, RGM084070A to LF. FF would like to thank the Emory College of Arts and Sciences for a Seed Grant.
Contributor Information
Paul Liebesny, Email: pliebesny@gmail.com.
Sachin Goyal, Email: sgoyal@umich.edu.
David Dunlap, Email: ddunlap@emory.edu.
Fereydoon Family, Email: phyff@emory.edu.
Laura Finzi, Email: lfinzi@emory.edu.
References
- 1.Broach JR. Making the right choice—long-range chromosomal interactions in development. Cell. 2004;119:583–6. doi: 10.1016/j.cell.2004.11.029. [DOI] [PubMed] [Google Scholar]
- 2.Roeder RG. The eukaryotic transcriptional machinery: complexities and mechanisms unforeseen. Nat Med. 2003;9:1239–44. doi: 10.1038/nm938. [DOI] [PubMed] [Google Scholar]
- 3.Alberts B, Bray D, Hopkins K, Johnson A, Lewis J, Roberts K, Walter P, Raff M. Essential Cell Biology: An Introduction to the Molecular Biology of the Cell. New York: Garland Publishing Inc; 1998. [Google Scholar]
- 4.Revzin A. The Biology of Non-Specific DNA–Protein Interactions. Boca Raton, FL: CRC Press; 1990. [Google Scholar]
- 5.Jiang CZ, Pugh BF. Nucleosome positioning and gene regulation: advances through genomics. Nat Rev Genet. 2009;10:161–72. doi: 10.1038/nrg2522. [DOI] [PMC free article] [PubMed] [Google Scholar]
- 6.Segal E, Widom J. Poly(da:dt) tracts: major determinants of nucleosome organization. Curr Opin Struct Biol. 2009;19:65–71. doi: 10.1016/j.sbi.2009.01.004. [DOI] [PMC free article] [PubMed] [Google Scholar]
- 7.Azam TA, Ishihama A. Twelve species of the nucleoid-associated protein from escherichia coli—sequence recognition specificity and DNA binding affinity. J Biol Chem. 1999;274:33105–13. doi: 10.1074/jbc.274.46.33105. [DOI] [PubMed] [Google Scholar]
- 8.Wiggins PA, Dame RT, Noom MC, Wuite GJ. Protein-mediated molecular bridging: a key mechanism in biopolymer organization. Biophys J. 2009;97:1997–2003. doi: 10.1016/j.bpj.2009.06.051. [DOI] [PMC free article] [PubMed] [Google Scholar]
- 9.Pray TR, Burz DS, Ackers GK. Cooperative non-specific DNA binding by octamerizing λcI repressors: a site-specific thermodynamic analysis. J Mol Biol. 1998;282:947–58. doi: 10.1006/jmbi.1998.2056. [DOI] [PubMed] [Google Scholar]
- 10.Brenowitz M, Senear DF, Shea MA, Ackers GK. ‘footprint’ titrations yield valid thermodynamic isotherms. Proc Natl Acad Sci USA. 1986;83:8462–6. doi: 10.1073/pnas.83.22.8462. [DOI] [PMC free article] [PubMed] [Google Scholar]
- 11.Finzi L, Gelles J. Measurement of lactose repressor-mediated loop formation and breakdown in single DNA-molecules. Science. 1995;267:378–80. doi: 10.1126/science.7824935. [DOI] [PubMed] [Google Scholar]
- 12.Lia G, Bensimon D, Croquette V, Allemand JF, Dunlap D, Lewis DEA, Adhya SC, Finzi L. Supercoiling and denaturation in gal repressor/heat unstable nucleoid protein (HU)-mediated DNA looping. Proc Natl Acad Sci USA. 2003;100:11373–7. doi: 10.1073/pnas.2034851100. [DOI] [PMC free article] [PubMed] [Google Scholar]
- 13.Han L, Garcia HG, Blumberg S, Towles KB, Beausang JF, Nelson PC, Phillips R. Concentration and length dependence of DNA looping in transcriptional regulation. PLoS ONE. 2009;4:e5621. doi: 10.1371/journal.pone.0005621. [DOI] [PMC free article] [PubMed] [Google Scholar]
- 14.Zurla C, Manzo C, Dunlap D, Lewis DEA, Adhya S, Finzi L. Direct demonstration and quantification of long-range DNA looping by the lambda bacteriophage repressor. Nucleic Acids Res. 2009;37:2789–95. doi: 10.1093/nar/gkp134. [DOI] [PMC free article] [PubMed] [Google Scholar]
- 15.Vanzi F, Broggio C, Sacconi L, Pavone FS. Lac repressor hinge flexibility and DNA looping: single molecule kinetics by tethered particle motion. Nucleic Acids Res. 2006;34:3409–20. doi: 10.1093/nar/gkl393. [DOI] [PMC free article] [PubMed] [Google Scholar]
- 16.Chen YF, Milstein JN, Meiners JC. Femtonewton entropic forces can control the formation of protein-mediated DNA loops. Phys Rev Lett. 2010;104:048391. doi: 10.1103/PhysRevLett.104.048301. [DOI] [PubMed] [Google Scholar]
- 17.McCauley M, Hardwidge PR, Maher LJ, Williams MC. Dual binding modes for an HMG domain from human HMGB2 on DNA. Biophys J. 2005;89:353–64. doi: 10.1529/biophysj.104.052068. [DOI] [PMC free article] [PubMed] [Google Scholar]
- 18.Salomo M, Kroy K, Kegler K, Gutsche C, Struhalla M, Reinmuth J, Skokov W, Immisch C, Hahn U, Kremer F. Binding of TmHU to single dsDNA as observed by optical tweezers. J Mol Biol. 2006;359:769–76. doi: 10.1016/j.jmb.2006.04.006. [DOI] [PubMed] [Google Scholar]
- 19.Maarten C, Noom MC, Navarre WW, Oshima T, Wuite GJL, Dame RT. H-NS promotes looped domain formation in the bacterial chromosome. Curr Biol. 2007;17:R913–4. doi: 10.1016/j.cub.2007.09.005. [DOI] [PubMed] [Google Scholar]
- 20.McCauley M, Zimmerman J, Maher LJ, Williams MC. HMGB binding to DNA: single and double box motifs. J Mol Biol. 2007;374:993–1004. doi: 10.1016/j.jmb.2007.09.073. [DOI] [PMC free article] [PubMed] [Google Scholar]
- 21.Marko JF. Micromechanical studies of mitotic chromosomes. Chrom Res. 2008;16:1233–7. doi: 10.1007/s10577-008-1233-7. [DOI] [PubMed] [Google Scholar]
- 22.Skoko D, Li M, Huang Y, Mizuuchi M, Cai M, Bradley CM, Pease PJ, Xiao B, Marko JF, Craigie R, Mizuuchi K. Barrier-to-autointegration factor (BAF) condenses DNA by looping. Proc Natl Acad Sci. 2006;106:16610–5. doi: 10.1073/pnas.0909077106. [DOI] [PMC free article] [PubMed] [Google Scholar]
- 23.Zhang HY, Marko JF. Maxwell relations for single-DNA experiments: monitoring protein binding and double-helix torque with force–extension measurements. Phys Rev E. 2008;77:031916. doi: 10.1103/PhysRevE.77.031916. [DOI] [PubMed] [Google Scholar]
- 24.Dodd IB, Perkins AJ, Tsemitsidis D, Egan JB. Octamerization of λCI repressor is needed for effective repression of PRM and efficient switching from lysogeny. Genes Dev. 2001;15:3013–22. doi: 10.1101/gad.937301. [DOI] [PMC free article] [PubMed] [Google Scholar]
- 25.Dodd IB, Shearwin KE, Perkins AJ, Burr T, Hochschild A, Egan JB. Cooperativity in long-range gene regulation by the λCI repressor. Genes Dev. 2004;18:344–54. doi: 10.1101/gad.1167904. [DOI] [PMC free article] [PubMed] [Google Scholar]
- 26.Koblan KS, Ackers GK. Site-specific enthalpic regulation of DNA-transcription at bacteriophage lambda OR. Biochemistry. 1992;31:57–61. doi: 10.1021/bi00116a010. [DOI] [PubMed] [Google Scholar]
- 27.Anderson LM, Yang H. DNA looping can enhance lysogenic CI transcription in phage lambda. Proc Natl Acad Sci USA. 2008;105:5827–32. doi: 10.1073/pnas.0705570105. [DOI] [PMC free article] [PubMed] [Google Scholar]
- 28.Finzi L, Dunlap D. Single-molecule studies of DNA architectural changes induced by regulatory proteins. Methods Enzymol. 2003;370:369–78. doi: 10.1016/S0076-6879(03)70032-9. [DOI] [PubMed] [Google Scholar]
- 29.Marko JF, Siggia ED. Driving proteins off DNA using applied tension. Biophys J. 1997;73:2173–8. doi: 10.1016/S0006-3495(97)78248-1. [DOI] [PMC free article] [PubMed] [Google Scholar]
- 30.Strick TR, Charvin G, Dekker NH, Allemand J-F, Bensimon D, Croquette V. Tracking enzymatic steps of DNA topoisomerases using single-molecule micromanipulation. C R Physique. 2002;3:595–618. [Google Scholar]
- 31.Dunlap D, Zurla C, Manzo C, Finzi L. Probing DNA topology using tethered particle motion. 2010. submitted. [DOI] [PMC free article] [PubMed] [Google Scholar]