

Abstract
Native membrane sarcoplasmic reticulum (SR) Ca2+-ATPase isolated from skeletal muscle (SERCA1) exhibits oligomeric kinetic behavior (Mahaney, J.E., Thomas, D.D., and Froehlich, J.P. (2004) Biochemistry 43:4400–4416). In the present study we used quenched-flow mixing, electron paramagnetic resonance (EPR) and chemical cross-linking to probe for intermolecular interactions at physiological (0.1M) and high (0.4 M) KCl. Exposure SR membranes to water- and lipid-soluble cross-linking reagents revealed a mixture of SERCA1 oligomeric species consisting mainly of dimers and trimers. Titration of iodoacetamide spin labeled-SERCA1 with AMPPCP in the presence of 10 µM Ca2+ and 0.1 M KCl revealed high (KD = 45 µM) and low affinity (KD = 315 µM) nucleotide binding sites in a 2:1 ratio, respectively. Raising the [KCl] to 0.4 M increased the fraction of weak binding sites and lowered the KD of the high affinity component (20 µM). Phosphorylation by 10 µM ATP at 21°C and 0.1 M KCl produced an early burst of Pi production without a corresponding decline in the steady state phosphoenzyme (EP) level. The steady state EP level was twice as large as the Pi burst and received equal contributions from E1P and E2P. Chasing the phosphoenzyme at 0.4 M KCl and 2°C with ADP revealed a biphasic time course of E1P formation with a slow phase that matched the kinetics of the transient EPR signal from the spin-labeled Ca2+-ATPase. The absence of a fast component in the EPR signal excludes E1P as its source. Instead, it arises from the slow, KCl-dependent transformation at the start of the cycle which controls the formation of downstream intermediates with an increased mole fraction of rotationally restricted probes. We modeled this behavior with a SERCA1 trimer in which the formation of E1P/E2/E2P from E1ATP/E2P/E1P results from concerted transformations in the subunits coupling phosphorylation (E1ATP → E1P + ADP) to dephosphorylation (E2P → E2 + Pi) and the conversion of E1P to E2P.
The sarcoplasmic reticulum (SR) Ca2+-ATPase from skeletal muscle (SERCA1) utilizes the energy derived from ATP hydrolysis to transport Ca2+ into the SR against a concentration gradient. Resolution of the crystal structure of SERCA1 in the E1 and E2 conformational states by Toyoshima (1, 2) has facilitated correlation of the biochemical reactions of the Ca2+-ATPase with changes in its atomic and molecular structure associated with unidirectional Ca2+ transport. Despite these recent advances, controversy remains concerning the Ca2+ transport mechanism, and in particular the functional transport unit of the Ca2+ pump.
The Ca2+-ATPase is generally thought to operate as a monomer, fully competent and independent of its neighbors. However, this view has been challenged by reports from several laboratories identifying the skeletal muscle SR Ca2+ pump as a Ca2+-ATPase oligomer (3 and references therein). Indeed, transient state kinetic studies have uncovered several features of the enzymatic behavior of native membrane SERCA1 contradictory to the monomer hypothesis. The crystal structure reveals the presence of one nucleotide binding site (1, 4), whereas variation of [ATP] in the micromolar range has been shown to influence the kinetic behavior of several of the enzymatic reactions down-stream from phosphorylation, including the phosphoenzyme transition (5, 6), E2P hydrolysis (7, 8) and the conversion of E2 to E1 (7, 9). ATP has also been shown to modulate the transport stoichiometry of the pump, shifting the ratio from 1 Ca2+ transported per ATP hydrolysed at low (1–10 µM) ATP to 2:1 at high (>100 µM) ATP (10). Although the reaction mechanism contains multiple acid-stable phosphoenzyme intermediates, their consecutive relationship predicts monophasic kinetics of phosphoenzyme formation by ATP and monophasic dephosphorylation kinetics when re-phosphorylation is prevented by Ca2+ chelation with EGTA. In contrast, phosphorylation of Ca2+-equilibrated native SERCA1 by ATP produces biphasic kinetics at 2°C (11–13), while dephosphorylation with EGTA also yields a biphasic pattern of EP decay (14, 15) which becomes monophasic following solubilization with the monomer-forming detergent, C12E8 (3, 16). This behavior is consistent with the presence of parallel catalytic pathways in an oligomer in which out-of-phase coupling of the subunits delays the onset of a reaction in one subunit relative to that in its neighbor (3, 11–13, 15, 16, 17).
From the consecutive relationship between E1P and E2P, ADP-sensitive E1P is expected to reach its maximum level in the pre-steady state and then decline while the ADP-insensitive E2P shows the opposite behavior, becoming the predominate phosphorylated intermediate in the steady state. By contrast, when ADP was used to chase the phosphoenzyme at 2°C we found that E2P exceeded E1P in the pre-steady state and then rapidly declined, becoming equimolar with E1P as the reaction entered the steady state (3). In the context of the conventional E1, E2 Ca2+-ATPase linear (monomeric) reaction mechanism this behavior implies that the transformation of E1P to E2P is very fast initially, but then dramatically slows down allowing E1P to accumulate in the steady state. The absence of a unique value for the rate constant controlling the E1P→ E2P transition means that the conventional model fails the test for consistency and that modification of this scheme is necessary to render the transition rate constant time-invariant. Finally, the conventional linear consecutive model failed to reproduce quantitatively the time courses of both phosphoenzyme formation and inorganic phosphate (Pi) release measured at 21°C (3). The data show that the decay of the phosphoenzyme overshoot and the Pi burst occur at the same time; however, the size of the Pi burst is much larger than EP decay. We were unable to resolve this problem by increasing the rate of the back reaction for E2P hydrolysis or by adding additional intermediates to the reaction mechanism (3).
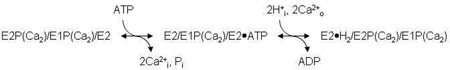
In our previous studies (3, 13, 17, 18), we considered various dimer schemes, culminating in the model shown in Fig.1 (3), which consists of two linear pathways coupled together so that the subunits maintain an out-of-phase relationship. This model greatly improved our ability to simulate the kinetic data outlined above, including the biphasic time courses of EP formation and dephosphorylation, and the inverted time dependence of E1P and E2P formation in the pre-steady and steady states. However, as in the monomer simulations, the dimer model failed to reproduce quantitatively the amplitude of the Pi liberation burst while maintaining the observed steady-state EP level. It became clear that a modification of the model was needed that would allow for simultaneous phosphorylation of one subunit and dephosphorylation of another, producing the observed Pi burst while preventing the decay of the EP overshoot.
Fig. 1.

Dimer model of the skeletal SR Ca2+-ATPase (SERCA1). The model consists of parallel catalytic pathways constrained to out-of-phase (asynchronous) cycling by conformational coupling between the subunits. The subunits oligomerize forming an asymmetric E2/E1 dimer in which the right-hand (leading) subunit completes the reactions of the catalytic cycle ahead of the left-hand (lagging) subunit. Completion of steps 1–4 produces an asymmetric phosphorylated 2dimer, E1P/E2P, which accumulates because of slow dephosphorylation in the subsequent step. The steady state portion of the cycle (steps 5–7) regenerates the product of step 3, completing the loop. Rate constants assigned to the reactions represent values obtained from quenched-flow experiments conducted at 2°C and 0.1 M KCl (3). ADP-sensitive phosphoenzyme (E1P) inside the box is associated with the transient EPR signal that arises from the weakly-immobilized spin label fraction in [2H]IASL-Ca2+-ATPase. Rapid turnover (>500 s−1) of E1P in the leading subunit explains the failure to detect its corresponding EPR signal.
In the present study we have addressed the issue of the quantitative discrepancy between the decay of the overshoot and the Pi burst amplitude by considering a model consisting of three interacting SERCA1 subunits. Support for this model was provided by chemical cross-linking studies, which demonstrated the presence of Ca2+-ATPase trimers under cycling and non-cycling conditions, and by AMPPCP titration experiments revealing the presence of high and low affinity nucleotide binding sites in a 2:1 ratio at physiological (0.1 M) KCl. We show here that the SERCA1 trimer model faithfully reproduces of all the kinetic data in our previous studies. By enabling out-of-phase conformational coupling of the subunits in the oligomeric complex, the trimer facilitates inter-subunit free energy transfer (15), accelerating slow steps (E2P hydrolysis) at the expense of faster reactions (E1ATP → E1P; E1P → E2P). This leads to an improvement in the overall catalytic efficiency, increasing the velocity of Ca2+ transport in the presence of an increasing concentration gradient.
MATERIALS AND METHODS
Reagents
The iodoacetamide spin label, N-(1-oxyl-2,2,6,6-tetramethyl-4-piperidinyl) iodoacetamide ([2H]IASL), was a gift from Dr. Albert Beth (Vanderbilt University). The non-hydrolyzable ATP analog, AMPPCP, was obtained from Sigma. Chemical cross-linking reagents, dithiobis(succinimidyl)propionate (DSP) and sulfosuccinimidyl-4-(N-maleimidomethyl) cyclohexane-1-carboxylate (sulfo-SMCC) were from Pierce. SERCA1 monoclonal antibody (MA3-912) was from Affinity Bioreagents. All other reagents, obtained from various sources, were analytical grade and the highest purity available.
Enzyme Preparation and Assays
Sealed sarcoplasmic reticulum (SR) membrane vesicles containing Ca2+-ATPase (SERCA1 isoform) were prepared from the back and hind leg fast twitch skeletal muscle of New Zealand white rabbits as previously described (13). Typically these vesicles were >95% right-side-out and contained 5–6 nmol Ca2+-ATPase (SERCA1)/mg of SR protein with maximal levels of ATP-dependent phosphorylation of 3.5–4.0 nmol/mg SR protein. Protein concentrations were determined by the biuret assay (19) using BSA as standard.
Spin Labeling the Ca-ATPase
The internal dynamics of the Ca-ATPase were monitored using the perdeuterated iodoacetamide spin label, N-(1-oxyl-2,2,6,6-tetramethyl-4-piperadinyl)iodoacetamide ([2H]IASL), covalently bound to the ATPase (13) specifically at Cys-674 (20). Briefly, SR vesicles were suspended to 10 mg/ml in 0.3 M sucrose, 20 mM MOPS, pH 7.0 (henceforth denoted sucrose buffer), and pre-labeled with 0.1 mM N-ethyl maleimide for 30 minutes at 25°C to block fast reacting sulfhydryl groups. Next, 0.2 mM [2H]IASL was added to the suspension. Following a three hour incubation at 25°C, the sample was diluted with ice-cold sucrose buffer, and unbound label was removed by washing the vesicles three times in sucrose buffer, pH 7.0, by centrifugation at 100,000g for 30 min at 4°C. After the last wash, the SR vesicles containing spin-labled Ca2+-ATPase ([2H]IASL-Ca2+-ATPase) was resuspended to about 20 mg/ml in sucrose buffer, pH 7.0, and stored frozen in liquid nitrogen until use. The stoichiometry of label incorporation was 0.75 ± 0.1 mol IASL per mole of Ca-ATPase [assuming 7 nmol Ca-ATPase/mg SR (13)]. The effects of spin labeling on enzyme activity and the spectral characteristics of the spin-labeled enzyme have been described previously (13).
EPR Spectroscopy
Conventional and transient EPR spectra were acquired using a Bruker ESP 300 spectrometer equipped with a bruker ER4102 ST cavity (TE102), and digitized with the spectrometer's built-in microcomputer using Bruker OS-9-compatible ESP 1620 spectral acquisition software. Conventional EPR spectra were obtained using 100-kHz field modulation (with a peak-to-peak modulation amplitude of 2 G), with a microwave field intensity (H1) of 0.14 G, determined from peroxylamine disulfonate calibrations (21). Transient EPR spectra were obtained under the same conditions except that the peak-to-peak modulation amplitude was set to 5 G. Conventional EPR spectra were acquired using a 100 G sweep-width with a 164 ms dwell-time and a 164 ms time constant. Transient EPR spectra were obtained at a single field position (sweep width 0 G), defined by the restricted component in the low-field peak of the [2H]IASL-SR spectrum (13), using a 10 ms filter time constant and a 10 ms dwell time. The sample concentration was 10 mg SR/ml in all the EPR experiments. All EPR samples were contained in a 20 µl well on a home-made gas permeable KEL-F cover plate affixed to a no-well quartz-Suprasil tissue flat cell (Wilmad, Buena, NJ). The sample temperature was controlled to within 0.5°C with a Bruker ER 4111 variable temperature controller. Sample temperature was monitored using a Sensortek Bat-21 digital thermometer with an IT-21 thermocouple attached to the side of the of the sample holder. All spectra were recorded at 2°C.
Caged ATP was photolyzed during EPR experiments using a single 10 ns flash at 351 nm from a XeF excimer laser (LPX200i, Lambda Physik, Acton, MA). The light was introduced directly to the sample through an optical port on the front of the EPR cavity. The dimensions of the KEL-F sample well were the same as the optical port on the EPR cavity, such that the entire sample was uniformly exposed to the laser flash. Light energy incident on the sample was ~150 mJ/cm2 for a single pulse, and typically resulted in 10% conversion of caged ATP to ATP. Samples were exposed to only one laser flash each, in order to prevent complications from product build-up. The EPR transients from a series of identical samples (n = 9 to 25) were averaged, in order to produce transients with sufficient signal-to-noise for curve fitting and analysis. Additional details and control experiments for the caged ATP photolysis experiments have been presented previously (13).
EPR Spectral Analysis
Conventional EPR spectra were analyzed on a personal computer with software developed by Roberta Bennett. EPR transients were fit to a lag function:
| eq. 1 |
using the program (KFIT) written by N.C. Millar, which was originally obtained from Dr. Carl Frieden. The fit yielding the highest correlation coefficient, R, was selected. Conventional EPR spectra were normalized to the same number of spins by dividing each spectrum by its double integral. Transient EPR spectra were normalized for modulation amplitude and to the same number of spins by dividing by the double integral of the corresponding conventional EPR spectrum obtained prior to caged ATP photolysis.
Spectra subtractions were performed as described by Lewis and Thomas (22) with modifications by Mahaney et al. (13). The control spectrum of [2H]-IASL-Ca2+-ATPase in buffer was chosen as one end point (designated the mobile component), and the other end point (designated the restricted component) was reached by subtracting the mobile component from the composite spectrum ([2H]-IASL-Ca2+-ATPase in standard buffer + nucleotide) in fractional increments: C − fM × M = R, where C, M, and R denote the composite, mobile, and restricted spectra, respectively, and fM is the mole fraction of the mobile component. The restricted component endpoint was reached when the low field peak of the difference spectrum was symmetrical. The mole fraction of the restricted component (fR) is simply 1−fM. Further details about the spectral subtraction procedure, including the assumptions made, are discussed in Lewis and Thomas (22).
ATP-dependent Phosphoenzyme (EP) Formation and Pi Liberation
One- and two-stage rapid mixing studies were performed as described by Mahaney et al. (13) using a chemical quenched-flow apparatus (23). Measurements were carried out at room temperature (21 ± 0.5°C) or at 2 ± 0.5°C by moving the apparatus into a cold room. The enzyme- and substrate-containing syringes both contained 5 mM MgCl2, 0.45 mM CaCl2, 0.5 mM EGTA, 20 mM MOPS, pH 7.0, (standard buffer) and either 0.1 M or 0.4 M KCl as indicated. The reaction was initiated by mixing SR vesicles (0.5 mg/mL) with an equal volume of the substrate medium containing either 20 µM or 200 µM [γ32P]ATP. After a variable time delay (4–800 ms) the reaction was quenched by the addition of 3% perchloric acid + 3 mM KH2PO4 (final concentrations) and analysis of the [32P]phosphoenzyme and [32P]Pi in the quenched reaction mixture carried out as previously described (13, 17). [32P]phosphoenzyme in the washed protein pellet and [32P]Pi in the supernatant (after separation from the unhydrolyzed [γ32P]ATP) were determined by liquid scintillation counting of the Cerenkov radiation in the samples dissolved in 1 M NaOH.
Dephosphorylation of the Phosphoenzyme by ADP
Two-stage rapid mixing experiments, in which the Ca2+-ATPase was initially mixed with ATP to phosphorylate the enzyme and then mixed with ADP to dephosphorylate the phosphoenzyme, were used to evaluate the time dependence of the ADP-sensitive (E1P) and ADP-insensitive (E2P) phosphoenzymes at 2°C and 21°C (3, 17). In a typical experiment, the Ca2+-ATPase was incubated with 100 µM [γ32P]ATP for a constant time interval (10, 116 and 223 ms; 30 s) after which 5 mM ADP (final concentration: 1.66 mM) was added and the reaction allowed to proceed for an additional variable (0–540 ms) time interval before quenching with perchloric acid. The conditions for phosphorylation were as described in the single-stage mixing experiments, except that KCl was present in all of the media (enzyme, substrate, ADP chase) at a concentration of 0.4 M. Incubation with ATP for 30 s was done by mixing SR vesicles and ATP manually at 2°C and then loading the reaction mixture into the machine prior to mixing it with ADP and quenching it with acid. Analysis of the [32P]phosphoenzyme and [32P]Pi in the quenched reaction mixture was carried out as above.
Curve Fitting and Kinetic Modeling
Binding of AMPPCP to SERCA1 was evaluated from the amplitude of the EPR signal corresponding to the mole fraction of rotationally restricted probes as a function of AMPPCP concentration. The titration data were fitted using one- and two-component binding equations:
| eq. 2 |
| eq. 3 |
where fR (L) is the mole fraction of rotationally restricted probes as a function of the ligand (L = AMPPCP) concentration, A and (1−A) are amplitude coefficients, and K1 and K2 are the apparent AMPPCP binding affinities. The quality of the fit was evaluated from the sum-of-squares error between the actual and fitted points with the SOS error becoming smaller as the fit improved.
Evaluation of the kinetics of formation of the ADP-sensitive (E1P) and ADP-insensitive (E2P) phosphoenzymes was carried out by fitting the time course of ADP-induced dephosphorylation measured at different phosphorylation times with a multi-exponential decay function (3, 24):
| eq. 4 |
The first and second terms correspond to the dephosphorylation of E1P and E2P, respectively, while the third term represents turnover of a very stable phosphoenzyme in a pathway parallel to the main catalytic pathway. Because of the very slow hydrolysis of this species, it was treated as a constant term (A3) during curve fitting. As noted previously (3), the rate constant for dephosphorylation of E1P, k1, is not well-defined because transmigration of the phosphoryl group from the catalytic site to ADP may occur following the acid quench. Instead, we were only able to clearly resolve the kinetics of the second and third phases of EP decay, which, unlike the initial phase, were associated with stoichiometric Pi production. The absence of significant Pi production during the fast phase implies that it corresponds to reversal of phosphorylation, E1P•ADP → E1ATP, following ADP binding to E1P. That ATP dissociation from the nucleotide binding site does not control the kinetics of the slow phase (25) is excluded by the stoichiometric relationship between Pi release and phosphoenzyme decay following the initial phase of dephosphorylation.
Two basic kinetic models, monomeric and oligomeric, were used to simulate time-dependent EP and Pi formation measured in the single-stage quenched-flow experiments at 2°C and 21°C. The monomer scheme is a simplified version of the Albers-Post model consisting of 5 intermediate states as previously described (3). The kinetic model is described by a set of 6 differential equations and a conservation equation relating the total enzyme concentration, [ETOTAL], to the sum of the concentrations of the intermediates. The back reactions for ADP and Pi release were neglected because product formation during the initial stages of ATP hydrolysis was considered negligible. With the exception of ATP binding and E2P hydrolysis (E2P ↔ E2•Pi), each of the reactions was treated as being irreversible using values for the rate constants, ki and k−i, obtained from the literature (3, 7, 14). The trimer model used in simulating EP and Pi formation in native SERCA1 at 2°C and 21°C is presented in Fig. 4 (see Results). The simulation routines in MLAB (24) were used to fit the trimer model to these data by simultaneously solving the 8 differential equations and conservation equation derived from this scheme. The reaction pathway catalyzed by the Ca2+-ATPase tri-protomer includes 7 intermediate states beginning with an initial complex, E1/E1/E2, in equilibrium (step 1) with a non-phosphorylated species, E1/E2/E2 (at 0.1 M KCl) or E2/E2/E2 (at 0.4 M KCl). The pre-steady state portion of the cycle (steps 2–6) is completed upon the release of Pi from E2P/E1P/E2, while the conversion of E2ATP to E1P rate-limited by the conversion of E2 back to E1 (step 7) comprises the steady state portion of the catalytic cycle. Rate constants for this scheme were evaluated by simulation of phosphoenzyme (EP) formation and Pi release at 21°C assuming that all the reactions are irreversible with the exception of the initial KCl-dependent equilibria in step 1 and ATP binding in step 2. For simulation of phosphorylation and E1P formation at 0.4 M KCl and 2°C using the trimer model (Fig. 5B), the rate constants for reactions 6 and 7 were assigned a value of zero because the rate of hydrolysis of E2P at 2°C is very slow (0.2 s−1) (13). This approximation was also used when applying the dimer model to the data in Fig. 5A. To account for the biphasic time course of phosphorylation at 0.4 M KCl, the dimer scheme in Fig. 1 was modified to include an additional reaction at the start of the cycle in which E2/E2, stabilized by high [KCl], is slowly converted E2/E1.
Fig. 4.

Trimer model of the skeletal SR Ca2+-ATPase (SERCA1). The trimer model for SERCA1 differs from the dimer scheme in Fig. 1 by including a third parallel catalytic pathway and an initial KCl-dependent reaction (E1/E2/E2 ↔ E1/E1/E2 at 0.1 M KCl; E2/E2/E2 ↔ E1/E1/E2 at 0.4 M KCl) that is rate-limiting for the slow phase of phosphorylation. A detailed description of the trimer model and its applications are in the Results. The simulation routines in MLAB were used to fit the trimer model to phosphoenzyme formation and Pi release measured at 2°C and 0.4 M KCl (Fig. 5B) and 21°C and 0.1 M KCl (Fig. 2B), and to evaluate rate constants for the intermediate reactions under these conditions. Initial conditions for the simulations and best fit parameters are given in the figure legends.
Fig. 5.

Phosphorylation, E1P formation, and the weakly-immobilized EPR signal in SERCA1 at 2°C and 0.4 M KCl. (A) The dimer model of SERCA1 in Fig. 1 was modified to include an initial step (1) in which E2/E2 (non-phosphorylated species) is converted to E2/E1 (phosphorylated species) by a slow (4 s−1), [KCl]-dependent reaction. By adding this step, reactions 1–7 in Fig. 1 become reactions 2–8. As a simplifying approximation, the rate constant controlling the hydrolysis of E2P in E1P/E2P (k6) has been assigned a value of zero because of the very slow turnover of this intermediate at 2°C (). For EP formation (filled squares), SR vesicles (.25 mg/ml) were phosphorylated by 100 µM [γ32P]ATP in standard buffer containing 0.4 M KCl. Filled circles represent E1P formation evaluated from the ADP chase experiments conducted at 10, 116 and 223 ms in Fig. 6. Open circles represent E1P formation calculated from the level of phosphorylation at different time intervals (filled squares) and the assumption that E1P is 50% of EPTOTAL. At time zero, approximately 100 µM ATP was generated by laser flash photolysis from 1 mM caged ATP, and the resulting EPR transient representing the buildup of a rotationally restricted spin label fraction monitored over time. The modified dimer scheme was used to simulate phosphorylation (filled squares), E1P accumulation (filled and open circles) and the transient EPR signal (filled triangles) using the simulation routines in MLAB and the following set of rate constants (in s−1/s−1): k1/k−1 = 4/4; k2/k−2 = 350/0; k3/k−3 = 70/0; k4/k−4 = 500/0; k5/k−5 = 4/0; k6/k−6 = 0/0. Initial conditions (in nmol/mg): [ETOTAL] = 3.8; [E2/E2] = 1.9; [E2/E1] = 1.9. The amplitude of the time-resolved EPR signal has been adjusted so that the simulated EPR signal coincides with the simulated time course of E1P formation. (B) The trimer model in Fig. 4 was used to simulate phosphorylation (filled squares), E1P formation (filled and open circles) and the transient EPR signal (filled triangles) using the MLAB simulation routines and the following set of rate constants (in s−1/s−1): k1/k−1 = 4/4; k2/k−2 = 350/0; k3/k−3 = 70/0; k4/k−4 = 500/0; k5/k−5 = 400/0; k6/k−6 = 0/0. The amplitude of the transient EPR signal has been adjusted so that the kinetic similarities in the transient EPR signal and E1P formation are readily apparent.
Intermolecular chemical cross-linking of SERCA1
Rabbit fast-twitch skeletal muscle SR membrane vesicles suspended in storage buffer (0.25 M sucrose, 30 mM histidine, pH 7.0) were washed twice with 20 mM MOPS, pH 7.0, to remove traces of histidine that react with sulfo-SMCC and DSP (26). The reaction was performed with 60 µg of SR protein in 20 µL of medium containing 0.3 M sucrose, 50 mM MOPS, pH 7.0, and either (A) 1 mM EGTA (cross-linking under non-cycling conditions) or (B) 3 mM MgCl2, 0.1 mM CaCl2, 0.1 mM EGTA (yielding a free [Ca2+] ~ 10 µM) and 1 mM ATP (cross-linking under cycling conditions). A stock solution of each cross-linker was freshly prepared prior to use: 25 mM DSP in DMSO and 100 mM sulfo-SMCC in water. The cross-linking reactions were initiated by adding either DSP to 0.5 mM, sulfo-SMCC to 2 mM, or an equivalent volume of vehicle at room temperature and quenched by the addition of 5% SDS after 10 min. Cross-linked protein (1 µg) was added to protein sample buffer containing 5% SDS without dithiothreitol (DTT) and boiled for 5 min prior analysis by western blot. To cleave DSP crosslinks 20 mM DTT was included in the sample buffer. Proteins were separated by SDS-PAGE on a 4–12% Tris-glycine gradient gel, and transferred to PVDF membrane. SERCA1 was detected using a SERCA1-specifc monoclonal antibody as recommended by the manufacturer, using horseradish peroxidase-labeled anti-mouse antibody and a chemiluminescent substrate (Supersignal, Pierce).
RESULTS
Phosphoenzyme Formation and Pi Release at 0.1 M KCl and 21°C
Freshly-prepared SR membrane vesicles from rabbit fast skeletal muscle were used to measure the time courses of phosphoenzyme formation and inorganic phosphate (Pi) release in a quenched-flow apparatus at 10 µM [γ32P]ATP and 21°C (Fig. 2). These vesicles were able to accumulate 45Ca2+ in an ATP-dependent fashion at a velocity approximating that of steady state Pi production as previously described (17) (data not shown). In the presence of 0.1 M KCl, 1 mM MgCl2, 0.1 mM CaCl2, 0.1 mM EGTA (free [Ca2+] = 10 µM) and 20 mM MOPS, pH 7.0, the time course of phosphoenzyme formation (Fig. 2A, filled circles) showed a rapid rise, a small overshoot and a constant level of activity representing steady state phosphorylation. Inorganic phosphate production (open circles) showed an early lag during the rapid phase of phosphorylation, a subsequent burst phase and a linear, steady state phase of activity after 200 ms. These results confirm previously reported behavior (3, 7) in which decay of the phosphoenzyme (EP) overshoot correlated with the pre-steady state Pi burst, but where the Pi burst exceeded the decay of the overshoot. The relationship between the EP overshoot and Pi burst, as well as the initial lag in Pi production during the rapid increase in phosphorylation, support the hypothesis that Pi production arises from the turnover of an obligatory phosphoenzyme intermediate rather than directly from ATP hydrolysis (7).
Fig. 2.

Phosphoenzyme (EP) formation and inorganic phosphate (Pi) release in SERCA1 at 21°C and 0.1 M KCl. A suspension of sealed SR vesicles (0.25 mg/ml) in standard buffer (5 mM MgCl2, 0.45 mM CaCl2, 0.5 mM EGTA, and 20 mM MOPS, pH 7.0) containing 0.1 M KCl was mixed with 10 µM [γ32P]ATP to phosphorylate SERCA1 and quenched at the indicated times with 3% perchloric acid (see Materials and Methods). Simulations of phosphoenzyme formation and Pi release were carried out using 5-state (monomer) and 7-state (trimer; Fig. 4) models and the simulation routines in MLAB. (A) Time courses of EP formation (filled circles) and Pi release (open circles) simulated using a monomer scheme with consecutively numbered (1–5) reactions: E1 + ATP ↔ E1•ATP ↔ E1P + ADP ↔ E2P ↔ E2•Pi ↔ E1 + Pi (). Rate constants for the dashed line simulations (in s−1/s−1): k1/k−1 = 100/35; k2/k−2 = 150/0; k3/k−3 = 500/0; k4/k−4 = 5.5/0; k5/k−5 = 6.5/0. Rate constants for the solid line simulations (in s−1): k1/k−1 = 100/35; k2/k−2 = 150/0; k3/k−3 = 500/0; k4/k−4 = 5.5/14; k5/k−5 = 17.8/0. Initial conditions (t = 0): [E1] = 2.9 nmol/mg and all other intermediates at zero concentration. (B) Same kinetic data simulated using the SERCA1 trimer model (Fig. 4). Initial conditions (t = 0): [E2/E2/E1] = 0.51 nmol/mg; [E1/E1/E2] = 0.91 nmol/mg; [ET] = 2.42 nmol/mg. Rate constants for the solid, dashed and dotted line simulations (in s−1/s−1): k1/k−1 = 85/25; k2/k−2 = 150/0; k3/k−3 = 200/0; k4/k−4 = 500/0; k5/k−5 = 100/0; k6/k−6 = 7/0; k7/k−7 = 7/0. Solid line simulation (filled circles) represents the sum of the phosphorylated intermediates: E1P/E1ATP/E2, E2P/E1ATP/E2, E2P/E1P/E2, and E2/E2P/E1P. Dashed line simulation represents the time course of dephosphorylation of E2P in E2P/E1P/E2 (precursor to step 6) and dotted line the time course of E1P formation in E2/E2P/E1P (product of step 6). The dashed and dotted lines sum to give the solid line (filled circles). Solid line (open circles) represents Pi production resulting from dephosphorylation of E2P in E2P/E1P/E2 (step 6) during the pre-steady state and steady state phases of the reaction.
Dephosphorylation of the Phosphoenzyme by ADP at 0.1 M KCl and 21°C
The relative proportions of E1P and E2P present anytime after the start of phosphorylation can be evaluated by chasing the phosphoenzyme with ADP. When applied over a range of reaction times, the ADP chase experiment allows the kinetics of formation and decay of these phosphoenzyme intermediates to be evaluated (3, 17). The pattern of ADP-induced EP decay consists of a fast phase corresponding to the re-synthesis of ATP from E1P(Ca2)ADP, a secondary slow phase associated with stoichiometric Pi production, and a very slow decay (<1 s−1) representing the hydrolysis of a stable component that lies outside of the main catalytic pathway (17). When the Ca2+-ATPase in sealed SR vesicles was phosphorylated with 10 µM [γ32P]ATP and combined with 1.66 mM ADP to dephosphorylate the enzyme 116 ms later, a 1:1 ratio of fast and slow decay phases was observed followed by a stable component representing ~10% of the total EP (filled circles, Fig. 3). Inorganic phosphate release (open symbols) correlated with the secondary phase of EP decay with respect to both its rate and stoichiometry. This implies that E2P hydrolysis is responsible for EP decay following the disappearance of the ADP-sensitive phosphoenzyme, and that its breakdown is predominately in the direction of E2 + Pi. The 1:1 E1P:E2P ratio observed in this experiment differs from that typically found in ionophore (A23187)-treated vesicles where the ratio is approximately 1:2 (17). This may represent an effect of intravesicular Ca2+ on the poise of the E1P ↔ E2P equilibrium facilitated by the high density of SERCA1 transport sites (6–7 nmol/mg protein) and small excluded volume (1 µL/mg protein) of SR vesicles isolated from skeletal muscle.
Fig. 3.

Dephosphorylation of SERCA1 by ADP at 21°C after 116 ms of phosphorylation in the presence of 0.1 M KCl. SERCA1 in sealed SR vesicles (.375 mg/ml) was phosphorylated with 10 µM [γ32P]ATP as described in the legend to Fig. 2 and then dephosphorylated by the addition of 1.66 mM ADP at time zero. Perchloric acid (3%) was added at the indicated times to terminate phosphoenzyme decomposition (filled circles) and Pi release (open circles) (see Materials and Methods). Pi production following the ADP chase was absent during the fast phase and stoichiometric with phosphoenzyme decay during the slow phase of dephosphorylation.
Simulation of Phosphoenzyme Formation and Pi Release at 0.1 M KCl and 21°C
Extrapolation of steady state Pi production in Fig. 2 to t = 0 shows that the amplitude of the pre-steady state Pi burst is about one-half of the steady state phosphoenzyme level. The burst reflects the rapid pre-steady state accumulation of a dephosphorylated intermediate, E2 or E2•Pi. The Pi burst corresponds in time to the decay of the phosphoenzyme overshoot (7), but in this experiment the overshoot was barely perceptible. The shallow decay suggests that significant resynthesis of E2P occurred from E2•Pi as a consequence of slow turnover of the enzyme-product complex and reversal of hydrolysis. To test whether the reversal of E2P hydrolysis might account for this behavior, we simulated the time courses of EP formation and Pi release using a five-state model in which ATP binding to E1 and E2P hydrolysis to E2•Pi were the only two reversible reactions in the transport cycle (Fig. 2A). As seen in the figure, a quantitative fit to the phosphoenzyme time dependence underestimated the Pi burst as well as the steady state Ca2+-ATPase activity (solid lines). In contrast, when we achieved a quantitative fit to the Pi burst and steady state Ca2+-ATPase activity, the phosphoenzyme overshoot showed a pronounced decay (dashed line), leading to underestimation of the steady state EP level. As we previously reported (3), this behavior cannot be rectified by simply adding additional consecutive phosphorylated intermediates to the reaction mechanism or by making additional steps in the model reversible. Indeed, these steps can help improve the fit of the simulations to the empirical data, such as more closely predicting the poise of the E1P to E2P equilibrium and the reduced decay of the EP overshoot. However, at no time were these modifications sufficient to model the EP overshoot, steady-state EP level, E1P/E2P levels and the magnitude of the Pi burst at the same time. We conclude, as before (3), that the monomer scheme fails to reproduce the observed kinetic behavior and that modification of the Ca2+-ATPase reaction mechanism is necessary.
In the Ca2+-ATPase oligomer model, phosphorylation and E2P hydrolysis are not constrained to a single pathway as they are in the linear consecutive model; instead they can occur in parallel pathways that are out-of-phase and coupled to one another. The concept of oligomeric subunit coupling is illustrated in the Ca2+-ATPase dimer mechanism in Fig. 1 where one subunit (on the right) is ahead of its neighbor in carrying out the Ca2+-ATPase intermediate reactions. This model is unable to reproduce the kinetic behavior in Fig. 2 because it does not include a step in which dephosphorylation of one subunit is simultaneously coupled to phosphorylation of another, a feature that is necessary to generate the sizeable Pi burst while preventing the decay of the EP overshoot. To accomplish this, a third parallel pathway was added:
Here, two of the subunits in the Ca2+-ATPase trimer are phosphorylated and correspond to E1P(Ca2) and E2P(Ca2) as resolved in the ADP chase experiment in Fig. 3. The third subunit is in the unphosphorylated E2 conformation, which binds ATP activating its conversion of E2 to E1 and Ca2+ deocclusion from E2P(Ca2) on the neighboring subunit. Dephosphorylation of E2P following Ca2+ release at the inner membrane surface produces the pre-steady state Pi burst in Fig. 2; this becomes faster as [ATP] is raised reflecting allosteric rate control of Ca2+ de-occlusion in the preceding step. The Pi burst has an amplitude equal to one-half the steady state phosphoenzyme level (Fig. 2) reflecting the fact that it is generated from the hydrolysis of E2P. When E1•ATP binds Ca2+ after the conformational transition, it becomes rapidly phosphorylated, producing E1P(Ca2). This is coupled to E2P hydrolysis on its neighbor, preventing a sharp decline in the EP level as the overshoot decays. The substrate complex, E1•ATP•(Ca2), has a very brief existence prior to phosphorylation, preventing its accumulation during enzyme cycling. In agreement with this, attempts to measure ATP binding to native SERCA1 have failed to demonstrate bound ATP when the enzyme is turning over (K. Taniguchi and J. Froehlich, unpublished observations). This contrasts with situation in the deoxycholate-treated Na+/K+- and gastric H+/K+-ATPases where a significant fraction of bound ATP has been detected during enzyme cycling (27, 28).
To test whether the trimer model can predict the pre-steady state kinetic behavior in Fig. 2, we simulated the time courses of phosphorylation (solid circles) and Pi release (open circles) at 0.1 M KCl and 21°C as shown in Fig. 2B. The trimer model used in these simulations is shown in Fig 4. The starting state, E1/E1/E2, with two of the subunits in the E1 conformation and one in E2, is in equilibrium with E2/E1/E2 at 0.1 M KCl (step 1A). We assumed that KCl tends to stabilize E2, and at 0.4 M KCl, E1/E1/E2 is in equilibrium with E2/E2/E2 (step 1B) in which all 3 subunits are in the E2 conformation. In the presence of Ca2+ the E2 subunits in the mixed oligomers are stabilized by strong, asymmetric intermolecular interactions between the E1 and E2 states, preventing their conversion to E1 driven by high affinity Ca2+ binding. At 0.1 M KCl, the equilibrium in step 1A favors E1/E1/E2 over E2/E1/E2 by ~ 5:1 (k1A/k−1A = 20 s−1/4 s−1), in agreement with the 5:1 ratio of fast:slow phases of phosphorylation at 2°C (13). We assumed that raising the temperature from 2 to 21°C does not perturb this equilibrium, but only increases the forward and reverse rate constants according to a Q10 = 2 relationship (doubling of the rate constant for each 10°C rise). After E1(Ca2)/E1(Ca2)/E2 and E1(Ca2)ATP/E1(Ca2)/E2 bind ATP (steps 2 and 3), the liganded subunits are rapidly phosphorylated (steps 3 and 5), contributing the fast phase of phosphorylation in the pre-steady state. In between these steps, E1P(Ca2) in E1P(Ca2)/E1(Ca2)ATP/E2 is very rapidly (≥ 500 s−1) converted to E2P(Ca2) (step 4), generating the mixed (ADP-sensitive and ADP-insensitive) intermediate state, E2P(Ca2)/E1P(Ca2)/E2, following phosphorylation of the second subunit. The subsequent slow phase of phosphorylation, representing ~20% of the total enzyme sites, is rate-limited by the conversion of E2/E2/E1(Ca2) to E2/E1(Ca2)/E1(Ca2) in step 1A, which has an estimated rate constant of 80 s−1 at 21°C (k1A = 20 s−1 → 80 s−1 by raising the temperature from 2 to 21°C). We found that it was necessary to increase k1A from 80 to 85 s−1 to obtain a good fit to the secondary phase of phosphorylation in Fig. 2B using plausible values for ATP binding (1.5–2.0 × 10⁷ M−1s−1) and phosphorylation (150–200 s−1) at 21°C (3, 7). All of the steps (1–5) leading to E2P(Ca2)/E1P(Ca2)/E2 are fast, whereas turnover of this species (step 6) is slow, leading to its accumulation in the steady state (Fig. 2B). As discussed above, the conversion of E2 to E1 in the unphosphorylated subunit controls the rate of turnover of this species, and at 10 µM ATP this step has a rate constant of 7 s−1. This slow transition, which controls the rate of Pi production in the burst phase, is followed by another slow (7 s−1) reaction (step 7), which controls the linear phase of Pi production following the burst. The product of step 6 differs from that of step 5 by having 2 protons bound to the E2 state, which are counter-transported during Ca2+ uptake (29). These protons, which are bound after Ca2+ is released, are translocated from the internal compartment to the cytoplasm by a slow reaction (step 7) that is accelerated by ATP binding to E2•H2. Thus, raising the [ATP], in addition to increasing the apparent rate of phosphorylation, accelerates Pi liberation in the burst and subsequent linear (steady state) phases as originally demonstrated in quenched-flow experiments with SR vesicles isolated from rabbit fast skeletal muscle (7). Taken together, we found the trimer model (Fig. 4) was sufficient for simulating the observed EP formation and Pi time courses (solid lines), while simultaneously accounting for the observed steady-state E1P and E2P levels (Figure 2B).
Phosphoenzyme Formation and ADP-dependent Dephosphorylation at 0.4 M KCl and 2°C
We previously showed (13) that phosphoenzyme formation at 2°C is biphasic and that the biphasic pattern is accentuated by raising the KCl concentration to 0.4 M, as originally demonstrated by Ikemoto et al. (12) using choline chloride. Fig. 5 shows the time course of phosphoenzyme formation (filled squares) obtained by mixing 100 µM ATP with SR membrane vesicles (0.25 mg/ml) suspended in 5 mM MgCl2, 0.45 mM CaCl2, 0.5 mM EGTA, 20 mM MOPS, pH 7.0, and 0.4 M KCl at 2°C. At the indicated times the reaction was quenched with strong acid (3% perchloric acid) and the [32P]-phosphoenzyme assayed. Two distinct phases of phosphorylation in a 1:1 ratio were observed with a fast phase rate constant of ~ 70 s−1 and a slow phase rate constant of ~ 4 s−1. The transient state EPR signal (closed triangles, experiment described below) obtained under identical conditions using SERCA1 labeled with [2H]IASL spin label at cysteine 674 (13) has a rate constant (5 ± 0.5 s−1) that matches the slow phase of phosphorylation (4 ± 0.5 s−1). Lowering the [KCl] from 0.4 to 0.1 M shifts the distribution of fast:slow components from 1:1 to 4:1, and this is accompanied by an increase in the rate constant for the slow phase (4 to 20 s−1) without changing the kinetics of the fast phase (70 s−1) (13). At 0.1 M KCl the transient EPR signal has a rate constant of 21 s−1 (13), in good agreement with the slow phase of phosphorylation measured under those conditions. These experiments show that the reaction that is rate-limiting for the secondary phase of phosphorylation also controls the kinetics of the conformational change detected by the EPR spin label.
To monitor time-dependent changes in the distribution of ADP-sensitive and ADP–insensitive phosphoenzymes during the fast and slow phases of phosphorylation at 0.4 M KCl, we ran a series of ADP chase experiments at 2°C in which the enzyme was phosphorylated with 100 µM ATP for a constant time interval and then dephosphorylated with 1.66 mM ADP for a variable interval prior to quenching with acid. As seen in Fig. 6, chasing the phosphoenzyme with ADP after the addition of ATP resulted in a triphasic time course of EP decomposition, similar to that described in Fig. 2. When chased with ADP after 10 ms of phosphoenzyme formation, the rapid phase of EP decay (disappearance of E1P by re-synthesis of ATP) accounted for only 15% of the phosphoenzyme, whereas the secondary phase of EP decay (disappearance of E2P with concomitant stoichiometric Pi production) was the predominant phosphorylated intermediate, accounting for 85% of the phosphoenzyme. As described above, the stable phosphoenzyme species with the very slow turnover rate was subtracted from the total acid-stable phosphoenzyme prior and excluded from further analysis, since this species is not kinetically competent and not part of the main catalytic pathway (2, 17).
Fig. 6.

Dephosphorylation of SERCA1 by ADP after 10, 116 and 223 ms of phosphorylation at 2°C and 0.4 M KCl. SERCA1 in sealed SR vesicles (.375 mg/ml) suspended in standard buffer containing 0.4 M KCl, was phosphorylated by 100 µM [γ32P]ATP at 2°C. After 10 ms (filled circles), 116 ms (filled diamonds), or 223 ms (filled squares), a chase containing 1.66 mM ADP was added to dephosphorylate the enzyme and the reaction allowed to proceed for the indicated times before quenching with acid (see Materials and Methods). Dashed line approximates the time course of phosphorylation (filled squares) in Fig. 5. Inset shows the time course of dephosphorylation produced by chasing with 1.66 mM ADP 30 s after the start of phosphorylation. Brackets indicate the amount of E1P and E2P revealed by chasing with ADP after 116 ms of phosphorylation.
Additional ADP chase experiments were carried out 116 ms, 223 ms and 30 s after initiating phosphorylation with 100 µM ATP, as shown in Fig. 6. At these later times of EP formation, the fractional amounts of E1P and E2P present were approximately equal at a 1:1 relationship (Fig. 6). Between 675 ms and 30 s the maximum EP level fell from ~ 3.5 nmol/mg (Fig. 5) to 2 nmol/mg (inset, Fig. 6) as a consequence of substrate utilization and product accumulation during the interval prior to adding the ADP chase. The fractional amount of E1P measured at each of these time points is plotted in Fig. 5 (filled circles) for comparison with the time courses of the total acid-stable phosphoenzyme (filled squares) and the transient EPR signal (filled triangles). The open circles represent the estimated fraction of E1P, assuming that EP accumulating in the slow phase of phosphorylation is distributed equally between E1P and E2P, as suggested in the ADP-chase experiments. This approximation is valid for reaction times ≥116 ms, but between 10 ms and 116 ms there is a gap in the ADP chase data during which the fraction of E1P increased from 15% to 50%. This increase in E1P, which was also observed at 0.1 M KCl and 2°C (3), conflicts with the predicted behavior of the conventional monomeric E1–E2 reaction mechanism in which the fraction of E1P decreases with increasing phosphorylation time.
The time course of phosphorylation and ADP-sensitive phosphoenzyme (E1P) formation measured at 0.4 M [KCl] and 2°C were modeled using dimer (Fig. 1) and trimer (Fig. 4) models of SERCA1 as shown in Figs. 5A & B. In these simulations we have ignored Pi production, which was barely detectable at 2°C (3) in agreement with the slow rate (0.2 s−1) of E2P hydrolysis revealed by chasing with EGTA (13). For simulating these data, the dimer scheme in Fig. 1 was modified to include a slow, [KCl]-dependent reaction at the start of the cycle (see Materials and Methods) to accommodate the biphasic pattern of phosphorylation in Fig. 5. In addition, phosphorylation of the delayed subunit at step 4 was assumed to be KCl-sensitive to allow for the slow (4 s−1) accumulation of E1P/E2P associated with the transient EPR signal at 0.4 M KCl. The leading subunit (E1) in E2/E1 is ahead of its neighbor in carrying out the catalytic reactions of the Ca2+ pump and binds ATP and becomes phosphorylated (step 2) at a rate commensurate with the fast phase of phosphorylation (70 s−1). Almost as soon as E1P is formed, and before the delayed (E2) subunit is phosphorylated, E1P is converted to E2P; this is assumed to occur very rapidly (400–500 s−1) to account for the observation that E2P is the predominant phosphoenzyme (85%) in the fast phase of phosphorylation. In the next step (step 4), the delayed subunit is phosphorylated, generating an asymmetric E1P/E2P complex that hydrolyzes slowly (0.2 s−1) releasing Pi. The slow turnover of this species leads to its accumulation, accounting for the 1:1 distribution of the ADP-sensitive and ADP-insensitive phosphoenzymes in the steady state (3). To simulate the kinetic behavior in Fig. 5A, it was necessary to assign the rate constant for phosphorylation of the delayed subunit a value = 4 s−1. This reproduced the slow phase of phosphorylation and generated a time course for E1P formation that coincided with the transient EPR signal (filled triangles, Fig. 5A). When phosphorylation is maximal (~675 ms), the simulated and actual E1P levels are in good agreement; however, at shorter (<250 ms) times the simulated E1P level grossly underestimated the fraction of E1P measured in the ADP chase experiment (filled circles). We conclude that the dimer model fails to reproduce the measured pre-steady state time dependence of E1P formation and that modification of this scheme is necessary to improve the fit.
Figure 5B shows simulations of the time courses of phosphorylation and ADP-sensitive phosphoenzyme formation using the trimer model in Fig. 4. At 0.4 M KCl, the enzyme exists in two species prior to the addition of ATP; E1/E1/E2 and E2/E2/E2. The forward (k1B) and reverse (k−1B) rate constants connecting these intermediates are identical at 4 s−1, leading to equimolar concentrations and the 1:1 ratio of fast:slow phases of phosphorylation at 2°C (3). When the enzyme is mixed with ATP, E1/E1/E2 is rapidly transformed to E2P(Ca2)/E1P(Ca2)/E2 via steps 2–5, resulting in an acid-stable intermediate containing equivalent amounts of the ADP-sensitive and ADP-insensitive phosphoenzymes. This species is quite stable, turning over with a rate constant of 0.2 s−1 at 2°C. Because E1P in the leading subunit is converted to E2P (step 4) prior to phosphorylation of the delayed subunit (step 5), the predominate phosphoenzyme that accumulates soon after mixing with ATP is E2P (85% at 10 ms; Fig. 6). As the delayed subunit becomes phosphorylated (step 5), the fraction of ADP-sensitive phosphoenzyme increases relative to E2P as depicted in the middle curve in Fig. 5B. By 116 ms, and possibly before, the phosphorylated subunits in the oligomer are equally distributed between E1P and E2P, and the ratio does not change as the pool of enzyme in E2/E2/E2 is slowly converted to E1/E1/E2 during the slow (4 s−1) phase of phosphorylation. We assigned a value of 70 s−1 to the rate constant for phosphorylation of the delayed subunit, making it equal to the rate constant of the initial subunit phosphorylated. This value proved to be too small, however, in predicting the fraction of E1P present after 10 ms of phosphorylation (15%), assuming that all of the measured ADP-sensitive EP is on the delayed subunit. This may not be the case, and the possibility that the leading and delayed subunits both contribute to the ADP-sensitive phosphoenzyme measured at 10 ms would allow for similar rates of phosphorylation (70 s−1) in both subunits. In that situation, E1P on the leading subunit will still be undergoing conversion to E2P at 10 ms, requiring a rate of conversion of E1P to E2P less than 500 s−1. This would be consistent with our estimate of the transition rate constant at 21°C, which is of the order of 500–600 s−1 to account for the rapid accumulation of E2P in the pre-steady state of phosphorylation (17).
EPR Spectroscopy of [2H]IASL-Ca-ATPase
In a previous study, we used the perdeuterated iodoacetamide spin label ([2H]IASL) to measure the conformational dynamics of the Ca2+-ATPase conformational change associated with enzyme activation by nucleotide binding to the active site of the enzyme in the presence of Ca2+ (13). The free [Ca2+] (~3.5 µM) was sufficient to saturate the high affinity transport sites. The EPR spectrum of the iodoacetamide spin-labeled Ca-ATPase ([2H]IASL-Ca-ATPase) is shown in Figure 7 (panel A). Apart from a minor (less than 5%) contribution from weakly-immobilized probes (peak A), the spectrum consisted of two primary components, the mole fractions (f) of which depended on the presence of nucleotide and Ca2+. In the presence of standard buffer (5 mM MgCl2, 0.45 mM CaCl2, 0.5 mM EGTA, 20 mM MOPS, pH 7.0) with 100 mM KCl, the spectrum consisted primarily of a single rotationally mobile component (peak B, fM ~ 0.95), though there was evidence of a minor, more restricted component (peak C, fR ~ 0%–5%), seen as shoulders on the low- and high-field peaks of the primary component. The [KCl] had no effect on the spectrum up to 0.6 M. Upon the addition of ATP, ADP, or ATP analogs (AMPPNP, AMPPCP), the mole fraction of the restricted spectral component (peak C) increased at the expense of the mole fraction of the more mobile primary component (peak B). This effect was enhanced by the presence of micromolar Ca2+, but Ca2+ alone (i.e., in the absence of nucleotide) had no effect. Millimolar levels (1–5 mM) of the ATP analogues (AMPPCP, AMPPNP) promoted the greatest change in the mole fraction of restricted probes (fR ~ 0.5 ± 0.025), whereas equivalent amounts of ATP or ADP promoted smaller changes (fR ~ 0.35 ± 0.03). Additional details pertaining to the [2H]IASL-Ca2+-ATPase have been described previously (13).
Fig. 7. Titration of nucleotide binding sites in [2H]IASL-Ca2+-ATPase at 0.1 M and 0.4 M KCl.

(A) The EPR spectrum of [2H]IASL-Ca2+-ATPase at 2°C indicated two populations of enzyme: those with rotationally mobile spin probes (peak B) and those with rotationally restricted spin probes (peak C). AMPPCP binding to the [2H]IASL-Ca2+-ATPase increased the latter at the expense of the rotational mobile probes in a concentration-dependent manner, saturating by 5 mM (more clearly seen in the inset to (B) which shows the expanded low field region of the spectrum in the absence and presence of 5 mM AMPPCP). (B) Using spectral subtraction techniques (13), we determined the fraction of enzymes with rotationally restricted probes as a function of [AMPPCP] at 2°C in the presence of either 0.1 M (filled circles) or 0.4 M (filled squares) KCl, Data are shown normalized to their maximum values to facilitate direct comparison of the two curves. The data were fitted by a single component (dotted curves) and two component (solid curves) binding equation as described in Methods. At low [KCl], the binding isotherm was better fitted by a two component binding equation (sum-of-squares error = 1.45 × 10⁻³, solid line) than a single component binding equation (sum-of-squares error = 6.64 × 10⁻³, dashed line) indicating the presence two separate binding sites at a 2:1 high:low affinity ratio. At high [KCl], a better fit was obtained with a two component equation (sum-of-squares error = 8.84 × 10⁻³, solid line) than a single component fit (sum-of-squares error = 2.07 × 10⁻², dotted line) indicating that the enzyme was predominantly (> 90%) in a low affinity nucleotide binding state.
To investigate the nucleotide concentration dependence of the restricted spectral component (peak C), we titrated the [2H]IASL-Ca2+-ATPase suspended in standard buffer with the non-hydrolyzable ATP analog AMPPCP in the presence of sufficient Ca2+ to saturate the transport sites and either 0.1 M (low) or 0.4 M (high) KCl and measured the changes in fR (Fig. 7). At 0.1 M KCl (circles), moderately low concentrations (10–50 µM), AMPPCP increased the mole fraction of restricted probes, suggesting that the appearance of the restricted component was related to high-affinity nucleotide binding. The change in fR was fully saturated by 5 mM AMPPCP. The binding isotherm was better fit by a two component binding equation (solid curve) than a single component binding equation (dashed line) based on sum-of-squares analysis (1.45 × 10⁻³ vs 6.65 × 10⁻³, respectively), indicating the presence of two distinct and co-existent nucleotide binding sites (K1 ~ 45 µM; K2 ~ 315 µM) at a ratio of 2:1 high:low affinity sites. Other ratios, such as 3:1 (tetramer model), gave a poorer fit (sum-of-squares error = 1.59 × 10⁻³). Likewise, two distinct nucleotide binding sites with similar affinities (K1 ~ 20 µM; K2 ~ 300 µM) were observed at high (0.4 M) KCl (squares), with the low affinity sites being the dominant species (~ 90%). The two populations of restricted probes could represent purely catalytic sites or a mixture of catalytic and noncatalytic allosteric sites. In the case of pure catalytic sites, the results do not support the monomeric enzyme model, which by simple mass action would have all AMPPCP bound in a high affinity state (E1•AMPPCP) in the presence of saturating Ca2+ (3.5 µM ionized Ca2+ in the samples). Since stabilization of the low affinity state (E2•AMPPCP) is necessary to prevent its spontaneous conversion to the high affinity state (E1•AMPPCP), this result is consistent with the presence of stable oligomeric interactions between subunits simultaneously expressing high and low affinity nucleotide binding sites. High [KCl] stabilizes enzyme in the E2 conformation, increasing greatly the proportion of low affinity sites in the AMPPCP titration experiment.
Time-resolved EPR of [2H]IASL-Ca2+-ATPase
In a previous study, we developed a method to monitor the transition between the two conformational states in the [2H]IASL-Ca2+-ATPase spectrum during the transient phase of enzymatic cycling at 2°C, based on detecting changes in the EPR signal as a function of time after the photolysis of caged ATP in the EPR sample (13; cf., Figure 3 therein). Figure 5 shows the transient EPR signal (filled triangles) obtained from [2H]IASL-Ca2+-ATPase in standard buffer containing 0.4 M KCl, acquired with a 10.24 ms dwell time and a 10.24 ms filter time constant. The signal exhibited a brief lag with a mono-exponential rise (see Methods) with a rate of 5 ± 0.5 s−1. When compared to the measured (filled squares) and simulated (lines) Ca2+-ATPase phosphorylation time courses, it is apparent that the EPR signal approximates the slow phase of phosphoenzyme formation, which has a rate constant of 3–4 s−1. In particular, the EPR signal correlates with the slow accumulation of the ADP-sensitive phosphoenzyme E1P that was measured at 116 and 223 ms in the ADP chase experiments in Fig. 6 (filled circles), but does not contain a fast phase corresponding to the initial rise in E1P observed below 25 ms. The abrupt increase occurs between 10 and 116 ms in which the fraction of E1P in the total phosphoenzyme increases from 15% to 50%; thereafter, E1P accumulates at a rate of 3–4 s−1, in agreement with the kinetics of the EPR signal. The absence of an EPR signal corresponding to the fast phase of E1P formation implies that the accumulation of the weakly-immobilized fraction of spin labels corresponds to the formation of an intermediate species that is distinct from the ADP-sensitive EP that we had previously identified as the source of the signal (3).
DSP- and Sulfo-SMCC-induced Cross-linking of SERCA1
Hetero- and homo-bifunctional cross-linkers have been used to generate intermolecular cross-links in SERCA1 resulting in the appearance of dimers, trimers and higher-order multimers on SDS-PAGE gels (26). Here, we used two cross-linking agents, DSP and sulfo-SMCC, to detect the presence of oligomeric structure in native SERCA1 under quiescent (−ATP) and cycling (+ATP) conditions. DSP is a homobifunctional (amines), thiol-cleavable membrane permeable cross-linker, and sulfo-SMCC is a heterobifunctional (amine and sulfhydryl), water-soluble, non-cleavable, membrane impermeable cross linker. These two complementary cross-linking agents were used to increase the possibility of detecting SERCA1 cross-links by sampling two different environments (membrane versus aqueous components). In the absence of cross-linker the blots show a prominent band at ~ 100 kD, representing the monomeric pump protein, and a very faint band at 200 kD that most likely corresponds to SERCA1 dimers (lane 1). Under non-cycling conditions (− ATP), DSP cross-linked SERCA1 with bands appearing at 200 and 300 kD (lane 2), which correlates with SERCA1 dimers and trimers, respectively. A fainter band was observed at 600 kD that may correspond to a SERCA1 hexamer. Adding 1 mM ATP to the reaction mixture containing DSP resulted in a similar pattern and density of bands representing cross-linked species generated under cycling conditions (lane 3). Bands representing species larger than the SERCA1 monomer disappeared when DTT was included in the SDS quench solution to reductively cleave the DSP disulfide bond (not shown). When sulfo-SMCC replaced DSP in the reaction mixture, a slightly different pattern of cross-linking was obtained which included a prominent trimer band, and much weaker tetramers and higher order multimers (lane 4). Again, the pattern and band density did not change appreciably under cycling (+ ATP) conditions (lane 5). These experiments demonstrate that a mixture of oligomeric species are present in native skeletal SR, that the band pattern is not significantly altered by ATP. The predominate cross-linked species are SERCA1 dimers and trimers, although higher order oligomers are also present.
DISCUSSION
In this study, time-resolved kinetic and EPR spectroscopic investigations of the Ca2+-ATPase in sarcoplasmic reticulum from skeletal muscle have uncovered new evidence for oligomeric interactions in the catalytic cycle of SERCA1. A number of studies have shown that kinetic data obtained from the monomeric, C12E8-treated enzyme is fully compatible with a monomer scheme and that no evidence of oligomeric interactions appear in these data (3, and references therein). Nevertheless, previous attempts (3) to simulate phosphorylation and inorganic phosphate (Pi) release for SERCA1 in native skeletal muscle SR vesicles at 21°C using a Ca2+-ATPase monomer scheme failed at reproducing the time and concentration dependence of these reactions (Fig. 2A), indicating that a modification of the mechanism was required. Introducing a second, parallel pathway and out-of-phase coupling between the pathways in a Ca2+-ATPase dimer explained the inverted time-dependence of E1P and E2P formation (3), but left the quantitative discrepancy between EP formation and Pi release unresolved. Here we show that a SERCA1 trimer, in which the interacting subunits cycle asynchronously during ATP hydrolysis (Fig. 4), will accommodate the concentration-dependent changes in these variables over time. A major feature of the trimer model is that it couples dephosphorylation of one subunit with phosphorylation of a second subunit, allowing Pi to rapidly accumulate in the pre-steady state (burst phase) without a significant drop in the phosphoenzyme level (Fig. 2B). The ATP that phosphorylates the enzyme preventing the decay of the overshoot also activates Ca2+ deocclusion from E2P(Ca2) prior to hydrolysis, thereby accelerating dephosphorylation. This accounts for the [ATP]-dependence of the Pi burst kinetics (7), and explains how activation of dephosphorylation by micromolar ATP at millimolar Mg2+ levels can occur in an enzyme having only one nucleotide binding site (1, 4). In addition to linking phosphorylation to dephosphorylation, the trimer scheme couples both of these reactions to the E1P → E2P transition, which takes place simultaneously in the third subunit (Fig. 4, step 6). This retains the coupling relationship between the E1P → E2P transition and E2P hydrolysis previously demonstrated in SERCA1 and in SERCA2a expressed without phospholamban (15), while introducing an additional source of free energy contributed by the phosphorylation reaction. The net effect of coupling these reactions together is that the catalytic efficiency of the Ca2+-ATPase and the overall velocity of Ca2+ transport both increase. This comes about through a transfer of free energy of activation between the subunits that leads to an increase in the activity of slow (rate-limiting) reactions (gain in free energy) while decreasing the activity of fast reactions (decrease in free energy).
Compared to SERCA1, the EP overshoot in the cardiac muscle isoform, SERCA2a, is more prominent and decays at a rate that is independent of [ATP] (14, 15). We attribute the lack of allosteric kinetic behavior in SERCA2a to its existence as a monomer under conditions in which its regulatory protein, phospholamban, is unphosphorylated (15, 30). Phosphorylation of phospholamban (31), or the expression of SERCA2a in Sf21 ER microsomes without phospholamban (15), produces SERCA1-like kinetic behavior, implying that SERCA2a oligomerizes when the inhibitory effect of phospholamban is removed (15). The kinetic behavior ascribed to SERCA2a oligomerization in Sf21 microsomes is associated with a 7-fold lower enzyme site density than found in native skeletal SR membranes; this reduces the probability that the kinetic behavior is simply the result of random collisions or molecular crowding. SERCA2a oligomerization increases the maximum velocity of Ca2+ accumulation, attained through reciprocal changes in the activity of fast (e.g., E1P → E2P) and rate-limiting (E2P → E2 + Pi) reactions. The changes in biochemical behavior associated with SERCA2a oligomerization (less prominent EP overshoot, [ATP]-dependent decay rate) suggest that the physical state of the de-inhibited cardiac Ca2+-ATPase conforms to a mixture of di- and tri-protomers. Saturation transfer EPR measurements (30, 32) support the induction of a SERCA2a oligomer following the relief of phospholamban inhibition, but the ensuing change in SERCA2a rotational characteristics is more consistent with the presence of a dimer than a trimer. These results, however, do not exclude the possibility of a trimer given the larger size of the cytoplasmic headpiece of the Ca2+-ATPase relative to the trans-membrane portion of the enzyme (1, 2) and the approximations used to derive the size of the SERCA2a rotating unit (32).
During steady state cycling, the trimeric subunits are in separate states reflecting their out-of-phase (asynchronous) relationship in carrying out the reactions of the transport cycle. We were able to characterize these states in terms of their chemical composition from quenched-flow measurements of phosphoenzyme formation and decomposition, and from Pi production in the pre-steady state. ADP chase experiments at 21°C with sealed SR vesicles revealed that approximately one-half of the steady state EP is in an ADP-sensitive state (E1P) while the remainder is ADP-insensitive (E2P) (Fig. 3). The pre-steady state Pi burst, corresponding to the formation of E2•Pi or E2 + Pi from E2P, has an amplitude equal to one-half the total EP level (Fig. 2), indicating that E1P, E2P, and E2 or E2•Pi are present in equimolar amounts in the steady state. Assuming that the steady state is dominated by a single species, the oligomer consistent with these observations is a tri-protomer: E1P/E2P/E2. At saturating (100 µM) ATP, the sum of these species equals 5.0–5.3 nmol of SERCA1/mg SR protein, the content of Ca2+-ATPase in native skeletal SR vesicles reported by Barrabin et al. (33). The experimental variation in SERCA1 content reported by different laboratories would allow for as much as 6–7 nmol enzyme/mg protein to be present, raising the possibility of a tetrameric enzyme in which one of the subunits contains tightly bound ATP. In disagreement with this possibility, we were unable find evidence for bound ATP in native SERCA1 using rapid filtration to trap E1•ATP during ATP hydrolysis (K. Taniguchi and J. Froehlich, unpublished observations). We conclude that E1(Ca2)•ATP formed in the catalytic cycle of native SERCA1 is rapidly and stoichiometrically converted to E1P(Ca2) driven by the rapid release of ADP from E1P(Ca2)•ADP which prevents the reversal of this reaction. Western blots obtained from cross-linking studies with DSP and sulfo-SMCC at 21°C and 0.1 M KCl showed evidence of tetramers and higher order multimers of SERCA1 (Fig. 8); however, these species were considerably weaker than the dimer and trimer bands formed under quiescent and cycling conditions. The cross-linking patterns produced by these bi-functional reagents are consistent with interactions involving 2 and 3 subunits in a SERCA1 trimer, and the kinetic data as well as the AMPPCP titration data at 0.1 M KCl lend further support to this idea. A problem with native skeletal SR is the high SERCA1 site density, which makes it difficult to exclude the possibility that the cross-linked oligomers arise from tight packing of SERCA1 monomers as opposed to subunit-subunit interactions in a trimer. A useful approach to reducing the site density is to solubilize the pump with detergents like C12E8, which forms active monomers (34) above its critical micellar concentration. Following partial removal of C12E8 from the Ca2+-ATPase with column chromatography, Le Maire et al. (35) was able to demonstrate soluble trimers and tetramers, suggesting that similar complexes might be present in the membrane. While the presence of detergent may alter the structure of SERCA1, the fact that these results are supported by independent freeze fracture evidence for intra-membrane particles the size of tetramers and trimers (36–38) suggests that such species are naturally-occurring and not artifacts of the solubilization procedure.
Fig. 8.

Chemical cross-linking of SERCA1 with SMCC and DSP. Native SR vesicles containing SERCA1 suspended in 0.1 M KCl, 3 mM MgCl2, 0.1 mM CaCl2 and 0.1 mM EGTA (yielding a free [Ca2+] ~ 10 µM) in the absence (quiescent, Q) or presence (cycling, C) of 1 mM ATP reacted with either DSP or sulfo-SMCC cross-linking reagents as described in Materials and Methods. Following SDS-PAGE, SERCA1 was detected by immunoblot using a SERCA1 monoclonal antibody. Lane 1: Control, no cross-linker. Lanes 2 and 3: SERCA1 treated with 2 mM DSP under quiescent (lane 2) and cycling (lane 3) conditions. Lanes 4 and 5: SERCA1 treated with 2 mM sulfo-SMCC under quiescent (lane 4) and cycling (lane 5) conditions. The numbers to the left of the gel indicate the size and positions of the molecular weight markers.
To elucidate the pathway generating E2P/E1P/E2 from precursors, we looked at evidence from rapid mixing experiments in which the time courses of the ADP-sensitive (E1P) and ADP-insensitive (E2P) phosphoenzymes were measured. To facilitate this analysis, we chose high [KCl] as one of the conditions for running these experiments, noting that the ratio of fast:slow phases of phosphorylation is sensitive to the salt concentration (12). Raising the [KCl] from 0.1 M to 0.4 M shifted the fast:slow ratio from 5:1 to 1:1 at 2°C (3). Ikemoto (11, 12) originally interpreted the fast and slow phases as representing phosphorylation of non-equivalent subunits in a Ca2+-ATPase dimer, although he conceived that a tetramer could also produce these results. To account for the two phases of phosphorylation (Fig. 5), we propose that there are two pools of trimeric enzyme (step 1, Fig. 4) and that one of these pools, E1/E1/E2, undergoes rapid phosphorylation in response to the addition of ATP, producing the fast phase of phosphorylation. Enzyme in the other pool, separated from the first by a relatively slow, KCl-dependent step, is not directly phosphorylated, but must be converted to E1/E1/E2 in order for phosphorylation to occur. The transition to this state, whose rate constant is [KCl]-dependent, controls both the rate of phosphorylation of the slow phase and the rate of appearance of the weakly-immobilized spin label fraction from [2H]IASL-Ca2+-ATPase (see below). During the fast phase (10 ms ADP chase, Fig. 6), most (85%) of the phosphoenzyme was ADP-insensitive, while throughout the slow phase the E1P:E2P ratio was 1:1 (116 and 223 ms ADP chase) and remained that way in the steady state (30 s ADP chase). This behavior, in which E2P begins at high level and decreases with time while E1P increases, cannot be explained by the conventional linear kinetic scheme in which E1P and E2P are consecutive intermediates in a monomeric enzyme (3). To accommodate this behavior, the transport model requires parallel asynchronously-coupled pathways (Fig. 4) that allow E1 on one of the subunits to be phosphorylated and transformed to E2P (step 4) ahead of phosphorylation on the lagging subunit (step 5). This is followed by a slow reaction (step 6) in which equimolar levels of E1P and E2P accumulate (as E2P/E1P/E2). As E1/E1/E2 is consumed, it is replenished by enzyme in the non-phosphorylated pool (E2/E2/E1 at 0.1 M KCl; E2/E2/E2 at 0.4 M KCl) at a rate equaling that of the slow phase of phosphorylation. Because the transformation of E1/E1/E2 to E2P/E1P/E2 is fast relative to this reaction, the E1P:E2P ratio remains constant at 1:1 throughout the slow phase of phosphorylation (Fig. 5 and 6). At 0.1 M KCl, phosphorylation of the slow phase occurred more rapidly (20 s−1), but the steady state E1P:E2P ratio was 1:1 as observed at 0.4 M KCl (3, 13). This suggests that the enzymatic reactions downstream from E1/E1/E2 are identical at 0.1 M and 0.4 M KCl as depicted in the model in Fig. 4, and that the KCl dependence of these reactions resides solely in the rate constants controlling the initial equilibria between the phosphorylated (E1/E1/E2) and non-phosphorylated (E2/E2/E1 and E2/E2/E2) pools.
The SERCA1 tri-protomer that accumulates in the steady state of phosphorylation has one of its subunits in the E2 conformation consequent to E2P hydrolysis occurring during the burst phase of Pi production. Evidence that E2 is also present in the precursor to phosphorylation comes from AMPPCP titration measurements using the [2H]IASL-Ca2+-ATPase and EPR spectroscopy to monitor nucleotide binding in the 10 µM to 5 mM range. At 0.1 M KCl, the EPR-based method revealed both high (~45 µM) and low (~ 315 µM) affinity AMPPCP binding sites (Fig. 7), consistent with the simultaneous presence of the E1 and E2 conformational states, respectively. The fact that these measurements were carried out at a Ca2+ concentration sufficient to saturate the transport sites suggests that the high and low affinity binding sites are on adjacent subunits of an oligomer stabilized by strong asymmetric subunit-subunit interactions. Had E1 and E2 been on independent, non-interacting subunits, binding of Ca2+ and AMPPCP to the enzyme would have shifted the E2 ↔ E1 equilibrium towards the high affinity state, producing a monophasic titration curve. From the 5:1 ratio of fast:slow phases of phosphorylation at 0.1 M KCl (13; cf. Table 3), we assumed that most (>80%) of the enzyme would be present as E1/E1/E2 prior to the start of phosphorylation. Modeling the AMPPCP titration data with a two-site binding equation provided clear evidence of a 2:1 ratio of high:low affinity nucleotide binding sites. The titration data show that the proportion of enzyme in the E1 and E2 states is sensitive to [KCl], with the low affinity (E2) conformation increasing at the higher (0.4 M) KCl concentration (Fig. 7). This implies that the trimeric enzyme in the non-phosphorylated pool at 0.4 M KCl has a larger number of subunits in the E2 conformation than the corresponding trimer at 0.1 M KCl. Assigning E2/E2/E2 to the non-phosphorylated pool at 0.4 M KCl is in accord with this prediction as is its slow rate (4 s−1) of transformation to E1/E1/E2, reflecting the stepwise conversion of two of the subunits from the E2 to the E1 conformation. At equilibrium, E1/E1/E2 and E2/E2/E2 should be present in equimolar concentrations as suggested by the 1:1 ratio of fast:slow phases of phosphorylation at 0.4 M KCl (Fig. 5). Assuming that the poise of the equilibrium is controlled by the [KCl] and not by AMPPCP binding, the expected ratio of high:low affinity AMPPCP binding sites is 1:2, whereas the observed ratio was closer to 1:9 under these conditions. This suggests that a higher order oligomer (hexamer?) may be present at high salt and that its conversion to E1/E1/E2 proceeds by more than one KCl-dependent step.
Our previous attempts to interpret the origin of the transient EPR signal were based on observations showing that the signal, representing a rotationally restricted fraction of spin label attached to cysteine 674, arises in response to substrate binding at the nucleotide site and is maintained as long as ATP is hydrolyzed by the enzyme (13). Binding of inorganic phosphate (Pi) to SERCA1 under conditions leading to phosphorylation of the enzyme did not elicit the signal (13), excluding the ADP-insensitive phosphoenzyme as its source. Kinetically, the EPR signal was shown to track the secondary phase of phosphorylation, suggesting that a slow reaction (E2 → E1?) controls its rate of formation. Potential candidates involved in generating the rotationally restricted EPR signal are the Michaelis complex, E1•ATP, and the ADP-sensitive phosphoenzyme, E1P, which accumulated in the pre-steady state of phosphorylation and remained high during the steady state. In the context of the dimer model (Fig. 1), we assumed that accumulation of E1P occurred on the delayed subunit stabilized by interaction with E2P on the adjacent subunit. No EPR signal accompanied the rapid phase of phosphorylation, suggesting the conversion of E1P to E2P during that phase was so rapid that its EPR signal was virtually undetectable. We now realize that this explanation for the monophasic increase in the EPR signal is incorrect because we have evidence at 0.4 M KCl for a rapid phase of E1P formation (middle curve, Fig. 5B) that does not have a corresponding EPR signal. Although we were unable to assign a rate constant to this phase, ADP chase data acquired at 10 and 116 ms (Fig. 6) demonstrate that E1P accumulates rapidly during this time interval. By contrast, only the slow phase of E1P accumulation following the initial build-up was kinetically correlated with the rotationally restricted EPR signal, indicating that these two events are rate-limited by the same reaction.
To incorporate these new findings into our interpretation of the EPR transient, we assume that the rotationally restricted component in the signal arises from an event triggered by substrate binding at the nucleotide site (to account for the spectral change with AMPPCP binding) and is rate-limited by the slow, KCl-dependent reaction that converts enzyme in the non-phosphorylated (E1/E2/E2 and E2/E2/E2) to the phosphorylated (E1/E1/E2) pool. To account for the observed kinetic behavior, we propose that the transient EPR signal is associated with a conformational change linked to the depletion of the non-phosphorylated enzyme as it is transformed to enzyme in the phosphorylated pool. As long as the enzyme is cycling, the signal is maintained, disappearing only after all the ATP is consumed (13). Although the rotationally restricted EPR signal may be associated with E1/E1/E2 and/or downstream intermediates, it does not correlate with ATP binding or EP formation during the fast phase of phosphorylation. Only after the rapid transformation of E1/E1/E2 to products does this EPR signal begin to appear, reflecting the slow conversion of E1/E2/E2 (at 0.1 M KCl) or E2/E2/E2 (at 0.4 M KCl) to E1/E1/E2. We assume that the rotationally restricted EPR signal associated with enzyme in the non-phosphorylated pool is very small or absent, and that the rotationally mobile EPR signal associated with this pool essentially obscures the rotationally restricted signal associated with enzyme in the phosphorylated pool. Thus, as E1/E2/E2 or E2/E2/E2 decline after ATP is added, the rotationally restricted EPR signal begins to emerge, reflecting an increase in the phosphorylated enzyme pool intermediates relative to the total enzyme population. When E1/E2/E2 or E2/E2/E2 re-populate after ATP is consumed, then the rotationally restricted spin probe signal again disappears. To explain how AMPPCP binding produces the rotationally restricted EPR signal (Fig. 7), we assume that when this ligand binds, it drives a certain fraction of the enzyme from the non-phosphorylated to the phosphorylated pool, uncovering the presence of rotationally restricted probes within the latter. This shift is expected to occur at low (micromolar to sub-millimolar) AMPPCP concentrations because of tight binding of this ligand to E1, the preferred enzyme conformation in the phosphorylated pool. At millimolar concentrations, AMPPCP also binds to E2, producing the restricted EPR signal seen at 0.4 M KCl (Fig. 7). That we did not detect a fast component in our time-resolved EPR measurements reflecting nucleotide binding to E2 in the non-phosphorylated pool can be explained by the fact that the concentration of ATP released from caged ATP during flash photolysis in our experiments was only ~100 µM, which is sufficient to occupy the high affinity nucleotide binding site on E1, but not the low affinity site on E2.
In summary, the SERCA1 trimer is a reasonable model constructed within the limitations of kinetic modeling, the assumptions made and empirical rate constants available. By adding a third parallel pathway to the catalytic mechanism of SERCA1 we were able to explain distinctive features of its kinetic, thermodynamic and structural behavior not accommodated by a simpler dimer mechanism. As an alternative interpretation of our results, the observed kinetic effects may arise from random interactions between SERCA1 molecules in the tightly packed skeletal SR membrane environment. We have previously reported that the native skeletal SR vesicles used in these studies contain up to 70% SERCA1 by weight (13), which is 5–7 times higher than SERCA2a in native cardiac SR or expressed in Sf21 insect microsomes (15). In the absence of co-expressed phospholamban, SERCA2a exhibits oligomeric kinetic behavior closely resembling that of SERCA1 in native skeletal SR (15), even though the SERCA2a site density in the microsomes is considerably more dilute. Because the kinetic behavior of these isozymes is quantitatively similar in very different membrane environments, we consider the tight packing, random interaction interpretation of our results to be unlikely, favoring instead the oligomer hypothesis in which subunit-subunit interactions modulate the kinetic behavior of SERCA1 in a highly specific and non-stochastic way.
A potential criticism of the oligomer model is that there is a large number of SERCA1 crystal structures corresponding to various functional states of the enzyme (39–42), and none of them shows evidence for the SERCA1 trimer as a minimal asymmetric unit. As described above, the trimer model was developed through the exclusion of other models because these simpler kinetics schemes (monomer, dimer) were not sufficient to explain our kinetic data. It is not clear whether the quaternary structure of SERCA1 in the membrane should necessarily agree with the crystal structure and vice versa, and whether the conditions of crystallization preclude this. For example, Toyoshima’s original SERCA1 crystal structure (1) showed alternating polypeptide chains pointing in opposite directions from the membrane, a structure clearly not consistent with unidirectional Ca2+ transport. Nevertheless, this structure did not negate what is known about the transport properties or kinetic behavior of the enzyme which would predict a completely different spatial arrangement of the polypeptide chains. In our case, crystal evidence to support the trimer would require a composite structure where part of the enzyme is crystallized in the E1 (Ca2+ stabilized) form and part in the E2 (Ca2+-free, thapsigargin-stabilized) form. Favorable conditions for this may exist in the membrane that are impossible or difficult to reproduce during crystallization. Since in relation to the quaternary protein structure there may be no direct correspondence between the crystal and membrane structures, there is no reason to expect that these two should necessarily agree, diminishing the impact of the lack of crystal evidence for the trimer.
An important aspect of the trimer model, and a feature adopted from previous models, is the asynchronous operation of the coupled pathways which allows the accumulation of asymmetric complexes with free energy transfer between the subunits. This has the effect of increasing the activity of slow (rate-limiting) reactions at the expense of faster reactions, resulting in an increase in the overall catalytic efficiency of the system. Chemical coupling between the subunits, leading to increased catalytic efficiency, is apparent in the distinctive kinetic behavior of the SERCA isozymes, e.g., the faster rate of Ca2+ uptake by SERCA1 resulting in the faster relaxation of skeletal muscle compared to that of cardiac muscle. In the cardiac Ca2+ pump (SERCA2a), the presence of phospholamban reduces its activity by interfering with the inter-subunit conformational interactions and chemical coupling and, together with the lower density of pump sites, produces slower Ca2+ re-uptake kinetics and slower relaxation characteristic of cardiac muscle (14, 43). Phosphorylation of phospholamban relieves its inhibition and allows the SERCA2a pumps to oligomerize, increasing chemical coupling and their catalytic efficiency during active Ca2+ accumulation (15). As a result of these events, cardiac muscle relaxation and cardiac inotropy increase (44), enhancing cardiac performance in order to satisfy increasing physiological demands.
Abreviations
- SR
sarcoplasmic reticulum
- SERCA
sarco(endo)plasmic reticulum Ca2+ transporting adenosine triphosphatase
- IASL
N-(1-oxy-2,2,6,6-tetramethyl-4-piperidinyl)iodoacetamide spin label
- ATP
adenosine 5’-triphosphatate
- ADP
adenosine 5’-diphosphate
- Pi
inorganic phosphate
- AMPPCP
β,γ-methyleneadenosine 5’-triphosphate
- EGTA
ethylene glycol bis(β-aminoethylether)-N’, N’, N’, N’-tetraacetic acid
- MOPS
3-morpholinomethane sulfonic acid
- SMCC
succinimidyl 4-[N-maleimidomethyl]-cyclohexane-1-carboxylate
- DSP
dithiobis[succinimidyl proprionate]
- C12E8
dodecyloctaoxyethylene glycol monoether
- PCA
perchloric acid
- TCA
trichloroacetic acid
- EPR
electron paramagnetic resonance
- fM
mole fraction of rotationally mobile spectral component
- fR
mole fraction of rotationally constricted spectral component
Footnotes
This work is supported by grants to J.P.F. (AHA 0555534U), D.D.T. (GM27906), I.K.F. (NIH HL071894) and J.E.M. (AHA 0040094N).
REFERENCES
- 1.Toyoshima C, Nakasako M, Nomura H, Ogawa H. Crystal structure of the calcium pump of sarcoplasmic reticulum at 2.6 Å resolution. Nature. 2000;405:633–634. doi: 10.1038/35015017. [DOI] [PubMed] [Google Scholar]
- 2.Toyoshima C, Nomura H. Structural changes in the calcium pump accompanying the dissociation of calcium. Nature. 2002;418:605–611. doi: 10.1038/nature00944. [DOI] [PubMed] [Google Scholar]
- 3.Mahaney JE, Thomas DD, Froehlich JP. The time-dependent distribution of phosphorylated intermediates in native sarcoplasmic reticulum Ca2+-ATPase from skeletal muscle is not compatible with a linear kinetic model. Biochemistry. 2004;43:4400–4416. doi: 10.1021/bi035068g. [DOI] [PubMed] [Google Scholar]
- 4.Toyoshima C, Mizutani T. Cryseal structure of the calcium pump with a bound ATP analogue. Nature. 2004;430:529–535. doi: 10.1038/nature02680. [DOI] [PubMed] [Google Scholar]
- 5.Wakabayashi S, Oguruso T, Shigekawa M. Factors influencing calcium release from the ADP-sensitive phosphoenzyme intermediate of the sarcoplasmic reticulum ATPase. J. Biol. Chem. 1986;261:9762–9769. [PubMed] [Google Scholar]
- 6.Champeil P, Gullian F. Rapid filtration study of the phosphorylation-dependent dissociation of calcium from transport sites of purified sarcoplasmic reticulum ATPase and ATP modulation of the catalytic cycle. Biochemistry. 1986;25:7623–7633. doi: 10.1021/bi00371a053. [DOI] [PubMed] [Google Scholar]
- 7.Froehlich JP, Taylor EW. Transient state kinetic studies of sarcoplasmic reticulum adenosine triphosphatase. J. Biol. Chem. 1975;250:2013–2021. [PubMed] [Google Scholar]
- 8.McIntosh DB, Boyer PD. Adenosine 5’-triphosphate modulation of catalytic intermediates of calcium ion activated adenosinetriphosphatase of sacrcoplasmic reticulum subsequent to enzyme phosphorylation. Biochemistry. 1983;22:2867–2875. doi: 10.1021/bi00281a015. [DOI] [PubMed] [Google Scholar]
- 9.Verjovski-Almeida S, Inesi G. Fast-kinetic evidence for an activating effect of ATP on the Ca2+ transport of sarcoplasmic reticulum ATPase. J. Biol. Chem. 1979;254:18–21. [PubMed] [Google Scholar]
- 10.Rossi B, Leone FA, Gache L, Lazdunski M. Pseudosubstrates of the sarcoplasmic Ca2+-ATPase as tools to study the coupling between substrate hydrolysis and Ca2+transport. J. Biol. Chem. 1979;254:2302–2307. [PubMed] [Google Scholar]
- 11.Ikemoto N, Garcia AM, Kurobe Y, Scott TL. Nonequivalent subunits in the calcium pump of sarcoplasmic reticulum. J. Biol. Chem. 1981;256:8593–8601. [PubMed] [Google Scholar]
- 12.Ikemoto N, Miyao A, Kurobe Y. Further evidence for for an oligomeric calcium pump by sarcoplasmic reticulum. J. Biol. Chem. 1981;256:10809–10814. [PubMed] [Google Scholar]
- 13.Mahaney JE, Froehlich JP, Thomas DD. Conformational transitions of the sarcolpasmic reticulum Ca-ATPase studied by time-resolved EPR and quenched-flow kinetics. Biochemistry. 1995;34:4864–4879. doi: 10.1021/bi00014a044. [DOI] [PubMed] [Google Scholar]
- 14.Sumida M, Wang T, Schwartz A, Younkin C, Froehlich JP. The Ca2+-ATPase partial reactions in cardiac and skeletal sarcoplasmic reticulum. A comparison Of transient state kinetic data. J. Biol. Chem. 1980;255:1497–1503. [PubMed] [Google Scholar]
- 15.Mahaney JE, Albers RW, Waggoner JR, Kutchai HC, Froehlich JP. Intermolecular conformational coupling and free energy exchange enhance the catalytic efficiency of cardiac muscle SERCA2a following the relief of phospholamban inhibition. Biochemistry. 2005;44:7713–7724. doi: 10.1021/bi048011i. [DOI] [PubMed] [Google Scholar]
- 16.Ikemoto N, Nelson RW. Oligomeric regulation of the later reactions of the sarcoplasmic reticulum calcium ATPase. J. Biol. Chem. 1984;259:11790–11797. [PubMed] [Google Scholar]
- 17.Froehlich JP, Heller PF. Transient state kinetics of the ADP-insensitive phosphoenzyme in sarcoplasmic reticulum. Implications for transient state calcium translocation. Biochemistry. 1985;24:126–136. doi: 10.1021/bi00322a018. [DOI] [PubMed] [Google Scholar]
- 18.Froehlich JP, Taniguchi K, Fendler K, Mahaney JE, Thomas DD, Albers RW. Complex kinetic behavior in the Na,K- and Ca-ATPases. Evidence for subunit-subunit interactions and energy conservation during catalysis. Ann N.Y. Acad. Sci. 1997;834:280–296. doi: 10.1111/j.1749-6632.1997.tb52259.x. [DOI] [PubMed] [Google Scholar]
- 19.Gornall AG, Bardawill CJ, David MM. Determination of serum proteins by means of the biuret reaction. J. Biol. Chem. 1949;177:751–766. [PubMed] [Google Scholar]
- 20.Wawrzynow A, Collins JH, Coan C. An iodoacetamide spin-label selectively labels a cysteine side chain in an occluded site on the sarcoplasmic reticulum Ca2+-ATPase. Biochemistry. 1993;32:10803–10811. doi: 10.1021/bi00091a035. [DOI] [PubMed] [Google Scholar]
- 21.Squier TC, Thomas DD. Methodology for increased precision in saturation transfer electron paramagnetic studies of rotational dynamics. Biophys. J. 1986;49:921–935. doi: 10.1016/S0006-3495(86)83720-1. [DOI] [PMC free article] [PubMed] [Google Scholar]
- 22.Lewis SM, Thomas DD. Resolved conformational states of spin-labeled Ca-ATPase during the enzymatic cycle. Biochemistry. 1992;31:7381–7389. doi: 10.1021/bi00147a024. [DOI] [PubMed] [Google Scholar]
- 23.Froehlich JP, Sullivan JV, Berger RL. A chemical quenching apparatus for studying rapid reactions. Ann. Biochem. 1976;73:331–341. doi: 10.1016/0003-2697(76)90178-0. [DOI] [PubMed] [Google Scholar]
- 24.Knott GD. MLAB; kinetic modeling laboratory. Mlab: A mathematical modeling tool. Comput. Programs Biomed. 1979;10:271–280. doi: 10.1016/0010-468x(79)90075-8. [DOI] [PubMed] [Google Scholar]
- 25.Pickart CM, Jencks WP. Slow dissociation of ATP from the calcium ATPase. J. Biol. Chem. 1982;257:5319–5322. [PubMed] [Google Scholar]
- 26.Kurobe Y, Nelson RW, Ikemoto N. Reversible control of oligomeric interaction of the sarcoplasmic reticulum calcium ATPase with the use of a cleavable crosslinking reagent. J. Biol. Chem. 1983;258:4381–4389. [PubMed] [Google Scholar]
- 27.Yokoyama T, Kaya S, Abe K, Taniguchi K, Katoh T, Yazawa M, Hayashi Y, Mardh S. Acid-labile ATP and/or ADP/Pibinding to the tetra-protomeric form of Na/K-ATPase accompanying catalytic phosphorylation-dephosphorylation cycle. J. Biol. Chem. 1999;274:31792–31796. doi: 10.1074/jbc.274.45.31792. [DOI] [PubMed] [Google Scholar]
- 28.Abe K, Kaya S, Imagawa T, Taniguchi K. Gastric H/K-ATPase liberates two moles of Pi from one mole of phosphoenzyme formed from high affinity ATP binding site and one mole of enzyme bound ATP at the low affinity site during cross-talk between the subunits. Biochemistry. 2002;41:2438–2445. doi: 10.1021/bi015622r. [DOI] [PubMed] [Google Scholar]
- 29.Yu X, Hao L, Inesi G. A pK change of acidic residues contributes to cation countertransport and electrogenicity in the Ca-ATPase of sarcoplasmic reticulum. Role of H+in Ca-ATPase countertransport. J. Biol. Chem. 1994;269:16656–16661. [PubMed] [Google Scholar]
- 30.Mahaney JE, Albers RW, Kutchai HC, Froehlich JP. Phospholamban inhibits Ca 2+ pump oligomerization and intersubunit free energy exchange leading to activation of cardiac muscle SERCA2a. Ann. N.Y. Acad. Sci. 2003;986:338–340. doi: 10.1111/j.1749-6632.2003.tb07208.x. [DOI] [PubMed] [Google Scholar]
- 31.Tada M, Ohmori F, Yamada M, Abe H. Mechanism of the stimulation of Ca2+-dependent ATPase of cardiac sarcoplasmic reticulum by adenosine 3’:5’-monophosphate-dependent protein kinase. Role of the 22,000-dalton protein. J. Biol. Chem. 1979;254:319–326. [PubMed] [Google Scholar]
- 32.Negash S, Chen LT, Bigelow DJ, Squier TC. Phosphorylation of phospholamban by cAMP-dependent protein kinase enhances interactions between Ca2+-ATPase polypeptide chains in cardiac sarcoplasmic reticulum membranes. Biochemistry. 1996;35:11247–11259. doi: 10.1021/bi960864q. [DOI] [PubMed] [Google Scholar]
- 33.Barrabin H, Scofano HM, Inesi G. Adenosinetriphosphatase site stoichiometry in sarcoplasmic reticulum vesicles and purified enzyme. Biochemistry. 1984;23:1542–1548. doi: 10.1021/bi00302a031. [DOI] [PubMed] [Google Scholar]
- 34.Møller JV, Lind KE, Andersen JP. Enzyme kinetics and substrate stabilization of detergent-solubilized and membranous (Ca2+ + Mg2+)–activated ATPase from sarcoplasmic reticulum. Effect of protein-protein interactions. J. Biol. Chem. 1980;255:1912–1920. [PubMed] [Google Scholar]
- 35.Le Maire M, Lind KE, Jϕrgensen HR, Møller JV. Ezymatically active Ca2+-ATPase from sarcoplasmic reticulum membranes, solubilized by nonionic detergents. Role of lipid for aggregation of the protein. J. Biol. Chem. 1978;253:7051–7060. [PubMed] [Google Scholar]
- 36.Jilka RL, Martonosi AN, Tillack TW. Effect of purified (Mg2+ + Ca2+)-activated ATPase of sarcoplasmic reticulum upon the passive Ca 2+ permeability and ultrastructure of phospholipids vesicles. J. Biol. Chem. 1975;250:7511–7524. [PubMed] [Google Scholar]
- 37.Scales D, Inesi G. Assembly of ATPase protein in sarcoplasmic reticulum membranes. Biophys. J. 1976;16:735–751. doi: 10.1016/S0006-3495(76)85725-6. [DOI] [PMC free article] [PubMed] [Google Scholar]
- 38.Scales D, Inesi G. Localization of ATPase protein in sarcoplasmic reticulum membrane. Arch. Biochem. Biophys. 1976;176:392–394. doi: 10.1016/0003-9861(76)90179-x. [DOI] [PubMed] [Google Scholar]
- 39.Moller JV, Olesen C, Jensen AM, Nissen P. The structural basis for coupling of Ca2+ transport to ATP hydrolysis by the sarcoplasmic reticulum Ca2+-ATPase. J. Bioenerg. Biomembr. 2005;37:359–364. doi: 10.1007/s10863-005-9471-2. [DOI] [PubMed] [Google Scholar]
- 40.Olesen C, Picard M, Winther AM, Gyrup C, Morth JP, Oxvig C, Moller JV, Nissen P. The structural basis of calcium transport by the calcium pump. Nature. 2007;450:1036–1042. doi: 10.1038/nature06418. [DOI] [PubMed] [Google Scholar]
- 41.Toyoshima C, Inesi G. Structural basis of ion pumping by Ca2+-ATPase of the sarcoplasmic reticulum. Ann. Rev. Biochem. 2004;73:269–292. doi: 10.1146/annurev.biochem.73.011303.073700. [DOI] [PubMed] [Google Scholar]
- 42.Toyoshima C. Structural aspects of ion pumping by Ca2+-ATPase of sarcoplasmic reticulum. Arch. Biochem. Biophys. 2008;476:3–11. doi: 10.1016/j.abb.2008.04.017. [DOI] [PubMed] [Google Scholar]
- 43.Sumida M, Wang T, Mandel F, Froehlich JP, Schwartz A. Transient kinetics of Ca2+transport of sarcoplasmic reticulum. A comparison of cardiac and skeletal muscle. J. Biol. Chem. 1978;253:8772–8777. [PubMed] [Google Scholar]
- 44.Bers DM. Cardiac excitation-contraction coupling. Nature. 2002;415:198–205. doi: 10.1038/415198a. [DOI] [PubMed] [Google Scholar]