

Abstract
Transcription factors mediate the formation of nucleoprotein complexes that are critical for efficient regulation of epigenetic switches. In these complexes, DNA is frequently bent or looped by the protein; other times, strong interactions lead the DNA to fully wrap the regulatory protein(s). The equilibrium between the bending, looping, full and partial wrapping of DNA governs the level of transcriptional regulation and is tuned by biophysical parameters. Characterization of the structure, kinetics and thermodynamics of formation of such nucleoprotein complexes is fundamental to the understanding of the molecular mechanisms that underlie the operation of the genetic switches controlled by them. Here, we describe in detail how to perform tethered particle motion experiments aimed at understanding how protein-DNA interactions influence the formation and breakdown of these regulatory complexes.
Keywords: tethered particle, DNA looping, lambda repressor, Brownian motion
1 Introduction
1.1 Tethered particle motion
In the context of this chapter, tethered particle motion (TPM) refers to the Brownian motion of microscopic particles tethered by single polymer molecules (usually and hereafter DNA) to a surface. The tether limits the random motion of the particle, and real-time analysis of the magnitude of excursions of the particle from the anchor point reveals changes in the effective tether length. These changes can reflect modifications in the flexibility of the DNA or in the physical length of the DNA, as in the case of topological modifications induced by interacting proteins. Using TPM to explore protein-induced conformational changes in DNA avoids ensemble averaging and can reveal configurational heterogeneities which would be undetected in bulk measurements.
1.2 The niche for TPM among single molecule techniques
The niche for TPM experimentation is defined by the resolution of the analysis to determine the tether length, the acceptable time resolution and the sensitivity of the topological changes to tension in the polymer. Double-stranded DNA is a weak entropic spring that is readily extended by the inertia of a submicroscopic particle undergoing Brownian motion. Relatively simple microscopy and recent theoretical advances are powerful tools with which to analyze the range of Brownian motion to interpret changes in the DNA topology (1)
Compared to experiments that require manipulation of the particle, TPM experiments are simple and require only a stable, high magnification microscope equipped for differential interference contrast and digital video analysis. The TPM technique is limited to observation of the particle’s motion, which requires a few seconds to establish in aqueous, low viscosity solutions. Minimal tension is exerted by the particle on the DNA tether, which remains rotationally unconstrained. Tension can be critical for investigation of certain molecular mechanisms in which even forces in the range of tens of femtonewtons can interfere with the formation of DNA loops (2). At the other extreme, tether length changes on the order of tens of nanometers can be measured for DNA tethers several hundred base pairs in length (1, 3–5)
TPM originated in the laboratory of Michael Sheetz to study RNA polymerase (6). However, given that RNA polymerase translocates DNA with considerable force, single molecule manipulation has proven more advantageous for studies of polymerases (7). Instead, TPM has been used to study more mechanically fragile phenomena like DNA bending (8–9) and looping (10–15).
1.3 TPM and the regulation of transcription
Protein-mediated DNA bending, wrapping and looping occur ubiquitously in all organisms for purposes of packaging and transcriptional regulation. Some examples of DNA bends are those induced by the integration host factor (IHF) protein in prokaryotic DNA (16) and by the high mobility group 1 (HMG1) protein in eukaryotic DNA (17). In eukaryotes, histone octamers are well known for binding and wrapping about 147 base pairs of DNA in almost two turns around each octamer (18) Note, however, that it has been hypothesized that most, if not all, DNA binding proteins may have evolved the capability to wrap and thereby organize regions of DNA flanking the consensus binding site (19). Examples of DNA looping are also well known: in eukaryotes in which loops appear to constitute insulator domains (20) ; in prokaryotes, such as those mediated by the lac (11, 13) and gal (21) repressors; and in bacteriophages, such as the lambda repressor (15, 22). These examples all pertain to transcriptional regulation, but similar conformational changes occur in the regulation of most DNA transactions, such as replication, recombination, etc. Therefore, characterization of the kinetics and thermodynamics of the formation of these nucleoprotein complexes, as well as their structure and stoichiometry, is paramount to understanding their regulatory function.
2 Materials
2.1 Stock solutions
All reagents were purchased from Thermo Fisher Scientific (Waltham MA) and can be stored at 4 °C unless stated otherwise.
0.015 mg/ml α-casein (Sigma-Aldrich, St. Louis, MO). α-casein is not highly soluble in PBS but a 1–2% solution can be prepared. Store it at 4°C.
1 M DTT. Store it at −20 °C.
0.5 M EDTA
10 X Phosphate buffered saline (PBS)
3 M Potassium chloride
1 M Tris-HCl pH 8.0
DMSO
Molecular biology grade water
Ethanol 99%
2.2 Producing DNA tethers using PCR
1 μg/ml pDL1051 plasmid DNA ( available upon request)
10 μM 5’-biotin-(C6)- forward primer (5’-cgcaattaatgtgagttagctcactcattaggcaccccaggc-3’ (see Note 1); Integrated DNA Technologies, Coralville, Iowa) in 10 mM Tris-HCl pH 8.0
10 μM 5' Digoxigenin NHS Ester of reverse primer (5’-gcattgcttatcaatttgttgcaacgaacaggtcactatcagtc-3’ (see Note 1); Integrated DNA Technologies) in 10 mM Tris-HCl pH 8.0
Taq polymerase and 10X Standard Taq buffer (New England Biolabs, Ipswich, MA)
6 mM dNTP mix
MinElute PCR Purification Kit (Qiagen, Hilden, Germany)
Tubes for thermocycling
Thermocycler
2.3 Preparing tethered beads
40 μg/ml Biotinylated-BSA (Sigma) in PBS
50 μg/ml Streptavidin (Sigma) in PBS (Store it at −20 °C.)
antidigoxigenin-coated polystyrene microspheres (480 nm; Indicia Diagnostics, Oullins, France; see Note 2)
2.4 Flow chamber assembly
Kimwipe tissues
Vacuum grease
Syringe with cut micropipette tip for application of grease to glass
24 X 40 (or 24) mm No. 1 coverslips
Microscope slides
Ethanol to clean microscope slides and coverslips
Double-sided tape with backing on one side
Scissors to cut tape
Ceramic coverslip rack (Thomas Scientific, Swedesboro, NJ, part no. 8542E40)
Shandon Vertical or Horizontal Staining Jar
Measurement buffer: 10 mM Tris-HCl pH 8.0, 0.1 mM EDTA, 200 mM KCl, 5% DMSO, 0.2 mM DTT, o.01 mg/ml α-casein
Wash buffer: 10 mM Tris-HCl pH 8.0, 0.1 mM EDTA, 200 mM KCl, o.01 mg/ml α-casein
A pipette tip box with wet tissue in the bottom to be used as a humid incubation box for the flow chamber.
2.5 Microscope operation
Upright DM LB2 microscope (Figure 1; Leica Microsystems GmbH, Wetzlar, Germany)
100 X 1.2–1.4 numerical aperture, oil immersion objective (Leica).
Differential interference contrast optics (Leica)
0.9 NA oil immersion condenser (Leica)
CV-A60 video camera (JAI, Copenhagen, Denmark)
Figure 1.
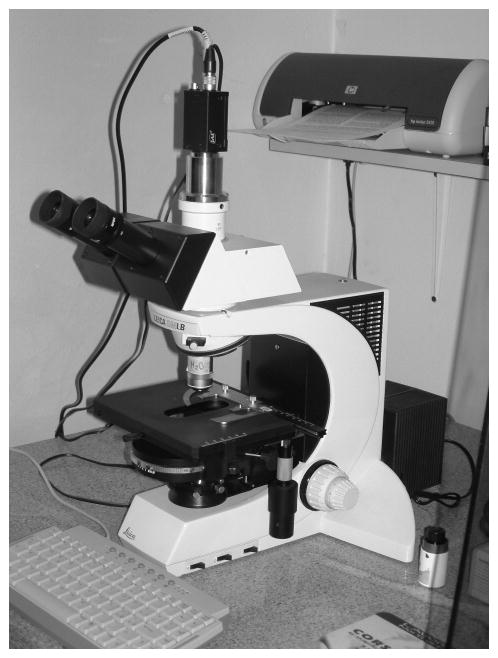
An upright Leica microscope used for tethered particle motion experiments. The small CCD camera is mounted on a 1X coupler attached to the trinocular.
2.6 Particle tracking and analysis
Pentium III or faster computer
LabView (National Instruments, Austin, TX)
IMAQ Vision (National Instruments)
PCI-1407 frame grabber (National Instruments)
MatLab, version R2006b (MathWorks, Natick, MA) for tether length analysis
Custom routines for tether length analysis (Finzi laboratory webpage, www.physics.emory.edu/faculty/finzi/)
3 Methods
3.1 Producing DNA tethers using PCR
-
Mix the following in a thin-walled thermocycler tube:
Reagent concentration volume (μl) H2O (molecular biology grade) 23.8 Taq polymerase buffer 10 X 3.0 pDL1051 100 ng/μl 0.1 Taq Polymerase 5 U/μl 0.5 dNTP mix 10 mM 0.6 forward primer 10 μM 1.0 reverse primer 10 μM 1.0 total (μl) 30.0 -
Set the thermocycler to execute the following sequence:
Purify PCR product with Qiagen PCR cleanup kit according to manufacturer instructions. Elute in 50 μl of 10 mM Tris-HCl pH 8.0. Gel elecrophoresis in 1% agarose in TAE should show a band at 2210 base pairs (Figure 2).
Figure 2.
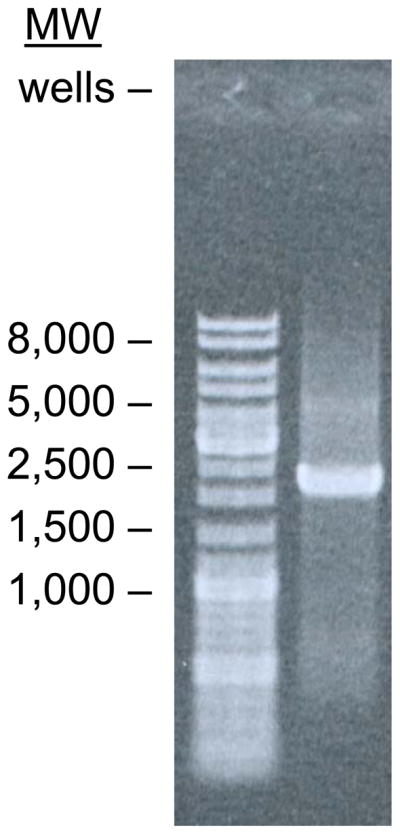
Gel electrophoresis of the PCR product using the indicated primers and plasmid template. Marker DNA bands shown on the left show that the PCR product migrates with a molecular weight between 2000 and 2500 base pairs as expected.
3.2 Flow chamber assembly
Wash the microscope slide and the coverslip thoroughly with ethanol and dry (see Note 6).
Cut two, 1 inch pieces of double sided tape and place along the long edges of the slide. Using the syringe filled with vacuum grease deposit lines of grease to make a channel just inside the tape. The channel does not need to be wide, because there will be plenty of beads for observation along the length of it (See Figure 3).
Peel the backing tape from the double sided tape. Center the coverslip on the slide and press it down, flattening (and spreading) the grease until the coverslip adheres to the tape. The channel narrows significantly as the grease encroaches.
Deposit lines of grease across the ends of the channels and across the short edges of the coverslip to create hydrophobic dams to contain solutions.
Figure 3.
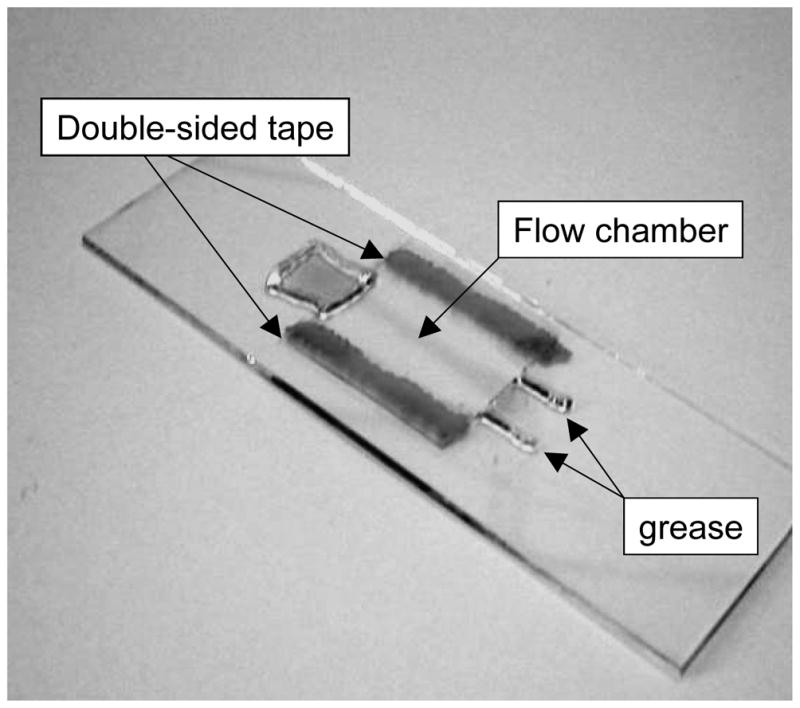
A microchamber formed with tape spacers (dark) and filled with dye (shaded) was assembled for illustration. At the upper left end there are grease dams on the slide and across the coverslip to contain the solution. At the lower right end lines of grease form a channel that narrows considerably under the coverslip pressed into the grease.
3.3 Preparing tethered beads
To deposit biotin sparsely on a coverglass prepare 50 μl of a 40 μg/ml solution of Bio-BSA in PBS. Draw the solution into the microchamber and incubate for at least 2 hours in the refrigerator in the humid box to avoid evaporation.
Meanwhile link DNA to anti-digoxigenin-coated beads. First dilute the DNA after the PCR cleanup 1:1000 in TE and mix 1μl of diluted DNA with 39 μl of anti-digoxigenin coated beads diluted 1:50 in wash buffer without DMSO or DTT. The ratio may require adjustment depending on the yield of DNA from the PCR. Incubate the DNA- bead mixture on ice for an hour.
Wash the chamber. Twist to roll up each corner of a Kimwipe. Place the twisted end in contact with the solution at the exit of the chamber to draw 400 μl of wash buffer through the chamber (see Note 7).
Then link streptavidin to the BSA-biotin on the coverslip. Prepare 50μl of a 50 μg/ml solution of streptavidin in PBS. Draw the solution into the microchamber and incubate for 15 min at room temperature in the humid box.
Wash the chamber (see above)
To tether the DNA-bead assembly in the chamber draw 40μl of bead-labeled DNA into the chamber and incubate at room temperature for 15 minutes to 1 hour.
Gently wash the chamber with 4–5 volumes of measurement buffer before observation.
3.4 Microscopeoperation
At least one hour before observing tethered beads, switch on the microscope lamp with oil on the objective if necessary. This allows the microscope to equilibrate thermally before beginning observations and will significantly reduce drift (see Note 8).
When the tethered beads are ready, switch on the video camera and activate the software (next section).
Place the sample on the stage, bring the objective to focus on the beads, and then focus and align the condenser.
Select a field in which there are at least six vigorously moving beads (Figure 4). Appropriate beads for data collection should all be randomly moving about an anchor point, but even immobile beads can and should be used to correct the drift if less than six mobile beads are visible.
Figure 4.
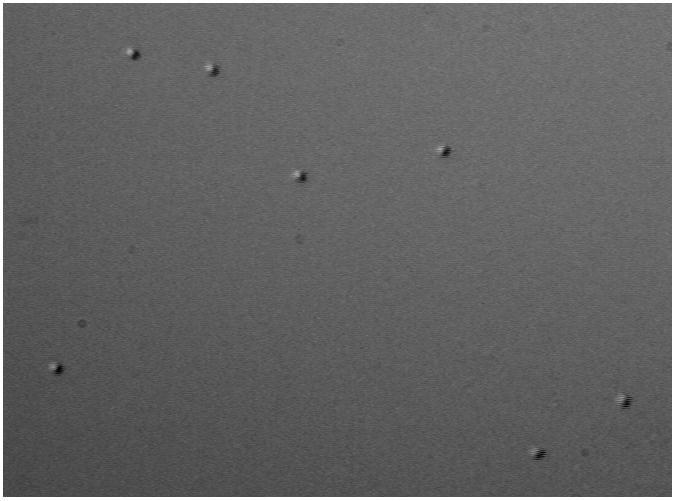
A representative field of view shows 480 nm diameter microspheres tethered to a coverslip by DNA molecules.
3.5 Particle Tracking
Activate the program “Measurement and Automation” to set the image acquisition parameters. Select “Devices and Interfaces”, select NI-IMAQ devices, select the relevant camera channel. Check that the field/frame windows mode is set to “frame” and that “first field” is odd. Click save and exit the program.
Activate the program JAI A-S to set the video camera.
Click the first icon to open a window and confirm that the scan mode is set to “interlaced full frame, accumulation frame” and that the shutter speed is 1/1000 (1 ms).
Click on the second icon to open another window and select “synchronize” to initialize the camera.
Activate the Particle-Tracking virtual instrument (VI) to select the beads and record data.
The Particle tracking VI opens a live display from the camera (Figure 4) and a control window from which one can activate a region of interest (ROI) in which to track beads and select a directory in which to save text files containing the sequences of coordinates.
Choose a directory/filename for the collected data.
Activate a region of interest in the control window. A small, square icon will appear in the live display which can be re-sized and moved to position it around a bead. Click “done” to confirm the positioning/sizing and a sequence of coordinates should begin to display in the control window associated with that ROI.
When all ROIs have been activated and positioned, switch on “Save data” in the control panel and record the motion of the control beads for 10 minutes (see Note 9).
At the end of the 10 minutes switch off “Save data”, select “Stop” to interrupt tracking, and set a new filename for the experimental data to follow.
Change solutions to create the experimental conditions and reactivate the live display. Reposition the tracking ROIs around the beads which may have shifted slightly during solution exchange.
When all ROIs have been positioned, switch on “Save data” in the control panel and record the motion of the experimental beads for about 30 minutes.
Switch off “Save data”, select “Stop” to interrupt tracking, and set a new filename for the next experiment.
3.6 Tether length analysis
MatLab routines are used to analyze the text files with list of coordinates produced by the Particle Tracking VI. Locate the MatLab routine for analysis of control data, “controls_filtrect4_50hz.m”. Execute this routine and begin by selecting a text file of coordinates for analysis in the “File selector” window. The coordinate are read and displayed in a panel as shown in Figure 5.
Figure 5.

An overlay plot of the xy positions determined for all tracked beads in a field of view before correction for drift. Tracking produces a tight group of recorded positions for each bead (see also Figure 6).
3.6.1 Selection of beads for the drift calculation
The analysis routine then produces xy plots of the positions determined for individual beads throughout the entire recording (Figure 6). At this point the user should select beads that appear to have dense, perhaps slightly elongated, clouds of xy coordinates that will be used to calculate the drift. Irregular clouds of coordinates may indicate multiple tethers or intermittent adhesion to the slide and should be excluded from the calculation of the drift. However the drift correction will be applied to the coordinates for all beads and later, portions of sequences for asymmetric clouds of coordinates may be salvaged for analysis by excluding time intervals with obvious problems.
The positions of the individual beads oscillate rapidly about their respective anchor points. Usually, due to mechanical instability of the microscope, these anchor points also appear to slowly drift. To correct this artefact, the average position of the entire group of beads filtered with a time window (40 s; Figure 7), is subtracted from the time trace of each bead.
Figure 6.


An overlay plot of xy positions determined for two individual beads in a field of view before correction for drift. (a) One bead had quite symmetric clouds of coordinates, but another bead (b) had a slightly asymmetric distribution of x positions and was discarded from the drift calculation.
Figure 7.


x (a) and y (b) of the average position determined for the entire group of tracked beads vs. time (points). The drift curves (lines) are obtained by time filtering the data with a 40s window.
3.6.2 Symmetry test
After subtraction of the drift determined for the entire group from the motion of each individual bead, the corrected distributions of the x and y positions about their average values are presented for each bead, so that the user can judge the symmetry of the scatter and accept or discard each bead. Acceptable tethers exhibit very symmetric, broad distributions and any beads with asymmetric distributions should be discarded.
Portions of the data corresponding to discarded beads may be salvaged in a later step, in which the user may eliminate any intervals distorted by transient adhesion or momentary tracking failures due to material drifting through the field of view (Fig. 8). This truncation is sufficient to restore the data to a broad, symmetric distribution about the centroid as shown in Figure 9.
Figure 8.

After drift correction, x (upper) and y (lower) position versus time data show the Brownian motion along the x and y axis observed for the bead in the lower panel of Figure 6. Near 380 seconds, the x positions suddenly shift toward one side. In addition, during a brief interval near 535 seconds the bead adhered to the coverslip.
Figure 9.

The probability distribution for the x (upper) and y (lower) positions for the bead in the lower panel of Figure 6 after exclusion of the data between 380 and 600 seconds. These broad distributions extend symmetrically from the centroid.
3.6.3 Average tether length
Finally a 4 second moving average of the xy displacements of each bead from the anchor point is calculated and displayed for each bead above a histogram of the values (Figure 10). This data should oscillate about a mean value which can be accurately predicted theoretically (1–2, 23) (see Note 10). Figures depicting the data for each bead are automatically saved in the active folder while the corresponding data is recorded in a separate MatLab matrix file. An Excel format file is created containing the average and standard deviation xy excursions corresponding to the unlooped states for each bead.
Figure 10.

A 4-second moving average (grey) of the xy excursions of the bead away from the anchor point for the bead in the lower panel of Figure 5 after exclusion of the interval with shifted x coordinates. The mean value for the the entire trace is 337.3 nm (dashed line) with a standard deviation of 31.4 nm (dotted line).
3.6.4 Analysis of the Brownian motion with protein
The analysis of the xy excursions of tethered beads in the presence of proteins like the lambda CI repressor, that induces the formation of loops in the DNA, proceeds in a similar fashion.
However this routine, “experiment_filtrect4_50Hz.m”, can also furnish estimates of average excursion amplitudes in the data (Figure 11). If a bimodal distribution is observed, the operator can choose to perform a double-Gaussian fit. From the fit-determined mean values of the distribution, the routine automatically calculates a half amplitude threshold and perform analysis of the dwell times spent in each configuration. Dwell times shorter than the filter dead-time (half of the time-window duration) are successively discarded (24–25) (see Note 11). As for the control beads, figures with data for the experimental beads are automatically saved, and the values of the means, standard deviations and dwell times are appended to the Excel file created during analysis of the control beads.
Figure 11.

(upper) The time average xy excursion of the bead about the tether point switches between two states when 100 nM CI protein is present. The moving average (dark points) intermittently switches between excursion values corresponding to looped (dark grey) and unlooped (light grey) states. The dotted lines represent average excursions bounded by standard deviations indicated by dashed lines. Transitions between these states are identified using a threshold crossing algorithm (broad light grey) and refined by retaining only states that endure longer than the dead time of the filter. (thin black line, overlaid on all but one of the broad grey steps). (lower) A histogram of xy excursion amplitudes observed for the tethered bead during the entire recoding of almost 1600 seconds clearly reveals two predominant excursion amplitudes which were fit using two Gaussians (curve).
Acknowledgments
We acknowledge Doriano Brogioli who adapted the Particle Tracking VI from code available from National Instruments libraries. We are grateful to Phil Nelson and John Beausang for strategies with which to filter instrumental drift from the data, as well as to Qing Shao for an image of the PCR product.
Footnotes
Primers should have strong hybridization (GC-rich) at the 3’-end from which extension must proceed. Many researchers select primers with G and/or C as the final two bases. Primers should also be selected to minimize intramolecular hairpins and intermolecular pairing that would interfere with hybridization to the template strands. There are programs for predicting hybridization that might interfere and they are useful for discarding undesirable base pairing. In practice these predictions are not always accurate and several primer pairs for a given template sequence may need to be screened to optimize the yield.
The size of microspheres can affect the experiment in two ways. First, larger microspheres will experience significant hydrodynamic drag and move slowly. Thus they will require more time to adequately explore the available hemisphere of motion determined by the tether length and the time resolution will decrease slightly (26). Second, bulky labels attached to the end of a DNA molecule will limit the motion of the end and effectively stretch the DNA through an entropically generated force (2).
During the annealing step the short, usually 18–24 base pair, primers quickly locate complementary sites on the template strands. However the longer, slower template DNA can ultimately form a more stable hybrid and might displace the primers if the annealing interval is too long. 15–30 seconds is usually sufficient for annealing.
The elongation interval should be long enough to allow polymerases to complete complementary strand synthesis. As a rule of thumb. thermostable polymerases will require one minute to polymerize 1000 base pairs.
- Plasma cleaning (11)
- Acid washing: In a fume hood heat several coverslips in a loosely covered glass beaker of 1M HCl at 50–60 °C for 4–16 hours. Allow them to cool to room temperature, and wash coverslips extensively in distilled H2O, then rinse in double distilled H2O. Rinse coverslips in ethanol and separate them between sheets of Whatman paper to dry. Store the clean coverslips for as long as a year in a clean, dry tissue culture dish.
- Washing organic solvents: Place slides and coverslips in ceramic or metal racks (slotted Copeland jars work well for slides) and place the rack in a glass vessel. Fill the vessel to submerge the slides and coverslips in xylene and agitate gently for 30 min. Drain the xylene and replace with acetone and agitate for 30 min. Drain the acetone and replace with ethanol and agitate for 30 min. Store the slides and coverslips in ethanol. Dry with a stream of dry gas or by burning off the residual ethanol.
A Kimwipe wicks solution rapidly just after contact and then slows as the tissue becomes saturated. To produce gentle flow rates use a thin, highly twisted Kimwipe that is already wet with the buffer.
Research grade microscopes have been designed to minimize vibration, but for tethered particle tracking, the microscope should be further isolated from vibration. A heavy table top (stone or steel) resting on elastic rubber pads is sufficient isolation, but tables with active vibration damping can also be used. When linearly responsive elastic elements are compressed to about one half of the operational range, the resonant frequencies transmitted to the microscope will be minimized
Experiments require control and experimental traces for the same beads. If a bead breaks free or eludes the tracking program, for example when a freely diffusing bead drifts through the scene, it may be best to continue tracking the remaining beads. However if the measurement has just started, interrupt the tracking and start again.
Since an interlaced camera updates odd and even rows of the CCD alternately at the stated frame rate, images of fast moving beads may be slightly blurred if even and odd frames are combined for processing. Blurring tends to reduce the apparent amplitude of excursions about the anchor point. Instead sequences of even (and odd) frames may be analyzed separately with no blurring provided the pixel density oversamples the image of the bead.
To analyze traces showing changes in amplitude with time resolution higher than the one provided by the time filtering/thresholding method, an alternative approach has been devised (27) based on a previously published method for temporal sequences exhibiting discrete jumps in intensity (28). First a generalized likelihood ratio test is used to establish time points at which the amplitude of the excursions changes significantly. Recursive application of the test to an entire sequence of excursion data identifies all probable transitions between different excursion amplitudes. Then expectation-maximization clustering and the Bayesian information criterion are used to estimate the number of states accessible to the system and refine the selection of time points at which the amplitude changes. This procedure allows objective and quantitative determination of transitions between different tethered states in a model-independent way and without the artificial time resolution limitations that arise from filtering and thresholding.
References
- 1.Towles KB, Beausang JF, Garcia HG, Phillips R, Nelson PC. First-principles calculation of DNA looping in tethered particle experiments. Phys Biol. 2009;6:25001. doi: 10.1088/1478-3975/6/2/025001. [DOI] [PMC free article] [PubMed] [Google Scholar]
- 2.Segall DE, Nelson PC, Phillips R. Volume-Exclusion Effects in Tethered-Particle Experiments: Bead Size Matters. Phys Rev Lett. 2006;96:088306. doi: 10.1103/PhysRevLett.96.088306. [DOI] [PMC free article] [PubMed] [Google Scholar]
- 3.Wong OK, Guthold M, Erie DA, Gelles J. Interconvertible lac repressor-DNA loops revealed by single-molecule experiments. PLoS Biol. 2008;6:e232. doi: 10.1371/journal.pbio.0060232. [DOI] [PMC free article] [PubMed] [Google Scholar]
- 4.Vanzi F, Broggio C, Sacconi L, Pavone FS. Lac repressor hinge flexibility and DNA looping: single molecule kinetics by tethered particle motion. Nucleic Acids Research. 2006;34:3409–3420. doi: 10.1093/nar/gkl393. [DOI] [PMC free article] [PubMed] [Google Scholar]
- 5.Pouget N, Dennis C, Turlan C, Grigoriev M, Chandler M, Salome L. Single-particle tracking for DNA tether length monitoring. Nucleic Acids Res. 2004;32:e73. doi: 10.1093/nar/gnh073. [DOI] [PMC free article] [PubMed] [Google Scholar]
- 6.Schafer DA, Gelles J, Sheetz MP, Landick R. Transcription by single molecules of RNA polymerase observed by light microscopy. Nature. 1991;352:444–448. doi: 10.1038/352444a0. [DOI] [PubMed] [Google Scholar]
- 7.Bustamante C, Bryant Z, Smith SB. Ten years of tension: single-molecule DNA mechanics. Nature. 2003;421:423–427. doi: 10.1038/nature01405. [DOI] [PubMed] [Google Scholar]
- 8.Ali BM, Amit R, Braslavsky I, Oppenheim AB, Gileadi O, Stavans J. Compaction of single DNA molecules induced by binding of integration host factor (IHF) Proc Natl Acad Sci U S A. 2001;98:10658–10663. doi: 10.1073/pnas.181029198. [DOI] [PMC free article] [PubMed] [Google Scholar]
- 9.Dixit S, Singh-Zocchi M, Hanne J, Zocchi G. Mechanics of binding of a single integration-host-factor protein to DNA. Phys Rev Lett. 2005;94:118101. doi: 10.1103/PhysRevLett.94.118101. [DOI] [PubMed] [Google Scholar]
- 10.Finzi L, Gelles J. Measurement of lactose repressor-mediated loop formation and breakdown in single DNA molecules. Science. 1995;267:378–380. doi: 10.1126/science.7824935. [DOI] [PubMed] [Google Scholar]
- 11.Han L, Garcia HG, Blumberg S, Towles KB, Beausang JF, Nelson PC, Phillips R. Concentration and length dependence of DNA looping in transcriptional regulation. PLoS ONE. 2009;4:e5621. doi: 10.1371/journal.pone.0005621. [DOI] [PMC free article] [PubMed] [Google Scholar]
- 12.Pouget N, Turlan C, Destainville N, Salome L, Chandler M. IS911 transpososome assembly as analysed by tethered particle motion. Nucleic Acids Res. 2006;34:4313–4323. doi: 10.1093/nar/gkl420. [DOI] [PMC free article] [PubMed] [Google Scholar]
- 13.Rutkauskas D, Zhan H, Matthews KS, Pavone FS, Vanzi F. Tetramer opening in LacI-mediated DNA looping. Proc Natl Acad Sci U S A. 2009;106:16627–16632. doi: 10.1073/pnas.0904617106. [DOI] [PMC free article] [PubMed] [Google Scholar]
- 14.van den Broek B, Vanzi F, Normanno D, Pavone FS, Wuite GJ. Real-time observation of DNA looping dynamics of Type IIE restriction enzymes NaeI and NarI. Nucleic Acids Res. 2006;34:167–174. doi: 10.1093/nar/gkj432. [DOI] [PMC free article] [PubMed] [Google Scholar]
- 15.Zurla C, Manzo C, Dunlap D, Lewis DE, Adhya S, Finzi L. Direct demonstration and quantification of long-range DNA looping by the lambda bacteriophage repressor. Nucleic Acids Res. 2009;37:2789–2795. doi: 10.1093/nar/gkp134. [DOI] [PMC free article] [PubMed] [Google Scholar]
- 16.Nash HA. The HU and IHF proteins: accessory factors for complex protein-DNA assemblies. In: Lin EEC, Simon Lynch A, editors. Regulation of gene Expression in E. coli. R.G., Landes Company; 1996. [Google Scholar]
- 17.Werner MH, Bianchi ME, Gronenborn AM, Clore GM. NMR Spectroscopic Analysis of the DNA Conformation Induced by the Human Testis-Determining Factor SRY. Biochemistry. 1995;34:11998–12004. doi: 10.1021/bi00037a042. [DOI] [PubMed] [Google Scholar]
- 18.Luger K, Richmond TJ. DNA binding within the nucleosome core. Current Opinion in Structural Biology. 1998;8:33–40. doi: 10.1016/s0959-440x(98)80007-9. [DOI] [PubMed] [Google Scholar]
- 19.Tsodikov OV, Saecker RM, Melcher SE, Levandoski MM, Frank DE, Capp MW, Record MT. Wrapping of flanking non-operator DNA in lac repressor-operator complexes: implications for DNA looping. Journal of Molecular Biology. 1999;294:639–655. doi: 10.1006/jmbi.1999.3283. [DOI] [PubMed] [Google Scholar]
- 20.Gaszner M, Felsenfeld G. Insulators: exploiting transcriptional and epigenetic mechanisms. Nat Rev Genet. 2006;7:703–713. doi: 10.1038/nrg1925. [DOI] [PubMed] [Google Scholar]
- 21.Lia G, Bensimon D, Croquette V, Allemand JF, Dunlap D, Lewis DEA, Adhya SC, Finzi L. Supercoiling and denaturation in Gal repressor/heat unstable nucleoid protein (HU)-mediated DNA looping. Proceedings Of The National Academy Of Sciences Of The United States Of America. 2003;100:11373–11377. doi: 10.1073/pnas.2034851100. [DOI] [PMC free article] [PubMed] [Google Scholar]
- 22.Dodd IB, Shearwin KE, Egan JB. Revisited gene regulation in bacteriophage lambda. Curr Opin Genet Dev. 2005;15:145–152. doi: 10.1016/j.gde.2005.02.001. [DOI] [PubMed] [Google Scholar]
- 23.Nelson PC, Zurla C, Brogioli D, Beausang JF, Finzi L, Dunlap D. Tethered particle motion as a diagnostic of DNA tether length. J Phys Chem B Condens Matter Mater Surf Interfaces Biophys. 2006;110:17260–17267. doi: 10.1021/jp0630673. [DOI] [PubMed] [Google Scholar]
- 24.Colquhoun D, Sigworth FJ. Fitting and Statistical Analysis of Single Channel Recording. In: Sakmann B, Neher E, editors. Single Channel Recording. Plenum Press; New York: 1983. pp. 191–263. [Google Scholar]
- 25.Vanzi F, Sacconi L, Pavone FS. Analysis of kinetics in noisy systems: application to single molecule tethered particle motion. Biophys J. 2007;93:21–36. doi: 10.1529/biophysj.106.094151. [DOI] [PMC free article] [PubMed] [Google Scholar]
- 26.Han L, Lui BH, Blumberg S, Beausang JF, Nelson PC, Phillips R. Calibration of Tethered Particle Motion Experiments. 2009. pp. 123–138. [Google Scholar]
- 27.Manzo C, Finzi L. Quantitative analysis of DNA looping kinetics from tethered particle motion experiments. Methods In Enzymology. 2010 doi: 10.1016/S0076-6879(10)75009-6. in press. [DOI] [PMC free article] [PubMed] [Google Scholar]
- 28.Watkins LP, Yang H. Detection of intensity change points in time-resolved single-molecule measurements. Journal of Physical Chemistry B. 2005;109:617–628. doi: 10.1021/jp0467548. [DOI] [PubMed] [Google Scholar]