Abstract
This paper presents a numerical study to investigate the effect of geometrical and material transition on the flow and progression of a sample plug in electrokinetic flows. Three cases were investigated: (a) effect of sudden cross-sectional area change (geometrical transition or mismatch) at the interface, (b) effect of only material transition (i.e. varying ζ-potential), and (c) effect of combined material transition and cross-sectional area change at the interface. The geometric transition was quantified based on the ratio of reduced flow area A2 at the mismatch plane to the original cross-sectional area A1. Multiple simulations were performed for varying degrees of area reduction i.e. 0–75% reduction in the available flow area, and the effect of dispersion on the sample plug was quantified by standard metrics. Simulations showed that a 13% combined material and geometrical transition can be tolerated without significant loss of sample resolution. A 6.54% reduction in the flow rates was found between 0% and 75% combined material and geometrical transition.
Keywords: Electrokinetic flows, Material transition, Geometrical transition, Concentration, Zeta potential, Microfluidics
1. Introduction
Microfluidics has received a great deal of attention during the past two decades. The ability to miniaturize and integrate chemical and biological systems (μTAS) can be greatly productive in terms of cost and efficiency. In order to develop a fully integrated microfluidic device [1,2], it is often required to assemble modules fabricated on different materials and having varying functionality. For example, an integrated modular microfluidic device was demonstrated with polymerase chain reaction (PCR) on polycarbonate chip (PC) and ligase detection reaction (LDR) performed on poly-methyl-methacrylate (PMMA) chip to detect low-abundant DNA mutations in gene fragments (K-ras) with colorectal cancers [3]. However, one major issue in successful realization of a modular bio-analytic device is that most situations (i.e. chip to chip assembly or fluidic interconnections) often result in either surface heterogeneity [4] and geometrical misalignment [5] or both. Surface heterogeneity primarily influences electrokinetically driven flows which is the preferred method of fluid movement in these devices owing to its significant advantages [6]. Surface heterogeneity induces undesirable pressure gradients in applications where sample dispersion needs to be minimized by distorting the otherwise uniform (plug like) velocity profile [7]. Besides, heterogeneity in channel walls with rectangular cross sections have also been shown to produce velocity profiles which deviate considerably from the usual plug profile in electrokinetic flows [8,9]. Unlike surface heterogeneity, which primarily influences electrokinetic flows, sudden area changes or geometric transition can have adverse effect in both pressure and electrokinetically driven flows. For example, in the case of extreme misalignment between a tubing and a microchannel in a pressure driven flow, an additional pressure drop of 800 Pa was reported when compared to the case with no misalignment for the same flow rate [10]. In addition, area changes due to misalignments result in dead volumes causing retention of the sample to be transported [11]. To date, several studies explored the effects of surface heterogeneity in electrokinetic flows [12–19] while very few studies reported the effect of geometrical transition on the flow and sample transport. For example, Ruijin et al. [20] showed that a combined material transition and geometrical transition at the joint of capillaries drastically distorts the velocity profile, while Brotherton et al. [21] developed model for velocity changes due to material transition and reduced cross-sections at junction of material transitions. However, no quantification on the effect of sudden area transition on species transport was reported in these studies. A more recent study by Wu et al. [22] explored in detail the effect of combined heterogeneity and junction interface cross-sectional area on sample variance in hybrid microchips but did not consider the effects of geometric transition on pressure drop and flow rates, which are critical parameters in interconnected devices. In order to address manufacturing and functionality challenges involved in the design of fully integrated modular microfluidic devices, it is required to have insights into the possible effects of geometric transitions of interconnected micro-channels and chip material transitions on the fluidically transported samples. In this work we have performed several numerical simulations of electroosmotic flows to see the effect of chip material transitions and geometrical transitions on a simulated uncharged species plug (no electrophoresis) since distortion of the plug is primarily induced through the hydrodynamic effects.
2. Electroosmotic flow (EOF)
Electro-osmosis is the movement of the fluid by the application of an electric field. Most solid surfaces become charged when in contact with an electrolyte. This charged surface attracts oppositely charged ions, which are confined in a thin layer, the electric double layer (EDL) [23]. The inner layer of EDL is called the stern layer in which the ions are immobile and are held by strong electrostatic fields. The outer layer called the Helmholtz layer contains excess of counter-ions, which are mobile. When an electric field is applied, these counter-ions in the EDL move dragging the fluid along with them. Electroosmotic flow can be modeled by adding a body force term to the momentum equation in the Navier–Stokes equation and then solving for the momentum equations, when applicable. In most cases modeling can be simplified if the double layer thickness is small compared to the channel dimensions (Debye–Huckel approximation). For example, in the case of distilled water, this scale is of the order ~0.1 μm, which is very small compared to the characteristic microchannel dimensions encountered in practice [24]. The Debye length can be estimated as in the case of monovalent (1:1) electrolyte solution where c0 (molL−1) is the molar concentration of the aqueous solution [25]. The Debye length is 96 nm at 0.01 mM, 9.6 nm at 1 mM and 0.3 nm at 1 M concentrations. It can be seen that the Debye length reaches an order of few 100 nm only at extremely low concentrations. Hence in most of these cases where the Debye length is considerably smaller, the need to solve the flow inside the double layer is eliminated by applying a slip velocity V⃗eo on the walls of the channel [19,26]
| (1) |
where μeo is the electroosmotic mobility of the channel, η is the dynamic viscosity, ε is the permittivity of the fluid and Φ(x, y, z) is the electric potential governed by the Laplace equation for the divergence free electric field.
| (2) |
The potential at the outer edge of the stern layer is termed zeta (ζ) potential and is responsible for the observed electrokinetic phenomena [27,28].
3. Design and numerical simulation
3.1. Design and simulation of the channel
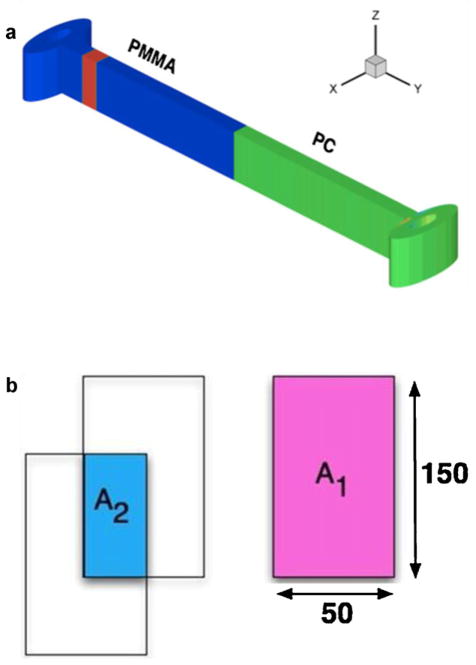
The simulation domain shown in Fig. 1(a) consists of a channel with the first half made of polymethylmethacrylate (PMMA) and the second half made of polycarbonate (PC) with two reservoir wells at the ends of the channel, allowing the fluid to come in and go out, and which contain the electrodes.
Fig. 1.
(a) 3-D view of simulated model showing the initial location of the species plug. (b) Reduction in the available flow area due to geometrical transition with A1 being the original cross-section and A2 being the reduced flow area.
In the simulations, the electro-osmotic mobility of PMMA used was μeo = 1.8 × 10⁻⁴ cm2 (Vs)−1 and the mobility of PC was μeo = 6.4 × 10⁻⁴ cm2 (Vs)−1. These are not atypical values and were obtained from literature [29,30]. These electroosmostic mobility values correspond to ζ = 25 mV and ζ = 90 mV for PMMA and PC respectively assuming viscosity and permittivity values of water at 25 °C. The width (w) and depth (H) of the channel are 50 μm and 150 μm respectively. The length of the first and the second half of the channel are denoted by L1 and L2. In the case of geometrical transition, a reduction in the available flow area occurs as shown in Fig. 1(b). The effect of these area changes was quantified based on the ratio of reduced available flow area (A2) to the original cross-sectional area (A1) i.e. A2/A1. Similar approach based on area ratios was reported by Wu et al. [22] in their studies on sample dispersion. A geometrical transition ranging from 5 μm to 25 μm along the width and from 5 μm to 75 μm along the depth was introduced at the junction of the material transition. The cases investigated were those of 0%, 13%, 50% and 75% reduction in the available cross-sectional flow area at the mismatch plane which correspond to flow area ratios 1:1, 1:1.14, 1:2 and 1:4. A neutral sample plug having a volume of 1.125 nL and c0 = 1 × 10⁻⁶ μmol L−1 concentration was introduced at a distance of 500 μm from the reservoir after the flow is fully developed Fig. 1(a). A typically low mass diffusion coefficient D = 1.2 × 10⁻¹⁰ m2 s−1 was used for the sample plug.
3.2. Modeling the EOF: governing equations
The detailed formulation of the equations in electrokinetic flows along with the boundary conditions are discussed elsewhere [23,31]. The governing equations are the continuity equation and the Navier–Stokes equations for an incompressible fluid with an additional body force term included due to the force exerted on the ions by the electric field, and are given by
| (3) |
| (4) |
where ρ, ν are the density and the kinematic viscosity of the fluid, ρe is the charge density and is assumed to be zero in the bulk flow. Eqs. (3) and (4) coupled with the species equation
| (5) |
where c(x, y, z) is the concentration and D being the diffusion coefficient of the species, are sufficient to completely determine the species progression in an electroosmotically driven flow. A zero species flux condition n⃗ · ∇⃗c = 0 is imposed on the channel walls to which the electric field vector is set tangent (i.e. n⃗ · ∇⃗Φ = 0). The electrode surfaces were taken as equipotential with a no-penetration velocity condition. Numerical simulations were performed using Coventorware™ with a spatial grid appropriately refined to render the results grid independent to within 1% in velocity and concentration. The change in the material type is represented by a change in electro-osmotic mobility μeo = εζ/η, which defines the slip velocity on the walls of the channel. This slip velocity is valid as long as the Debye length is very small compared to the characteristic length or channel dimensions. The thin double layer (i.e. small Debye length) results in plug flow, which is a characteristic of electro-osmotic flow, but shows deviations as the Debye length increases. To further illustrate the dependence of velocity profile on Debye length, the centerline velocity profile for the PMMA channel was plotted for varying Debye lengths (Fig. A1, appendix). It can be seen from the Fig. A1 that as the Debye length approaches 1000 nm or 1 μm, the velocity deviates from the plug profile and slip boundary condition loses its significance. However such high Debye length occurs at extremely low concentrations. For example even in the case of pure water at pH 7, the Debye length is estimated to be about 960 nm or ~1 μm. In such cases where Debye length is significant or comparable to mismatch or channel dimension, the slip velocity cannot be applied and the flow inside the double layer needs to be solved. However in our work, the geometric mismatch configurations (see Fig. A2 in appendix depicting various simulated configurations) have characteristic lengths which are very large (the least being 5 μm at the junction in Fig. A2 A2:A1 = 1:1.14). Hence the simulations are valid in applying the slip velocity condition for thin double layers (i.e. high concentrations of electrolyte or aqueous solutions). For all the cases investigated the fluid was assumed to have the properties of water.
4. Modeling
4.1. Pressure drop due to geometrical transition
To estimate the pressure drop due to geometrical transition, consider the same channel with μeo1 = μeo2 i.e. both halves made of same material: PMMA–PMMA or PC–PC). In the absence of a geometrical transition, the profile of the velocity is plug like and no pressure gradients are induced apart from those due to the reservoirs. When a geometrical mismatch or transition is introduced at in the channel, pressure gradients are induced both due to the change in electric field at the mismatch junction and also due to the acceleration and deceleration of the fluid because of the reduced flow area at the mismatch plane. In such cases, the total flow is a superposition of EOF and pressure driven flow. The combined flow rate Q = Qeof + Qp (where Qeof and Qp are EOF and pressure driven contributions to the flowrate) is given by
| (6) |
where f(AR) is the infinite series term in the expression for pressure driven flowrate in a rectangular channel [32]
| (7) |
and is the potential drop in the first half of the channel. It can be seen that f(AR) is a function of aspect ratio AR = Hw−1 defined as the ratio of depth (H) to width (w). To model the pressure drop due to geometrical transition, let the pressure drop in the first and second half of the channel be denoted by ΔP1, ΔP2 and let ΔPM be the pressure drop at the junction where sudden change in area occurs. No pressure is applied at the inlets and exits of the channel in the simulation and is assumed to be atmospheric at both ends. The total pressure drop in the channel is thus zero and can be written as
| (8) |
For two channels with same geometry (i.e. rectangular channels with same aspect ratio and cross-section in this case) connected together, the pressure gradient in each channel is equal
| (9) |
In the case of channels with different geometries connected together, the above relation depends on f(AR) of each channel and hence needs to be modified. Nevertheless in our current work, we assume that two channels being connected have similar geometries (i.e. aspect ratio and cross-section). Substituting ΔP2 from Eq. (9) into Eq. (6) and using the relation ΔPM = −(ΔP1 + ΔP2), the total flow rate can be written as
| (10) |
Denoting Q′ = Q/w2AR, and using the relation where ΔΦ is the total potential drop in the whole channel and ΔΦM, the total potential drop at the mismatch junction, the expression for pressure drop due to geometrical mismatch reduces to
| (11) |
in non-dimensional form, the pressure drop at the mismatch plane reduces to
| (12) |
where Q* = QL/(w2μ̄eo ΔΦ) and P* = PLw/(ημ̄eoΔΦ) are the non-dimensional flow rate and pressure, is the average mobility of the channel, the non-dimensional mobility in the first channel and is the non dimensional potential drop at the interface due to geometric transition.
4.2. Pressure drop due to only material transition
Similar to the case of geometrical transition, pressure gradients are also induced due to material transition. Consider a channel having a PMMA–PC or PC–PMMA material transition (i.e. the first half made of PMMA and second half made of PC or vice versa). This corresponds to the condition μeo1 ≠ μeo2 with μeo1 being the electroosmotic mobility of first half and μeo2 being mobility of second half. When a voltage is applied to drive the flow, pressure gradients are induced due to variation in the electroosmotic mobilities in the channel. The flow rate in each section is a combination of pressure driven and an electroosmotic component. From Eq. (6), the flow rate Qi in either section is given by
| (13) |
where (ΔΦ/L)i and (ΔP/L)i are the electric field and pressure gradients in the section of the channel. The subscript “i” refers to a particular section of the channel with uniform electroosmotic mobility μi. Using the width “w” and the average mobility μ̄eo as the scales for characteristic length and electroosmotic mobility, the normalized parameters can be defined by L* = L/w, P* = PLw/ημ̄eo ΔΦ, , Q* = QL/w2μ̄eo ΔΦ, Li is the length of each section of the channel. Following the analysis done by Herr et al. [7] for non-uniform zeta potential variation in circular capillaries and zeta potential variation in arbitrary channel cross-sections by Brotherton et al. [21], the induced non-dimensional pressure gradient obtained by equating the flowrate in each section reduces to
| (14) |
this equation can be extended to any number of material transitions and varying aspect ratio of the rectangular microchannel. The value of f(AR) for any aspect ratio can be calculated from Eq. (7). When ζ-potentials are known Eq. (14) can be used to estimate pressure drop by replacing with where and the non-dimensional variables being P* = PLw/εζ̄ ΔΦ, and Q* = QLη/w2εζ̄ ΔΦ.
4.3. Effect of combined material and geometrical material transition
This section models the effect of combined material and geometrical transition on EOF. Consider a PMMA–PC material transition i.e. μeo1 ≠ μeo2 and also having a geometrical mismatch at the mismatch plane. By rearranging terms in Eq. (12) the non-dimensional flow rate in the presence of a material and geometrical transition is given by
| (15) |
It should be noted that in order to predict the flowrate in the presence of both material and a geometrical mismatch, the values of and are required where and are functions of aspect ratio AR and flow area ratio A2/A1. These values were obtained from numerical simulations for varying flow area ratios A2/A1.
5. Results and discussion
5.1. Effect of only geometrical transition
The effect of pure geometrical transition on the species progression was investigated by considering a uniform channel made of PC (i.e. PC–PC) and introducing a sudden transition corresponding to a 75% reduction in the cross section at the mismatch plane i.e. A2:A1 = 1:4.
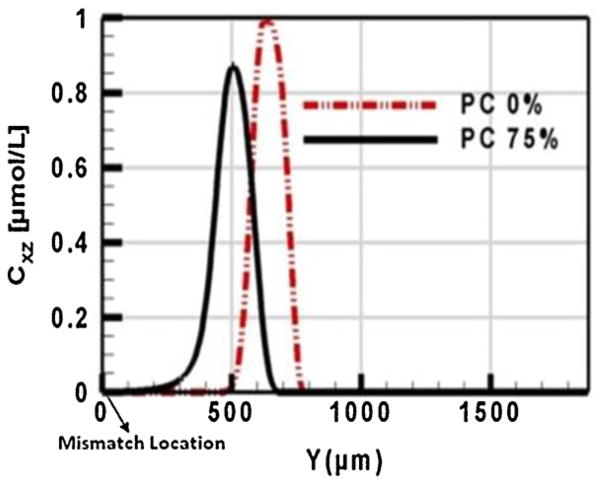
A plug was introduced into the channel to see the effect of area transition on the species progression. Due to the sudden change in flow area at the mismatch plane, pressure gradients are induced causing a deviation from the plug profile as shown in Fig. 2. To simulate the fluorescence detector signal, cross sectional slices were extracted at a spacing of 5 μm along the whole length of the channel and the concentration was averaged on each of these slices assuming the signal intensity is proportional to this averaged concentration. Fig. 3 compares the average concentration profiles with 75% and 0% geometrical transition area ratios at an instant when the plug is far away from the mismatch plane. The applied potential difference was equal in both cases.
Fig. 2.
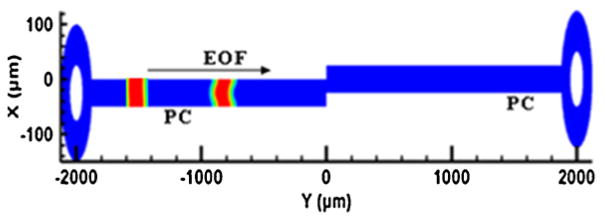
Deviation of a rectangular plug in a channel made completely of PC and having geometrical transition flow ratio A2:A1 = 1:4.
Fig. 3.
Average concentration profiles t = 2.2 s for a channel made entirely of PC and having geometrical transition ratio A2:A1 = 1:4.
Comparison of the peaks shows that the maximum concentration (Cmax) is less and plug length higher for 75% geometrical mismatch. The plug lengths at 10% peak height were: 119 μm and 275 μm for 0% and 75% geometrical mismatch respectively. Both the peaks in Fig. 3 correspond to t = 2.2 s but the plug in the case of 75% is slowed down as indicated by the lag between the peaks. This is due to the reduction in the flow rates caused by pressure gradients induced in the presence of a geometrical transition at the interface. For example at the same potential difference of 88 V the flow rates were: 10.908 nL s−1 and 10.196 nL s−1 for 0% and 75% geometrical transition respectively. This corresponds to a 6.53% decrease in the flow rate for the 75% reduction in available flow area. Studies have shown that size and shape of the sample plug can drastically affect the separation efficiency. Some authors [33,34] have used the ratio Cmax/σ, where σ is the standard deviation of the sample peak, as one of the metrics to quantify the dispersion of the plug in their studies of electrokinetic injection techniques. In their studies they have found that higher Cmax/σ (higher concentration and less dispersion) is a desirable characteristic of a sample plug. For the case shown in Fig. 3, the Cmax/σ values were 192 × 10−4 and 118 × 10−4 for 0% and 75% geometrical transitions respectively.
Other parameters providing insights into the dispersion and plug shape distribution are the skewness and kurtosis [35]
| (16) |
| (17) |
where y, μ, σ and C(y) denote the location, the first moment, standard deviation and the concentration profile at a particular time instant. The skewness and kurtosis provide a degree of asymmetry and flatness of the concentration profile. To further quantify the effect of geometrical mismatch on the plug dispersion in EOF using the above metrics, the skewness(S) and kurtosis(K) at various percentages of geometrical mismatch are summarized in Table 1. It can be seen that there was no change in skewness(S) and kurtosis(K) between A2:A1 = 1:1 (0% geometrical transition) and A2:A1 = 0.87:1 (13% geometrical transition). The change in skewness and kurtosis was drastic in the case of 75% geometrical transition. A negative skewness(S) shows that there is a tailing of the peak toward the left of the mean while a higher K implies less flatness of the peak. These results indicate that a modest transition of 13% (in this case induced by a 5 μm displacement along each cross-sectional axis for a 50 μm × 150 μm cross-section) can be tolerated since it has an insignificant effect on the dispersion of the sample plug. However a more drastic change (>13%) has a considerable adverse effect.
Table 1.
Skewness and Kurtosis as a percentage of geometrical mismatch for a channel completely made of PC.
| A2:A1 | Skewness (S) | Kurtosis (K) |
|---|---|---|
| 1:1 | −0.06 | 5.5 |
| 1:1.14 | −0.07 | 5.5 |
| 1:4 | −0.89 | 2.4 |
5.2. Effect of material transition
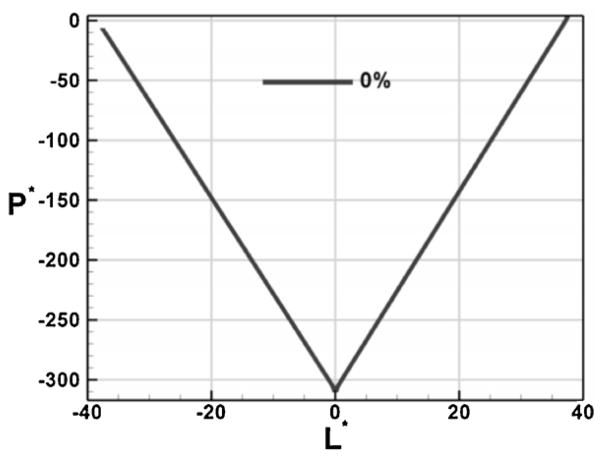
The effect of material transition without geometrical changes was studied in a PMMA–PC material transition. The mobility of PC is 3.55 times greater than the mobility of PMMA. When the voltage is applied, the fluid close to the surface acquires a velocity Veo = −μeo ∇Φ, which is dependent on the mobility of the material. Hence the layers close to the surface have different slip velocities in both halves. In order to maintain the mass conservation in the channel, pressure gradients are induced in each section of the channel. In the case of transition from PMMA to PC, Eq. (14) can be used to estimate the pressure gradient in each section. For example, for the PMMA section , f = 0.789 (for AR = 3) and using these values the nondimensional pressure gradient from equation was ΔP*/L* = 8.52. For validation purposes, the simulated nondimensional pressure for a PMMA–PC material transition, along the length of the channel is shown in Fig. 4 from which the calculated ΔP*/L* = 8.09. This is about 5% variation and this difference could be attributed to the presence of the reservoirs in the simulation, which were not taken into account in the derivation of Eq. (14).
Fig. 4.
Variation of non-dimensional pressure along the length of the channel in a PMMA–PC material transition.
It is also important to consider the dispersion of a species plug in a PMMA–PC material mismatch. A species plug was introduced after the flow was fully developed as in previous simulations and the fate of the plug is shown in Fig. 5.
Fig. 5.
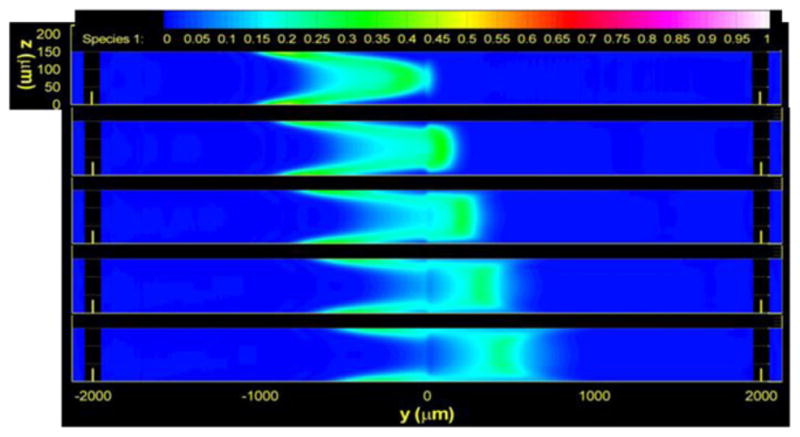
Plug dispersion due to a PMMA–PC material transition and no geometric transition.
The progress of the plug was evaluated by averaging the concentration as a function of time along the length of the channel. The interesting feature reflected from the average concentration profiles in Fig. 6 is that there is a re-concentration of the plug as it passes the mismatch plane because of the hydrodynamic reduction of the velocity in the core of the flow after the reduction. The re-concentration of the plug can be observed for the peak at t = 1.6 s with t = 0 denoting the start of the plug at 500 μm from the reservoir well. We can also see that there is a double peak (two maxima) starting at t = 0.4 s due to the stretching of the plug because of cross-flow velocity gradient of the induced hydrodynamic effect and diffusion of the species in the spanwise direction. Hence, the pressure gradients induced due to the material transition greatly enhance the species dispersion.
Fig. 6.

Average concentration profiles of concentration in a PMMA–PC material transition and 0% geometrical transition.
5.3. Effect of combined material and geometrical transitions
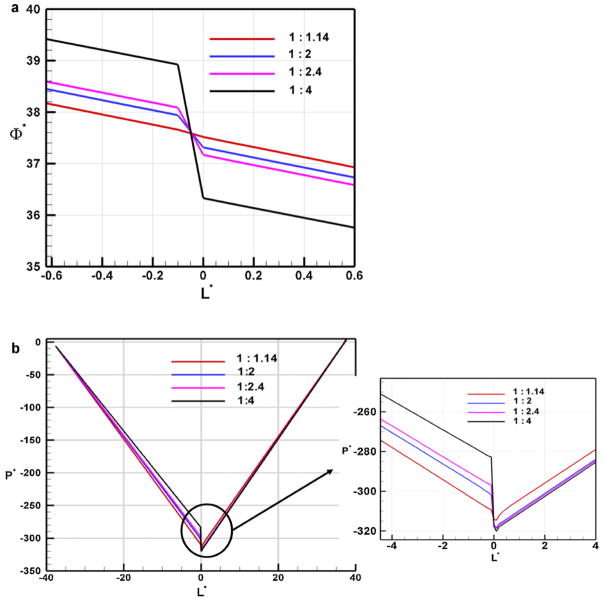
The case of combined material and geometrical transition can frequently arise when bonding the interconnect to the chip or when two microfluidic chips are connected together directly. In order to simulate this effect, geometrical transitions corresponding to 13%, 50%, 58% and 75% reduction in the available flow area were introduced at the PMMA–PC material transition. Fig. 7(a) shows the comparison of non-dimensional pressure variation along the length of the channel for different flow area ratio’s while Fig. 7(b) shows the non-dimensional potential variation along the channel. The values of and for various flow area ratios A2:A1 are summarized in Table 2. In order to develop a correlation to predict the flow rate in the presence of a combined material and geometrical transition, the values of and are curve fitted with area ratio A2/A1 as the independent variable. The equations for and are given by
Fig. 7.
(a) Nondimensional potential variation in a combined material and geometrical transition for various transition ratios. (b) Nondimensional pressure variation in a combined material and geometrical mismatch for various transition ratios.
Table 2.
Simulated non-dimensional potential and pressure variation as a function of available flow area ratio A2:A1.
| A2:A1 |
|
|
||
|---|---|---|---|---|
| 1:1 | 0 | 0 | ||
| 1:1.14 | 0.14 | −2.65 | ||
| 1:2 | 0.62 | −15.8 | ||
| 1:2.4 | 0.92 | −20.2 | ||
| 1:4 | 2.6 | −35.45 |
| (18) |
| (19) |
Substituting Eqs. (18) and (19) in Eq. (15) we can predict the flowrate for any given aspect ratio AR and geometric transition ratio A2/A1. It should be noted that using the above correlations, Eq. (15) can be used to estimate the flow rate in all the three cases: (a) uniform channel with only geometrical transition (b) material transition with no geometrical change (i.e. only ζ-potential variation) and (c) combined material and geometrical transition.
The feasibility of applying the above equations to estimate the flow rate in the presence of a combined material and geometrical mismatch was investigated by considering a channel completely made of PMMA (i.e. PMMA–PMMA) with an aspect ratio AR = 1 and mismatch ratio A2/A1 = 0.25. The values of and from the above equations are 2.59 and −35.42 respectively. Substituting these values, the volumetric flow rate predicted by Eq. (15) was Q = 2.46 nL s−1. For validation purposes, a numerical simulation was performed in a channel with similar conditions i.e. made of PMMA with an aspect ratio AR = 1, mismatch ratio A2/A1 = 0.25 with an applied potential of 220V. The length of both halves of the channel was maintained at the ratio L2 = 3.27L1. The flow rate from the simulation was Q = 2.49 nL s−1 which is in good agreement with the predicted flow rate and differs by about 1%.
Additional simulations were performed by varying the amount of geometric transition ratio at the PMMA–PC or PC–PMMA junction and the resulting flow rates are summarized in Table 3. The percentage reduction due to geometrical mismatch is shown in Fig. 8 and was calculated as (1 − (QA2:A1/Q1:1)) × 100 where QA2:A1 is the flow rate with a geometric mismatch ratio A2:A1 while Q1:1is the flow rate in the absence of a geometric mismatch. It can be seen that there is a 6.54% decrease in flow rate for the case of A2:A1 = 1:4 when compared to the case of A2:A1 = 1:1 combined material and geometrical transition. This reduction in flow rates affect the elution time of the species in consideration and the effect is compounded when multiple channels with geometric or material transitions are present on the integrated microfluidic chip, thereby greatly affecting the separations efficiency in applications where the need to minimize dispersion and elution delays is a critical criterion.
Table 3.
Variation of flow rate in a combined material and geometrical mismatch at an applied potential of 88 V for different flow area ratios.
| A2:A1 | Flow rate (nLs−1) |
|---|---|
| 1:1 | 6.98 |
| 1:1.14 | 6.96 |
| 1:2 | 6.83 |
| 1:2.4 | 6.76 |
| 1:4 | 6.52 |
Fig. 8.
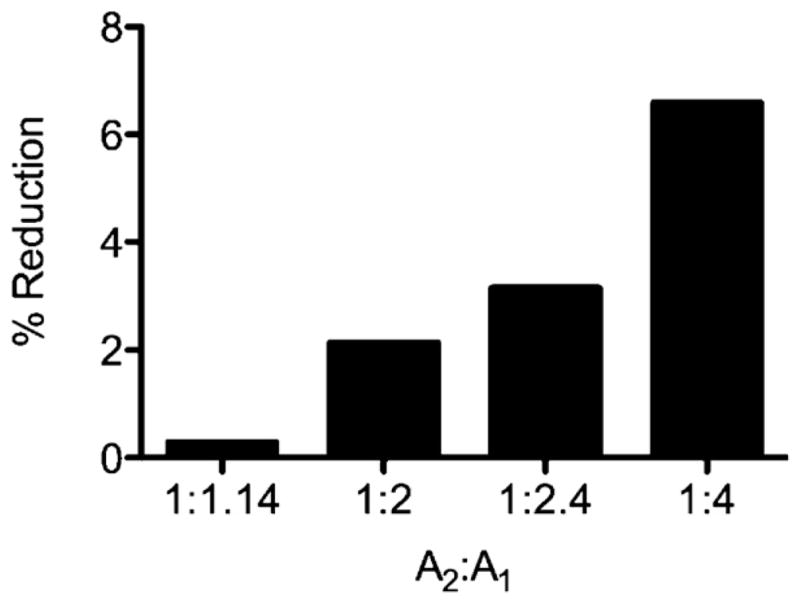
Flow rate reduction (%) in a combined material and geometrical mismatch for varying flow area ratios A2:A1.
The effect of combined material and geometrical transition on the species progression is depicted in Fig. 9 where the plug is drastically dispersed due to the presence of geometric transition in addition to the material transition. Additional simulations also showed (data not shown) that the effect of combined material and geometrical mismatch on the sample plug was relatively small for geometric transition magnitudes less than 13% but becomes pronounced as flow area ratio increases.
Fig. 9.
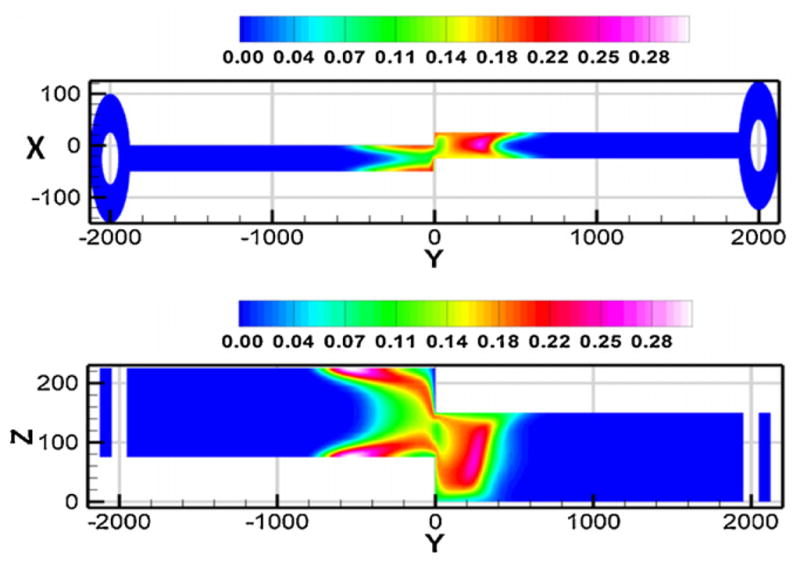
Slice planes showing the disruption of the plug in a combined material and geometrical transition i.e. having a PMMA–PC material transition as well as a geometric transition with area ratio A2:A1 = 1:4.
6. Conclusions
We have performed various numerical simulations to investigate the effect of material and geometrical transition in electrokinetic flows both on the flow and the progression of a species plug. The effect of only geometrical transition in electrokinetic flows was less compared to material transition as expected, but its effect becomes pronounced as the flow restriction increases due to induced pressure gradients even in a uniform channel (i.e. no ζ-potential variations). A decrease in the flow rate was observed as the flow area at the mismatch interface increased. This decrease of flow rate becomes compounded and can greatly affect the elution time of species in electrophoretic separations when multiple channels with several transitional zones are present on the integrated microfluidic device. The effect of combined material and geometrical mismatch resulted in both disruption of the species plug and reduced flow rates. Sample re-concentration because of induced hydrodynamic effects was observed in the case of material mismatch (i.e. change in ζ-potential). This feature could be exploited to improve detection capabilities in interconnected lab-on-chip devices. The developed correlations could be used for estimation of pressure drop, potential drop and flow rate reduction in the presence of material and geometrical transition arising during assembly of modular microfluidic devices. Based on simulations, as a design guideline a 13% geometrical transition can be tolerated without significant loss of sample resolution in electrokinetic flows but a higher geometrical mismatch is detrimental and can greatly affect efficiency of electrophoretic separations.
Supplementary Material
HIGHLIGHTS.
Combined material and geometrical transition in electrokinetic flows was studied.
Material and geometrical transition resulted in dispersion and reduced flow rates.
Effect of only geometrical transition on species was less compared to material transition.
Sample dispersion was quantified with standard metrics.
Correlations were developed to estimate the reduction in flow rates.
Acknowledgments
This work was supported by a Bioengineering Research Partnership (NIH R24-EB002115) through the National Human Genome Research Institute (NHGRI), the National Cancer Institute (NCI) of the National Institutes of Health (NIH), and partially funded by National Science Foundation under Grant EPS-0346411 and the State of Louisiana Board of Regents Support Fund.
Appendix A. Supplementary data
Supplementary data associated with this article can be found, in the online version, at http://dx.doi.org/10.1016/j.aca.2013.01.047.
References
- 1.Pal R, Yang M, Lin R, Johnson BN, Srivastava N, Razzacki SZ, Chomistek KJ, Heldsinger DC, Haque RM, Ugaz VM, Thwar PK, Chen Z, Alfano K, Yim MB, Krishnan M, Fuller AO, Larson RG, Burke DT, Burns MA. Lab Chip. 2005;5:1024. doi: 10.1039/b505994a. [DOI] [PubMed] [Google Scholar]
- 2.Shaikh KA, Ryu KS, Goluch ED, Nam JM, Liu J, Thaxton CS, Chiesl TN, Barron AE, Lu Y, Mirkin CA, Liu C. Proc Natl Acad Sci USA. 2005;102:9745. doi: 10.1073/pnas.0504082102. [DOI] [PMC free article] [PubMed] [Google Scholar]
- 3.Hashimoto M, Barany F, Soper SA. Biosens Bioelectron. 2006;21:1915. doi: 10.1016/j.bios.2006.01.014. [DOI] [PubMed] [Google Scholar]
- 4.Adrover A, Giona M, Pagnanelli F, Toro L. Appl Surf Sci. 2007;253:5785. [Google Scholar]
- 5.You BH, Chen PC, Park DS, Park S, Nikitopoulos DE, Soper SA, Murphy MC. J Micromech Microeng. 2009;19:125025. [Google Scholar]
- 6.Fiorini GS, Chiu DT. Biotechniques. 2005;38:429. doi: 10.2144/05383RV02. [DOI] [PubMed] [Google Scholar]
- 7.Herr AE, Molho JI, Santiago JG, Mungal MG, Kenny TW, Garguilo MG. Anal Chem. 2000;72:1053. doi: 10.1021/ac990489i. [DOI] [PubMed] [Google Scholar]
- 8.Andreev VP, Dubrovsky SG, Stepanov YV. J Microcolumn Sep. 1997;9:443. [Google Scholar]
- 9.Bianchi F, Wagner F, Hoffmann P, Girault HH. Anal Chem. 2001;73:829. doi: 10.1021/ac0011181. [DOI] [PubMed] [Google Scholar]
- 10.Aniruddha P, Chong HA. J Micromech Microeng. 2002;12:35. [Google Scholar]
- 11.Jaffer S, Gray BL, editors. Microfluidics, BioMEMS, and Medical Microsystems V. 1. SPIE; San Jose, CA, USA: 2007. p. 64650P. [Google Scholar]
- 12.Subhra Datta SGNAP. Electrophoresis. 2006;27:611. doi: 10.1002/elps.200500618. [DOI] [PubMed] [Google Scholar]
- 13.Ren L, Li D. J Colloid Interf Sci. 2001;243:255. [Google Scholar]
- 14.Lee JSH, Ren CL, Li D. Anal Chim Acta. 2005;530:273. [Google Scholar]
- 15.Krishnamoorthy S, Feng J, Henry A, Locascio L, Hickman J, Sundaram S. Microfluid Nanofluid. 2006;2:345. [Google Scholar]
- 16.Ghosal S. J Fluid Mech. 2002;459:103. doi: 10.1017/jfm.2012.76. [DOI] [PMC free article] [PubMed] [Google Scholar]
- 17.Fu LM, Lin JY, Yang RJ. J Colloid Interf Sci. 2003;258:266. doi: 10.1016/s0021-9797(02)00078-4. [DOI] [PubMed] [Google Scholar]
- 18.Erickson D, Li D. J Phys Chem B. 2003;107:12212. [Google Scholar]
- 19.Erickson D, Li D. Langmuir. 2002;18:1883. [Google Scholar]
- 20.Ruijin W, Jianzhong L, Zhihua L. Biomed Microdevices. 2005;7:131. doi: 10.1007/s10544-005-1592-1. [DOI] [PubMed] [Google Scholar]
- 21.Brotherton CM, Davis RH. J Colloid Interf Sci. 2004;270:242. doi: 10.1016/j.jcis.2003.08.012. [DOI] [PubMed] [Google Scholar]
- 22.Wu ZQ, Cao XD, Chen L, Zhang JR, Xia XH, Fang Q, Chen HY. Electrophoresis. 2010;31:3665. doi: 10.1002/elps.201000258. [DOI] [PubMed] [Google Scholar]
- 23.Probstien RF. Physicochemical Hydrodynamics: An Introduction. Wiley and Sons; New York: 1994. [Google Scholar]
- 24.Zholkovskij EK, Masliyah JH, Czarnecki J. Anal Chem. 2003;75:901. doi: 10.1021/ac0203591. [DOI] [PubMed] [Google Scholar]
- 25.Israelachvili NJ. Intermolecular and Surface Forces: With Applications to Colloidal and Biological Systems. 2. Academic Press; 1992. [Google Scholar]
- 26.Stroock AD, Weck M, Chiu DT, Huck WTS, Kenis PJA, Ismagilov RF, Whitesides GM. Phys Rev Lett. 2000;84:3314. doi: 10.1103/PhysRevLett.84.3314. [DOI] [PubMed] [Google Scholar]
- 27.Kirby BJ, Hasselbrink EFJ. Electrophoresis. 2004;25:187. doi: 10.1002/elps.200305754. [DOI] [PubMed] [Google Scholar]
- 28.Levich VG. Physicochemical Hydrodynamics. Englewood Cliffs; NJ: 1962. [Google Scholar]
- 29.Chen J, Wabuyele M, Chen H, Patterson D, Hupert M, Shadpour H, Nikitopoulos D, Soper SA. Anal Chem. 2005;77:658. doi: 10.1021/ac048758e. [DOI] [PubMed] [Google Scholar]
- 30.Shadpour H, Soper SA. Anal Chem. 2006;78:3519. doi: 10.1021/ac0600398. [DOI] [PubMed] [Google Scholar]
- 31.Patankar NA, Hu HH. Anal Chem. 1998;70:1870. doi: 10.1021/ac970846u. [DOI] [PubMed] [Google Scholar]
- 32.Desmet G, Baron GV. J Chromatogr A. 2002;946:51. doi: 10.1016/s0021-9673(01)01546-1. [DOI] [PubMed] [Google Scholar]
- 33.Mateusz LH, Guy WJ, Shawn DL, Hamed S, Sudheer R, Dimitris EN, Steven AS. Microfluid Nanofluid. 2007;3:1. [Google Scholar]
- 34.Ermakov SV, Jacobson SC, Ramsey JM. Anal Chem. 2000;72:3512. doi: 10.1021/ac991474n. [DOI] [PubMed] [Google Scholar]
- 35.Tennekes H, Lumley JL. A First Course in Turbulence. The MIT Press; Cambridge, Massachusetts and London, England: 1994. [Google Scholar]
Associated Data
This section collects any data citations, data availability statements, or supplementary materials included in this article.


