Abstract
We are developing MRI-based attenuation correction methods for PET images. PET has high sensitivity but relatively low resolution and little anatomic details. MRI can provide excellent anatomical structures with high resolution and high soft tissue contrast. MRI can be used to delineate tumor boundaries and to provide an anatomic reference for PET, thereby improving quantitation of PET data. Combined PET/MRI can offer metabolic, functional and anatomic information and thus can provide a powerful tool to study the mechanism of a variety of diseases. Accurate attenuation correction represents an essential component for the reconstruction of artifact-free, quantitative PET images. Unfortunately, the present design of hybrid PET/MRI does not offer measured attenuation correction using a transmission scan. This problem may be solved by deriving attenuation maps from corresponding anatomic MR images. Our approach combines image registration, classification, and attenuation correction in a single scheme. MR images and the preliminary reconstruction of PET data are first registered using our automatic registration method. MRI images are then classified into different tissue types using our multiscale fuzzy C-mean classification method. The voxels of classified tissue types are assigned theoretical tissue-dependent attenuation coefficients to generate attenuation correction factors. Corrected PET emission data are then reconstructed using a three-dimensional filtered back projection method and an order subset expectation maximization method. Results from simulated images and phantom data demonstrated that our attenuation correction method can improve PET data quantitation and it can be particularly useful for combined PET/MRI applications.
Keywords: MRI, PET, registration, segmentation, classification, attenuation correction, brain imaging
INTRODUCTION
Attenuation correction accounts for radiation-attenuation properties of the tissue, which is mandatory to quantitative PET imaging and is important for visual interpretation and improved lesion detection. Before combined PET/CT, a patient-specific attenuation map was based on one or several transmission sources (either 68Ge or 137Cs). In recent years, combined PET/CT has successfully used in clinical practice. PET/CT examinations provide complementary co-registered anatomic and functional images where CT images are routinely used for attenuation correction [1, 2]. CT images are required at effective CT energies of 70–80 keV and provide a pixel-wise distribution of attenuation coefficients [3] thus yield a measure of the electron density in the image volume. In general, CT-based attenuation correction is based on a piecewise linear scaling algorithm that translates CT attenuation values into linear attenuation coefficients at 511 keV [4]. Unfortunately, CT does not provide the excellent soft-tissue contrast as compared to MRI and CT also adds radiation dose to the examination.
In recent years, combined PET/MRI is an active research area. Unfortunately, the present design of hybrid PET/MRI does not offer attenuation correction using a transmission scan. This problem may be solved by deriving attenuation maps from corresponding anatomic MR images. MRI signals are not one-to-one related to the electron density information that is needed for attenuation correction of PET images. A direct mapping of attenuation values from available MR images is challenging [5, 6]. For this purpose, our group developed an attenuation correction method based on segmented MRI. This approach combines image registration, classification, and attenuation correction in a single, automatic scheme. It can provide a useful tool for quantitative image analysis for combined PET/MRI applications.
METHOD
The attenuation correction method includes several key steps. First, MR images and the preliminary reconstructed PET images are registered using our automatic, normalized mutual information (NMI)-based registration method. Second, the registered images are segmented into air, scalp, skull, and brain tissue using our deformable model-based minimal path segmentation method. Third, the MRI images are classified into different tissue types (air, skull, gray matter (GM), white matter (WM), and cerebrospinal fluid (CSF) using our modified multi-scale fuzzy C-mean classification (MsFCM) method. Fourth, the voxels of different tissue types are assigned theoretical tissue-dependent attenuation coefficients followed by Gaussian smoothing. Fifth, the MRI-derived attenuation map is then forward projected to generate attenuation correction factors (ACFs) that are used for correcting the PET emission sinograph data. Finally, the attenuation corrected emission data are reconstructed using a three-dimensional filtered back projection (FBP) method or an ordered subset expectation maximization (OSEM) method.
Registration of MRI and PET images
Our registration method for PET and MRI images was described in our early paper [7]. This registration method is based on an automatic, normalized mutual information (NMI) algorithm. We used NMI because it does not require a linear relationship between the intensity values of the two images and because it is suitable for multimodality image registration. One image R is the reference and the other F is floating. Their normalized mutual information (NMI) is given by the following equation.
| (1) |
where
The joint probability pRF (r, f) and the marginal probabilities pR (r) of the reference image and pR (f) of the floating image can be estimated from the normalized joint intensity histograms. When two images are geometrically aligned, NMI is maximal. Where floating image is MRI and PET image is the reference.
Segmentation of brain MR images
Our brain segmentation method used our minimal path segmentation method [8, 9], which detects the contours with a new energy function and a deformable model. We used dynamic programming and a minimal path segmentation approach to detect the optimal path within a weighted graph between two end points. We used an energy function to combine distance and gradient information to guide the marching curve and thus evaluate the best path and span a broken edge. We developed an algorithm to automate the placement of initial end points. Dynamic programming was used to automatically optimize and update end points in the procedure of searching curve. A deformable model was generated using principle component analysis (PCA) and it was used as the prior knowledge for the selection of initial end points and for the evaluation of the best path.
The traditional energy function of snake is proposed by Kass et al [10]. as follows:
| (2) |
Where α, β and λ denote real positive weighting constants; Ω∈[0,1] is parameterization interval for the contour; ∇I represents the image gradient. Given a set of constants α, β and λ, the function can be solved and the segmented contour C is obtained.
In this paper, we modify this function to design a new minimal path approach for contour extraction. In order to improve the robustness of the segmentation method, we incorporated distance and gradient information into an energy function to guide the marching curve toward the best path and span the broken edge. In our method, one term was added to the energy function, which represents the gradient information from the original image. Therefore, the energy function is
| (3) |
Where α, β and γ are real positive weighting constants which balance the forces, Ω denotes the current curve body, Emod el can be calculated using the Bayes’ Rule and the maximum posteriori probability (MAP) function,
| (4) |
where the first term denotes the degree of the curve C in the distance map, which is the Euclidean length of the curve C; the second item denotes the gradient of the original image, which is used to regulate the searching when the distance map is not enough for guiding the curve in case of noises or lack of a clear edge. λ1 and λ2 denote the weights of the distance and gradient information.
When segmenting or localizing an anatomical structure, prior knowledge is usually helpful. Use of prior knowledge in a deformable model can lead to more robust and accurate results [11, 27]. The prior information is used to constrain the actual deformation of the contour or surface to extract shapes consistent with the training data that were used for the prior model.
Classification of tissue types on MR images
The classification method was recently reported by us [10]. Before image classification, anisotropic diffusion filtering is applied to process MR images in a multiscale space. This filtering processing method will smooth intra-region image signals and preserve the inter-region edge. Anisotropic diffusion filtering is a partial differential diffusion equation model described as
| (5) |
xi is the MR image intensity at the position i, x(i, t) stands for the intensity at the position i and the time t or the scale level t; ∇ and div are the spatial gradient and divergence operator. c(xi, t) is the diffusion coefficient and is chosen locally as a function of the magnitude of the image intensity gradient
| (6) |
The constant ω is referred as the diffusion constant and determines the filtering behavior.
The multiscale approach represents a series of images with different levels of spatial resolution. General information is extracted and maintained in large-scale images, and low-scale images have more local tissue information. The multiscale approach can effectively improve the classification speed and can avoid trapping into local solutions. Anisotropic diffusion is a scale space, adaptive technique which iteratively smoothes the images as the time t increases. Our multiscale description of images is generated by the anisotropic diffusion filter. The time t is considered as the scale level and the original image is at the level 0. When the scale increases, the images become more blurred and contain more general information. Unlike many multi-resolution techniques where the images are down-sampled along the resolution, we kept the image resolution along the scales.
After anisotropic diffusion filtering processing, our multiscale fuzzy C-means algorithm (MsFCM) performs classification from the coarsest to the finest scale, i.e. the original image. The classification result at a coarser level t+1 was used to initialize the classification at a higher scale level t. The final classification is the result at the scale level 0. During the classification processing at the level t+1, the pixels with the highest membership above a threshold are identified and assigned to the corresponding class. These pixels are labeled as training data for the next level t.
The objective function of the MsFCM at the level t is
| (7) |
Where uik stands for the membership of the pixel i belonging to the class k, and vk is the vector of the center of the class k, xi represents the feature vectors from multi-weighted MR images, Ni stands for the neighboring pixels of the pixel i. The objective function is the sum of three terms where α and β are scaling factors that define the effect of each factor term. The first term is the objective function used by the conventional fuzzy C-means method, which assigns a high membership to the pixel whose intensity is close to the center of the class. The second term allows the membership in neighborhood pixels to regulate the classification toward piecewise-homogeneous labeling. The third term is to incorporate the supervision information from the classification of the previous scale. is the membership obtained from the classification in the previous scale.
The classification is implemented by minimizing the objective function J. MsFCM is an iterative algorithm that requires an initial estimation of the class types. In general, proper selection of the initial classification will improve the clustering accuracy and can reduce the number of iterations. As noise has been effectively attenuated by anisotropic filtering at the coarsest image, the k-means method is used on the coarsest image to estimate the initial class types. After intra-region smoothing by anisotropic diffusion filtering, the edge pixels have a significantly higher gradient than the pixels within the clusters. A gradient threshold is set to remove the edge pixels, and the remaining pixels go to the K-means classification for initialization.
Attenuation coefficients
Once the MR images are classified into different tissue types using our MsFCM technique, the attenuation coefficients of different tissue types are selected according literatures [1, 3, 5, 6] e.g. air = 0.0, scalp = 0.0922, skull = 0.143, gray matter = 0.0988, white matter = 0.0993, CSF = 0.0887, and nasal sinuses = 0.0536 (cm−1). We then assign attenuation coefficients to these regions followed by Gaussian smoothing [11]. The MRI-derived attenuation map was then forward projected to generate attenuation correction factors (ACFs) to be used for correcting the PET emission data at appropriate angles of the resulting attenuation map. Finally, the original PET sinogram and attenuation map are combined to generate the correction PET sonogram.
PET Reconstruction
In our attenuation correction method, we used two reconstruction approaches, i.e. ordered subset expectation maximization (OSEM) and filter back projection (FBP) methods. As OSEM is more computation intensive compared to FBP, the preliminary PET images were reconstructed by FBP in order to save time. The final corrected emission data was reconstructed using the OSEM method in order to get high-quality PET images. The FBP method uses a Hann filter with a cutoff frequency of 0.35. The OSEM method uses a subset of 14 and an iteration number of 12.
EXPERIMENT AND RESULTS
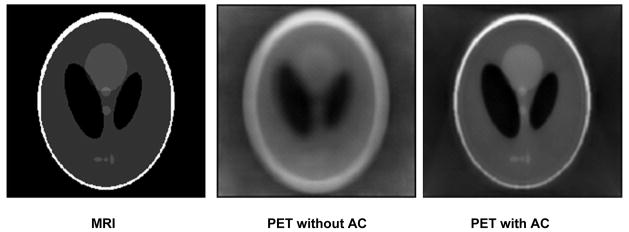
The MRI-guided attenuation correction method has been evaluated on simulated PET and MRI images. Figure 1 shows the result from simulated phantom images. After our attenuation correction processing, the PET image was improved (the image on the right). The attenuated signals at the center of the image were corrected. The object edges became clearer on the corrected image compared to those on the uncorrected image.
Figure 1.

Attenuation correction results on simulated MRI and PET images
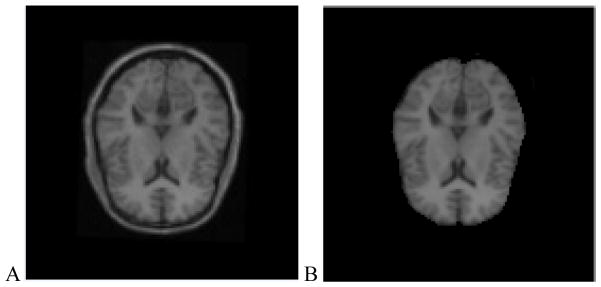
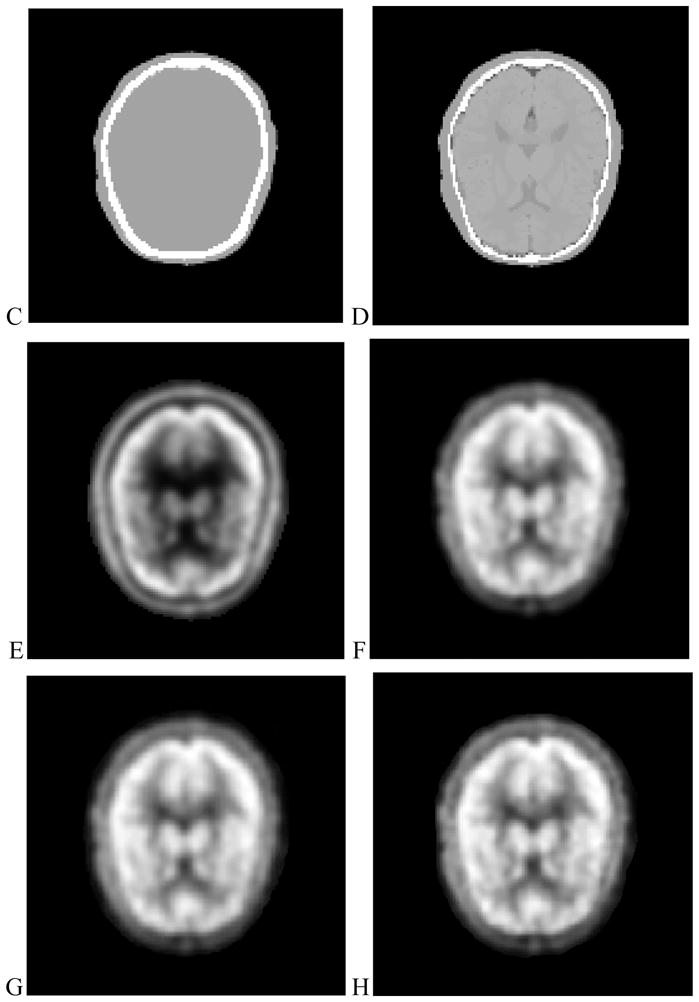
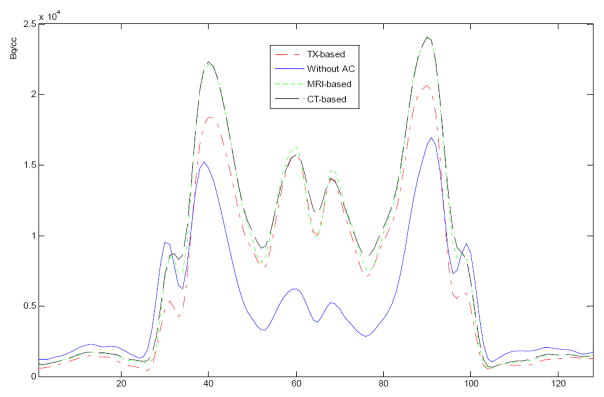
The attenuation correction method has been evaluated with brain CT, MRI and PET data from the brain PET-SORTEO database [12]. Figure 2 shows the result from the brain images. Visual inspection shows that the corrected PET image has bright signals at the center of the brain compared to a relatively dark region on the uncorrected image. Corrected PET images based on either CT images or MRI images have higher image quality than those images based on transmission images. However, the results from the CT-based and MRI-based methods are similar without visual difference. Figure 3 shows the line of profile through the PET images using different attenuation correction approaches. The PET image with attenuation correction is better than that without attenuation correction. The result shows that our MRI-based method performs similar to the CT-based approach in these data.
Figure 2.


MRI–PET image registration, segmentation, classification, and attenuation process. (A) MR images after registration, (B) MR images after segmentation. (C) Attenuation map based on CT images. (D) Attenuation map based on MRI. (E) PET image without attenuation correction. (F) PET image based on transmission images. (G) PET image based on CT images. (H) PET image based on MRI.
Figure 3.

Lines of profile on PET images with and without attenuation correction. Solid line is without correction. Dashed and dotted lines are based on CT and MRI, respectively. The profiles from MRI- and CT-based attenuation correction are close and both demonstrate clear edges compared to the profile from transmission image-based correction (TX-based). The profile without correction has low signals at the center of the brain.
DISCUSSIONS AND CONCLUSIONS
We incorporated image registration, segmentation and classification algorithms into an MRI-guided attenuation correction approach. The results from simulated data and database images show that PET image quality was improved with our MRI-based attenuation correction method and that the MRI-based method performed similar as compared to the CT-based method. Our MRI-based attenuation correction could be applied to combined PET/MRI applications. We are planning real human experiments with our combined PET/MRI system in the next few months.
References
- 1.Zaidi H, Montandon M-L, Slosman DO. Magnetic resonance imaging-guided attenuation and scatter corrections in three-dimensional brain positron emission tomography. Med Phys. 2003;30:937–948. doi: 10.1118/1.1569270. [DOI] [PubMed] [Google Scholar]
- 2.Zaidi H, Hasegawa BH. Determination of the attenuation map in emission tomography. J Nucl Med. 2003;44:291–315. [PubMed] [Google Scholar]
- 3.Zaidi Habib, Montandon Marie-Louise. Advances in Attenuation Correction Techniques in PET. J PET Clin. 2007:191–217. doi: 10.1016/j.cpet.2007.12.002. [DOI] [PubMed] [Google Scholar]
- 4.Hofmann M, Steinke F, Scheel V. MRI-based attenuation correction for PET/MRI: a novel approach combining pattern recognition and atlas registration. J Nucl Med. 2008;49:1875–1883. doi: 10.2967/jnumed.107.049353. [DOI] [PubMed] [Google Scholar]
- 5.Hofmann M, Pichler B, Scholkopf B, Beyer T. Towards quantitative PET/MRI: a review of MR-based attenuation correction techniques. Eur J Nucl Med Mol Imaging. 2008 doi: 10.1007/s00259-008-1007-7. [DOI] [PubMed] [Google Scholar]
- 6.Beyer T, et al. MR-based attenuation correction for torso-PET/MR imaging: pitfalls in mapping MR to CT data. Eur J Nucl Med Mol Imaging. 2008;35:1142–1146. doi: 10.1007/s00259-008-0734-0. [DOI] [PubMed] [Google Scholar]
- 7.Fei B, Wang H. Deformable and rigid registration of MRI and microPET images for photodynamic therapy of cancer in mice. Med Phys. 2006;33:753–760. doi: 10.1118/1.2163831. [DOI] [PubMed] [Google Scholar]
- 8.Li Ke, Fei Baowei. A New 3D Model-Based Minimal Path Segmentation Method for Kidney MR Images. IEEE Bioinformatics and Biomedical Engineering, the 2nd International Conference on; 2008. pp. 2342–2344. [DOI] [PMC free article] [PubMed] [Google Scholar]
- 9.Li Ke, Fei Baowei. A Deformable Model-based Minimal Path Segmentation Method for Kidney MR Images. Medical Imaging 2008: Image Processing. 2008;6914:69144F. doi: 10.1117/12.772347. [DOI] [PMC free article] [PubMed] [Google Scholar]
- 10.Kass M, Witkin A, Terzopoulos D. Snake: Active contour models. Int J Comput Vis. 1987;4:321–331. [Google Scholar]
- 11.Wang Hesheng, Fei Baowei. Medical Image Analysis. 2008. A modified fuzzy C-means classification method using a multiscale diffusion filtering scheme. [DOI] [PMC free article] [PubMed] [Google Scholar]
- 12.Mesina CT, et al. Effects of attenuation correction and reconstruction method on PET activation studies. Neuroimage. 2003;20:898–908. doi: 10.1016/S1053-8119(03)00379-3. [DOI] [PubMed] [Google Scholar]
- 13.Reilhac A, Batan G, Michel C. PET-SORTEO: validation and development of database of Simulated PET volumes. Nuclear Science, IEEE Transactions on. 2005;52(5):1321–1328. [Google Scholar]


