Abstract
Purpose
Endovascular coiling of cerebral aneurysms remains limited by coil compaction and associated recanalization. Recent coil designs which effect higher packing densities may be far from optimal because hemodynamic forces causing compaction are not well understood since detailed data regarding the location and distribution of coil masses are unavailable. We present an in vitro methodology to characterize coil masses deployed within aneurysms by quantifying intra-aneurysmal void spaces.
Methods
Eight identical aneurysms were packed with coils by both balloon- and stent-assist techniques. The samples were embedded, sequentially sectioned and imaged. Empty spaces between the coils were numerically filled with circles (2D) in the planar images and with spheres (3D) in the three-dimensional composite images. The 2D and 3D void size histograms were analyzed for local variations and by fitting theoretical probability distribution functions.
Results
Balloon-assist packing densities (31±2%) were lower (p=0.04) than the stent-assist group (40±7%). The maximum and average 2D and 3D void sizes were higher (p=0.03 to 0.05) in the balloon-assist group as compared to the stent-assist group. None of the void size histograms were normally distributed; theoretical probability distribution fits suggest that the histograms are most probably exponentially distributed with decay constants of 6–10 mm. Significant (p<=0.001 to p=0.03) spatial trends were noted with the void sizes but correlation coefficients were generally low (absolute r<=0.35).
Conclusion
The methodology we present can provide valuable input data for numerical calculations of hemodynamic forces impinging on intra-aneurysmal coil masses and be used to compare and optimize coil configurations as well as coiling techniques.
Keywords: Histogram, Exponential distribution, Porous media, Stent, Balloon, Silicone model
INTRODUCTION
Aneurysmal subarachnoid hemorrhage (SAH) affects between 25,000 to 33,000 people annually in the US and has a worldwide incidence of 10.5/100,000 [1, 2]. Advances in the medical and surgical management of SAH have resulted in a dramatic decline in hospital mortality [3, 4]. Nevertheless, SAH remains a major cause of premature mortality, accounting for 2 – 5% of all strokes [5], 5% of all deaths from stroke, and 27% of all stroke-related potential years of life lost before age 65 [6]. The 30-day mortality rate of subarachnoid hemorrhage (SAH) is 45% with 10% of individuals dying at onset and 25% within 24 hrs. It is estimated that the prevalence of undiagnosed cerebral aneurysms in the worldwide adult population is 2% [7]. An estimated 80% of SAH cases are attributed to ruptured cerebral aneurysms [8]. Left untreated, the risk of rebleeding of ruptured aneurysms is around 4% in the first day after SAH [9], decreases to 1% to 2% in the following weeks, and accumulates to 30% to 50% over the first 3 months [10]. When a cerebral aneurysm is diagnosed, it can be treated in several ways. Surgical clipping and endovascular coil embolization are two popular options.
Endovascular coil embolization was first introduced in the early 1990s [11–14] as a means of treatment for patients at high surgical risk. The international subarachnoid aneurysm trial (ISAT), a multicenter randomized trial involving more than 2000 patients, found that surgical treatment was associated with higher rates of poor neurologic outcome defined as modified Rankin score of 3–6 in 31% of surgical patients as opposed to 23% of coiling patients. However, the ISAT trial also reported that endovascular procedures had a higher risk of recurrence and late rebleeding at 1 year than neurosurgical clipping procedures [15].
The ultimate goal of coil embolization is the occlusion of the aneurysm and its exclusion from the parent vessel and the circulation, eventually eliminating aneurysmal inflow with thrombosis being an important intermediate step of this process. Endovascular coiling of cerebral aneurysms has been largely successful, but the phenomena of coil compaction and aneurysm recanalization remain limiting factors with recurrence rates of around 20%,[16] but as high as 80% [17] having been reported in the literature. One factor that may contribute to recurrence after coiling is poor packing density of coils within the aneurysmal sac. Coil compaction and aneurysm recanalization are largely caused by hemodynamic impingement forces with every cardiac cycle either directly on the coil mass or at the interface between the coil mass and the aneurysm wall. Aneurysm recanalization may be detected through periodic angiographic follow-ups and requires possible aneurysm re-treatment; a meta-analysis suggests half of recurred aneurysms require re-treatment (20% recurrence rate and 10% re-treatment rate).[16]
Compaction of the coil mesh is largely a physical phenomenon and has been intuitively attributed to the “water hammer” effect of the pulsatile blood flow. While intuition serves to illustrate the phenomenon, the more accurate description is the impulse force generated by systolic blood impingement or change in the direction of blood flow momentum. It has been shown that compaction almost exclusively occurs in the first 6 months after coil placement and that large aneurysm size is the most important risk factor for compaction [18]. Smaller dome and neck sizes and larger dome-to-neck ratios correlate well with treatment success [19, 20]. Aneurysms with neck diameters less than 4 mm have been associated with 83 to 85% complete thrombosis rate compared to 15 to 55% of aneurysms with necks 4 mm or greater [21, 22]. Furthermore, aneurysms with a dome-to-neck ratio of 2.0 or more were associated with an occlusion rate of 77%, whereas the occlusion rate was only 53% if the dome-to-neck ratio was less than 2.0 [19].
Prediction of compaction post-coiling is difficult but it was shown that the probability of compaction was significantly higher when the coil packing ratio was under 50% [23]. However, dense packing is subjective, depending on the skill of the operator and on unreliable radiographic observations based on the radio-opacity of the coil mass. Conventionally, the effectiveness of coiling has been characterized by the packing density measure, which is the ratio of the total volume of coils inserted into the aneurysm and the volume of the aneurysm [24–27]. This is one quantitative measure, amongst others, that correlates with compaction rates.
Lower packing densities have been correlated with higher coil compaction and associated recanalization rates [28, 29]. Therefore, aneurysms are generally coiled to maximal packing. Although it has been shown that higher packing density bears a positive correlation with low aneurysm recurrence rates, coiling techniques have not been correlated with packing density accurately [30, 31]. Wide-necked aneurysms are generally associated with an inclination of coil loops to cross the broad neck and herniate into the parent arterial lumen. This technical difficulty can result in lower packing and thus higher coil-compaction rates [32]. Coiling of wide-necked aneurysms is performed either with the temporary support of a balloon that is removed post-coiling or with the support of an intracranial stent that is implanted in the parent vessel and which traverses the aneurysm neck. Such assist devices also improve aneurysm packing densities [33].
While packing density is a useful and easily calculated measure, it is nevertheless a global variable that does not provide insight into either variability in local coil distribution or the mechanisms leading to coil compaction as a result of any non-uniform distribution. Better understanding of aneurysm re-growth requires better understanding of local coil distributions within the aneurysm. Such distributions can provide crucial information for detailed flow studies of coiled aneurysms [34, 35] and lack of this knowledge has resulted in a limited understanding of the blood flow-coil mass interaction. Coil assist by either balloon or stent can lead to different packing densities but it is not clear if, for example, coil distribution at the neck or the dome is better with stents (or balloons). Elucidation of how a coil mass is distributed inside an aneurysm with the different techniques can help answer some of these questions and help in the construction of more accurate hemodynamic investigations of coil compaction.
At present, there is limited knowledge of the relationship between coil packing density and the size distribution of the voids between the coils and the impact of such distributions on the risk of coil compaction and aneurysm recurrence. The goal of this in vitro investigation is to develop a method for quantification of the void size distribution in an experimental aneurysm that was coiled both by balloon-assist and stent-assist techniques. We use multiple specimens having identical aneurysmal geometry to evaluate the probability distribution function of void sizes and the differences in local distribution of the coil mass between the different coiling techniques.
METHODS
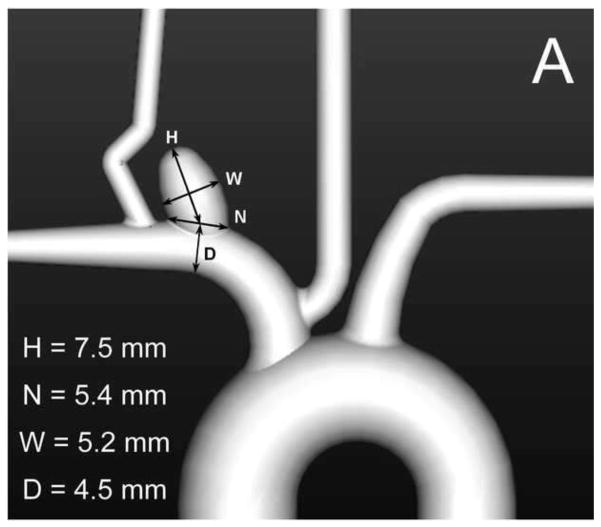
Eight identical elastomeric vascular replicas representative of the rabbit elastase-induced aneurysm model were fabricated from an implant grade silicone elastomer dispersion (Part no: 40000, Applied Silicone Corp, Santa Paula, CA) [36]. These aneurysm models were each connected to a flow apparatus driven by a peristaltic pump and placed on an angiographic table (Siemens Medical Solutions, Angiostar plus, Forchheim, Germany). All aneurysms were coiled using TruFill DCS Orbit detachable coils (Codman & Shurtleff, Raynham, MA) by one neuro-interventionalist to avoid inter-rater / operator variability. We attempted, within reason and scheduling constraints, to separate each coiling session by a period of one to two months. The coiling stopping criterion for each case was decided by the same neuro-interventionalist as in the clinical setting. Balloon-assist and stent-assist techniques were utilized in the coiling process and hence four aneurysm models were coiled by the balloon-assist technique (either Hyperform or Hyperglide balloons, Covidien, Mansfield, MA) and four were coiled via stent-assist technique (Cordis Enterprise, Codman & Shurtleff, Raynham, MA). Figure 1A shows the geometry of the aneurysm model. The packing density of each sample was calculated as the ratio of total coil volume deposited to aneurysm volume; the aneurysm volume was calculated using the ellipsoid equation as is done clinically.
Fig. 1.
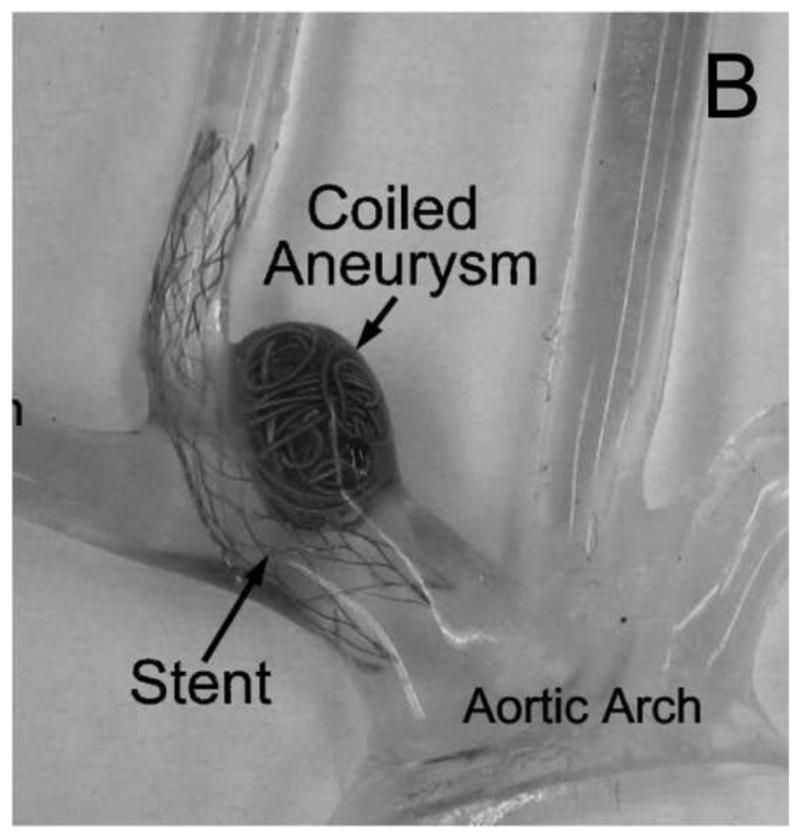
A) Geometry representative of the rabbit elastase-induced aneurysm used for the study; B) silicone replica of the geometry after stent-assisted coiling; the lumen has been filled with epoxy as a fixative
Following the coiling process, the models were drained of fluid and were dried in a closed chamber containing a hygroscopic material for 48 hours. After the samples dried, the vascular lumen including the coiled aneurysms were filled with a low viscosity epoxy and placed under vacuum to ensure that the epoxy penetrated all the gaps between the coils. Mild heating was applied to achieve complete polymerization of the epoxy. Once the epoxy inside cured, the vasculature was trimmed to retain the aneurysm and adjacent blood vessels (Figure 1B). The specimen was then positioned in a square box that was filled with industrial grade epoxy to completely embed the specimen. The epoxy-blocks were then extracted from the molding box, trimmed and marked for subsequent processing.
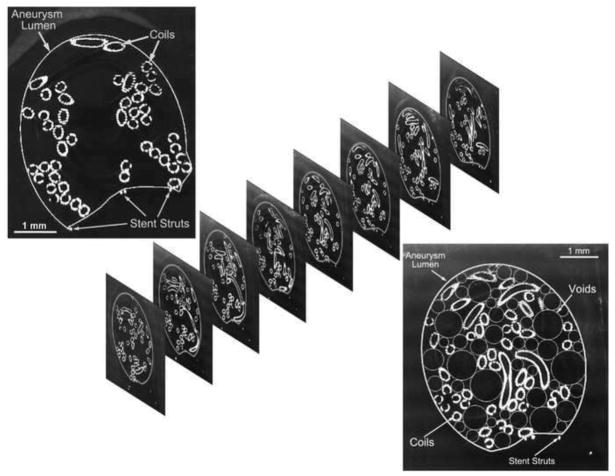
The samples where then fed to a belt sander equipped with a specially designed holding fixture mounted on a micrometer-driven traverse such that the face of each sample facing the belt was sanded down at 100 micron intervals. After each 100 micron sanding, the specimen block was removed from the holding fixture to facilitate polishing and imaging of the sanded face (Figure 2, top left inset). The holding fixture guaranteed proper repositioning of the specimen block after each imaging session. The microscope stage was also equipped with a specially designed holder to ensure proper repeatable positioning of the specimen on the stage for each imaging session. The microscope holder also angled the block such that the normal vector to the imaged surface bisected the angle between the source of incident light and the image capture camera so as to maximize reflection off the surface metal. Thus, at each interval the sanded face was imaged with a light microscope to provide a histological view of the coil distribution inside the aneurysm (Figure 2).
Fig. 2.
Top left to bottom right: image of the sanded face of a sample, a stack of such slices through the sample, and the empty space within the aneurysm lumen maximally filled with circles
Once all the images were obtained, each specimen yielded a series of images showing the coil cross sections in the plane of imaging. This stack of parallel images could then be analyzed. As a first step, analysis was conducted in the plane of each image. In each section of the aneurysm, the largest circle that could fit in the void space left by the coil mass was determined; this region was then considered to be filled and the next largest circle that could fit within the remainder of the void space was calculated. The void space was thus iteratively and optimally filled with circles (Figure 2, bottom right inset). Iterations were stopped when the largest circle that could fit in the remaining space had a diameter less than the coil wire diameter (300 microns). Each sectional image of an aneurysm was optimally filled in this manner. Similarly, the entire aneurysm volume was iteratively and optimally filled with spheres of decreasing diameter (limited to coil wire diameter, Figure 3). Representative packing density measures based on the 2D circular ( ) and the 3D spherical voids ( ) were calculated. For each aneurysm, the circle diameters were combined to provide a 2D planar histogram and the sphere diameters were combined to provide a 3D volumetric histogram of the void space within the aneurysm. Pore-size distributions have in general been characterized by the gamma (Eqn 1), lognormal (Eqn 2), or Weibull (Eqn 3) distributions [37–39]. The cumulative distribution function (cdf) of these three distributions were fit to the empirical 2D and 3D cdfs in the least-squares sense to evaluate the best-fit distribution based on residual error.
Fig. 3.
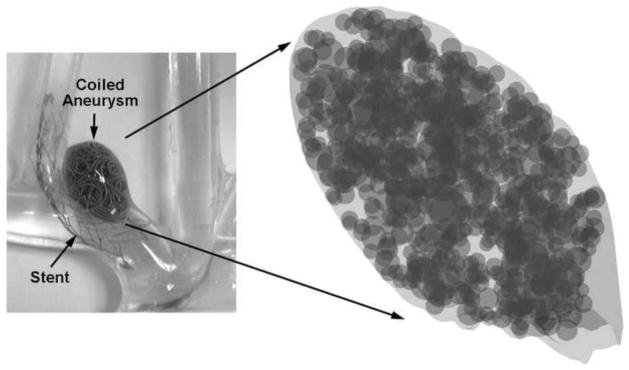
Empty space within the entire aneurysm volume maximally filled with spheres
| Eqn 1 |
| Eqn 2 |
| Eqn 3 |
The constant d0 relates to location of the distribution (translated origin) in each case, while α, σ, μ, and c are constants that define the distributions. The optimal (best-fit to data) values of these parameters were obtained and used to characterize the data sets.
The orientation of the aneurysm volume of the samples was aligned (for roll and yaw). The locations of the 2D and 3D voids were then evaluated for any trends in the distal-to-proximal and dome-to-neck directions. All image processing and analysis was done with Matlab (The Mathworks, Natick, MA). Statistical tests were conducted with either SAS (SAS Institute, Cary, NC) or Instat (Graphpad Software, La Jolla, CA).
RESULTS
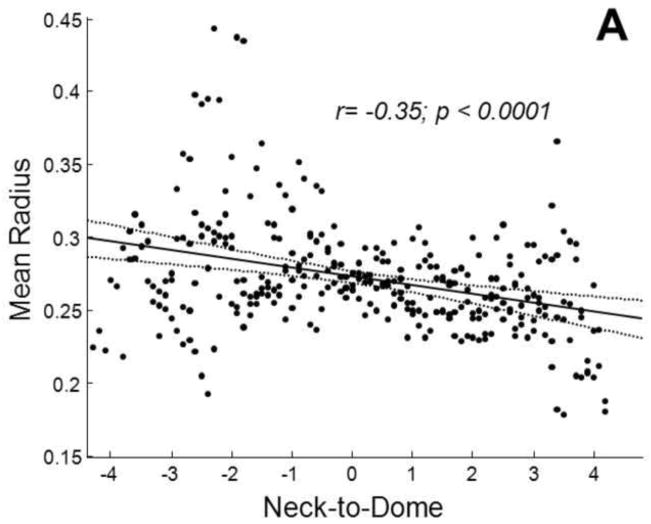
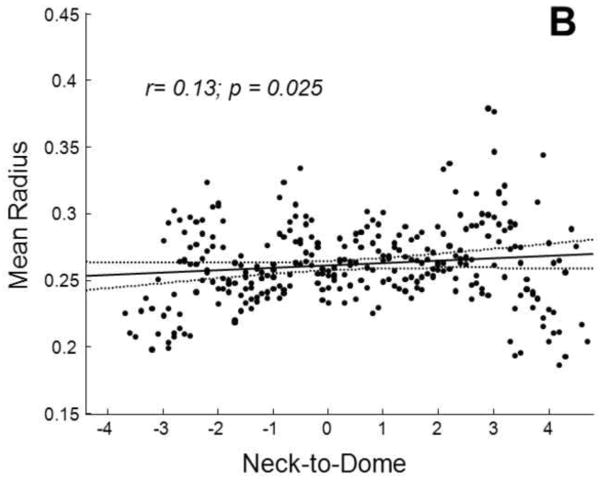
The average packing density of the stent-assist group (n=4) was significantly (t test p=0.04) higher than that of the balloon-assist group (n=4) by about 9±5% (Figure 4). Both maximum and average 2D void sizes were significantly (t test p<0.04) larger in the balloon-assist group (maximum: 2.2±0.32 mm; mean: 0.55±0.01 mm) as compared to the stent-assist group (maximum: 1.5±0.12 mm; mean: 0.53±0.01 mm). The maximum 3D void size was higher (Welch corrected t test p=0.05) with balloon-assist (1.5±0.31 mm) than with stent-assist (1±0.05 mm); the average 3D void size was significantly higher (t test p=0.03) with balloon-assist (0.42±0.01 mm) than with stent-assist (0.4±0.01 mm). The 2D and 3D mean and maximum diameters were significantly correlated to the global packing density (r ranging from −0.8 to −0.7 with p ranging from 0.01 to 0.05). The representative packing density measures based on both the 2D circular and 3D spherical voids were significantly correlated (r=0.9, p=0.004 and r=0.9, p=0.001, respectively) to the global packing density. Averages of these representative packing density measures were also significantly different between the balloon and stent groups (2D balloon 56±1%, 2D stent 62±0.05%, p=0.03; 3D balloon 73±1%, 3D stent 79±0.04%, p=0.03). Table 1 lists the significant trends in the position of 2D and 3D void sizes in the distal-to-proximal and neck-to-dome directions; Figure 5 plots two of these trends.
Fig. 4.
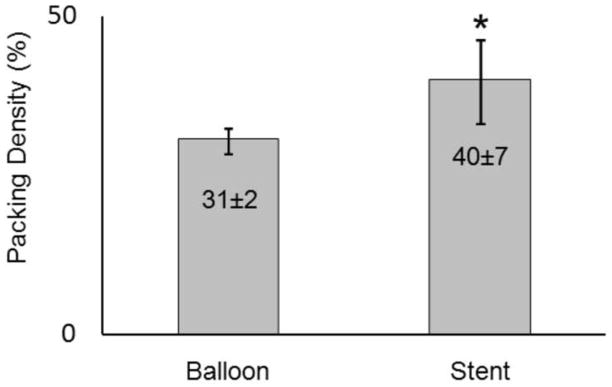
Mean packing density of the balloon-assist and stent-assist coil groups (* statistically different, t test p=0.04)
Table 1.
Correlation coefficients of trends in the void diameters in the distal-to-proximal and neck-to-dome directions; significant trends are shaded; the two rows with darker shades are plotted in Figure 5
| Correlation coefficient (r) | p value | ||||
|---|---|---|---|---|---|
| 2D Voids | Balloon-assist | Distal to Proximal | Minimum Diameter | −0.17 | 0.009 |
| Mean Diameter | −0.04 | 0.53 | |||
| Maximum Diameter | 0.20 | 0.002 | |||
| Neck to Dome | Minimum Diameter | −0.23 | <0.001 | ||
| Mean Diameter | −0.35 | <0.001 | |||
| Maximum Diameter | −0.23 | <0.001 | |||
| Stent-assist | Distal to Proximal | Minimum Diameter | −0.10 | 0.12 | |
| Mean Diameter | −0.13 | 0.05 | |||
| Maximum Diameter | 0.03 | 0.61 | |||
| Neck to Dome | Minimum Diameter | 0.17 | 0.003 | ||
| Mean Diameter | 0.13 | 0.02 | |||
| Maximum Diameter | 0.007 | 0.9 | |||
| 3D Voids | Balloon-assist | Distal to Proximal | Minimum Diameter | −0.17 | 0.01 |
| Mean Diameter | −0.15 | 0.03 | |||
| Maximum Diameter | −0.07 | 0.34 | |||
| Neck to Dome | Minimum Diameter | 0.01 | 0.83 | ||
| Mean Diameter | −0.10 | 0.09 | |||
| Maximum Diameter | −0.13 | 0.03 | |||
| Stent-assist | Distal to Proximal | Minimum Diameter | −0.19 | 0.007 | |
| Mean Diameter | −0.23 | 0.009 | |||
| Maximum Diameter | −0.09 | 0.19 | |||
| Neck to Dome | Minimum Diameter | 0.17 | 0.005 | ||
| Mean Diameter | 0.15 | 0.01 | |||
| Maximum Diameter | 0.025 | 0.67 |
Fig. 5.
Variation in the average radius of voids in the neck-to-dome direction for A) the balloon-assist group and B) the stent-assist group. Regression lines (solid) with 95% confidence intervals (dotted) are shown along with correlation coefficients
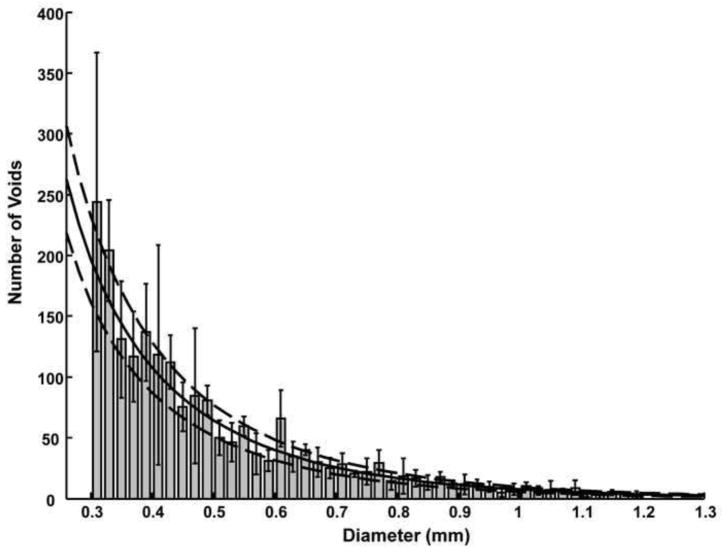
The Anderson-Darling test for normality suggests that none of the two- or three-dimensional void size data sets are normally distributed (p<0.005). Figures 6 and 7 show the average 2D and 3D void size histograms for both the assist techniques. The residual error of the Weibull distribution fit was significantly smaller (Weibull error 15–25% of lognormal error) than the lognormal distribution fit (t test p<0.02) for both the 2D and 3D void size data. The Weibull residual error was 75% of the gamma distribution error for the 3D void size data (p~1) and about 40% of the gamma distribution error for the 2D void size data (p=0.002). The chi-square goodness of fit test suggests that the data may follow all three theoretical distributions tested (non-rejection of null hypothesis that data and theoretical distributions are same). The chi-square statistic of the Weibull distribution was also significantly (p<0.001) lower than the lognormal (Weibull χ2 15% of lognormal χ2) and gamma fits (Weibull χ2 30% of gamma χ2) for the 2D void data. The chi-square statistic was not significantly different between the three distribution fits for the 3D void data. The optimized c and σ parameter values for the Weibull distribution are given in Table 2; Figure 8 shows the Weibull distribution superposed on the 2D void size distribution for the balloon-assist group.
Fig. 6.
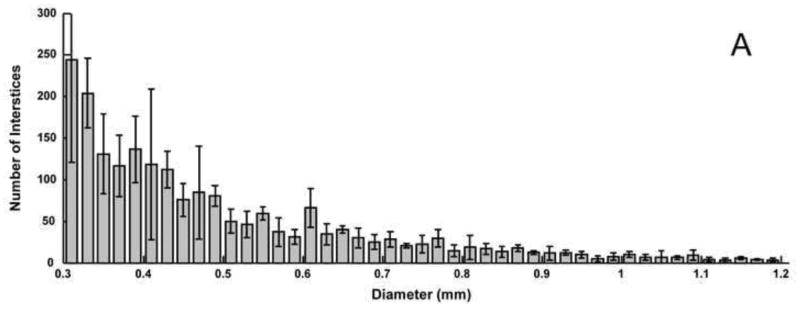
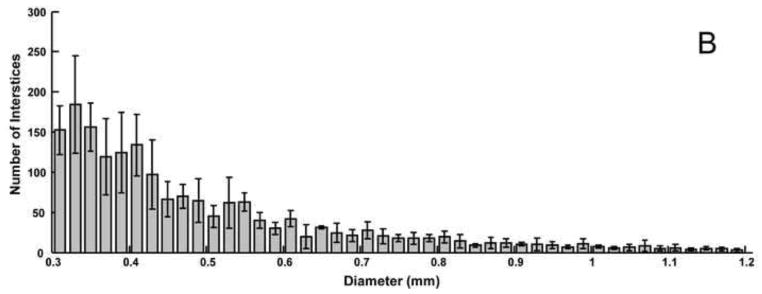
Average histograms of 2D void sizes for the A) balloon-assist and B) stent-assist groups. Voids with diameter greater than 1.2 mm are not included in the plot
Fig. 7.
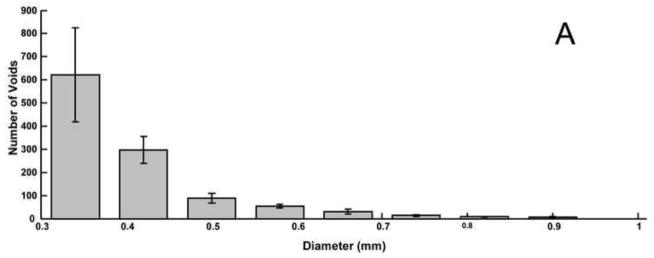
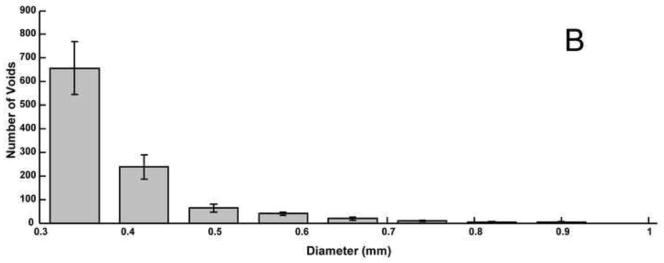
Average histograms of 3D void sizes for the A) balloon-assist and B) stent-assist groups. The bin size is wider for the 3D voids data because the images had to be reduced in size to conserve computational resources in order to calculate the 3D volumetric void locations. Voids with diameter greater than 1 mm are not included in the plot
Table 2.
Average values of the optimized parameters for the Weibull distribution fits to the 2D and 3D data sets
| Data group | c | σ(mm) |
|---|---|---|
| 2D balloon-assist | 0.82±0.04 | 0.17±0.005 |
| 2D stent-assist | 0.85±0.04 | 0.17±0.01 |
| 3D balloon-assist | 0.9±0.07 | 0.1±0.01 |
| 3D stent-assist | 1±0.12 | 0.12±0.01 |
Fig. 8.
Average Weibull distribution fit (solid line) for the balloon-assist 2D void size distribution superposed over the data set. The dashed lines are ±1 standard deviation
The Kolmogorov-Smirnov two sample test suggests that the 2D void size distributions of the stent-assist and balloon-assist groups come from the same distribution (p=0.14), but that the two 3D void size distributions differ from each other (p=0.002). The Weibull distribution fits to the 2D and 3D data sets, however, show no significant difference between the optimized parameter values of the balloon-assist and stent-assist groups (p > 0.3).
DISCUSSION
We have established an in vitro method to investigate the detailed local distribution of coil masses within aneurysms through the voids left between the coils inside the aneurysms. These results shed light on the distribution of the voids that presumably play a role in coil compaction; such distributions through the aneurysm volume have, to the best of our knowledge, not been investigated thus far. The importance of investigating intraneurysmal coil configurations in local detail is recognized in the literature. Initial in vitro studies [40, 41] quantified differences in packing densities due to different coils or coiling techniques, but more recent ones have used image analysis of in vitro [42, 33] and in vivo [43, 44] sections to quantify variables such as recanalization regions, local coil densities, neck coverage, and spatial homogeneity.
Although there is significant value to epidemiological evaluations of coiling outcome using the packing density as a variable [23–32, 45], such studies do not consider the hemodynamic forces exerted on the coil mass. A sidewall aneurysm may, for example, completely occlude at 10% packing density but the identical aneurysm at a terminal location may recanalize at 50% packing density. Some care must, therefore, be exercised when using only the packing density as a threshold parameter to determine aneurysm occlusion probability. This consideration also applies to different coil designs where three-dimensional, complex-shape, and/or thicker wire coils can provide better packing densities [45], but the void spaces left within these coils and the hemodynamic effects on the coil mass due to the distribution of these void spaces is not yet clear. For example, coils with thicker wires will tend to leave larger interstitial spaces [24]. Numerical hemodynamics studies have only recently begun to evaluate the flow regime within coiled aneurysms [34, 35], but the accuracy of these studies could be markedly improved if data on how the coils are interspersed within aneurysms were available.
Void size distributions such as those acquired here can not only provide valuable input information for hemodynamic analyses but could also be used to analyze, compare, and optimize coil deployment configurations and techniques. It is generally accepted, and has been shown [46], that successively filling aneurysms in an “onion-layer” fashion provides theoretically optimal packing densities. The voids distribution of such optimal packing is possibly discrete in terms of size (constant void diameters) and isotropic in terms of location. Void distributions of different coil configurations can thus be evaluated using this methodology and compared to the theoretical optimum.
The same methodology could be used with elastomer models derived from patient imaging data, but we chose the rabbit model to facilitate further testing of the void distributions. Repeatability is more readily achieved in the rabbit model as compared to patient data, void spaces could be correlated to histological sections of in vivo samples [44], and any predictive tests of coil compaction derived from future computational fluid dynamics studies using such void size distributions with different coil designs could be evaluated in vivo. In the aneurysm model we have used, stent-assisted coiling provided about 30% higher packing density and about 30% smaller maximum void size. As can be noted from Table 1 and underlined in Figure 5, the spatial trends in void sizes also seem to differ between the two groups, at least in the neck-to-dome direction. The larger balloon-assist voids are at the neck and reduce in size towards the dome (negative correlation coefficients), but the voids are the smallest at the neck and increase in size towards the dome in the stent-assist group (positive correlation coefficients). The statistically significant differences in these few variables suggest that stent-assisted coiling may be superior to balloon-assisted coiling in this model, but certain points need to be considered before that conclusion can be drawn. The intra-group comparison is limited by the fact that there were only 4 samples per group. Although the maximum void size was 30% smaller with stent-assist, the average void size was only about 5% smaller, even if statistically significant. The void sizes decrease from the distal to the proximal end in both groups. Moreover, the correlation coefficients of void size to location are low in general. The Kolmogorov Smirnov test suggests a difference in the 3D void size distributions between the two groups, but not the 2D distributions. Finally, the fact that the optimized Weibull distribution fit parameters are not significantly different between the two groups supports similarity of (or shows insufficient evidence to conclude a difference between) the two distributions.
Porous media are encountered in various fields such as metallurgy, materials science, fibers, filtration, petroleum engineering, and hydrogeology. Characterization of such media usually involves quantification of the spatial organization (pore connectivity or pore network structure) and estimation of some measure of pore sizes or pore size variation. This size measure is commonly quantified by fitting pore size (usually pore diameter) data to theoretical distributions.[37] Together, the spatial organization model and the size distribution model can completely represent the medium in numerical simulations; alternately, a simplified assumption of the spatial organization may be used along with the theoretical pore size distributions [47] to model the medium. Pore-size data generally follow a skewed normal distribution and, for this reason, have most effectively or commonly been modeled by the Weibull and lognormal families; [39, 48] pore size data in fibrous and filtration media have been noted to more closely follow a gamma distribution[49] because of this distribution s constant coefficient of variance. The shape parameter (variable c in Eqn 3) of the Weibull distribution also forms a power law exponent relating material strength to pore size.[50] The 2D and 3D void size distributions were thus evaluated by fitting these three theoretical models. Based on the residual error between the data and optimized distribution fits and the corresponding chi-square values, the Weibull distribution seems to fit the data better than the gamma or the lognormal distributions. Testing three distributions does not prove that the Weibull distribution is the best descriptor of the data (some samples also show a deviation from the Weibull at the extreme tails), but based on the widespread use of these models, it is reasonable to expect that void sizes left after coiling within aneurysms follow the Weibull distribution. It should be noted that when the shape parameter in the Weibull (variable c in Eqn 3) and the gamma (variable α in Eqn 1) distributions is equal to 1, these distributions reduce to the exponential distribution. With average c~0.9 and average α~1 in our data sets, the void sizes may potentially follow an exponential distribution. It can plausibly be concluded that (given our model geometry and coils chosen), void size distributions in coiled aneurysms follow an exponential decay constant (1/σ, Table 2) of 6 to 10 mm.
Some limitations of the study may be noted. Although in vitro studies allow better control and quantification, the luminal interface of elastomeric models may behave differently than in vivo models. The manner in which coils handle the parent vessel-aneurysm interface may also differ especially considering that the model we used was wide-necked. Any interaction of the coil mass to thrombus forming during the coiling session cannot easily be replicated in vitro. The effect of thrombus on void space distributions, quantification of the space between the coil mass and the luminal aneurysmal surface, or quantification of effective porosity of the coil mass at the aneurysm neck surface were not part of the current study aims and are not evaluated here. The coiling was conducted by a single interventionalist to preclude inter-operator variability, but this limits the scope of the study in the sense that different results may be obtained by different interventionalists. A single operator repeatedly coiling the same aneurysm is also subjected to a learning curve. We attempted to circumvent this learning curve by spreading the coiling sessions over a period of months (average period between sessions was 103±203 days), alternating the coil-assist methods, by blinding the operator to previous coil sizing records, and by requiring the operator to use slightly different coil sizes instead of the sizes called for during the coiling process. Although we exercised great care with the samples until they were embedded, the absence of a stent may have preferentially disturbed the coil mass in the samples of the balloon-assist group. In terms of image processing, the images had to be reduced in size by about 4 times to calculate optimal filling of the aneurysm volume with spheres in order to conserve available computational resources (after reduction, each sample took 5–6 hours on a 3GHz CPU, 3GB RAM PC). We tried to maintain the same aneurysm orientation when the samples were placed in the box to be embedded, but this could not be precisely controlled. Although the orientations in the roll and yaw directions were numerically aligned during post-processing, the pitch may not be identical across the samples, which may affect the spatial trends in void sizes.
The methodology reported here can be used to characterize the distribution of coil masses within aneurysms. Such distributions may be invaluable to numerical assessment of the hemodynamic forces causing coil compaction. Further, the methodology can be used to objectively compare different coil designs and coil-assist devices, which may facilitate optimization of coil configurations deployed in patients.
Acknowledgments
The study was partly supported by NIH R01-NS045753 to B.B.L. Coils and stents were provided by Codman & Shurtleff Inc. M.A.S currently holds a research grant from Covidien.
Footnotes
CONFLICTS OF INTEREST
No benefits in any form have been or will be received from a commercial party related directly or indirectly to the subject of this manuscript.
References
- 1.Linn FH, Rinkel GJ, Algra A, van Gijn J. Incidence of subarachnoid hemorrhage: role of region, year, and rate of computed tomography: a meta-analysis. Stroke; a journal of cerebral circulation. 1996;27(4):625–9. doi: 10.1161/01.str.27.4.625. [DOI] [PubMed] [Google Scholar]
- 2.Suarez JI, Tarr RW, Selman WR. Aneurysmal subarachnoid hemorrhage. The New England journal of medicine. 2006;354(4):387–96. doi: 10.1056/NEJMra052732. [DOI] [PubMed] [Google Scholar]
- 3.Badjatia N, Carpenter A, Fernandez L, Schmidt JM, Mayer SA, Claassen J, et al. Relationship between C-reactive protein, systemic oxygen consumption, and delayed cerebral ischemia after aneurysmal subarachnoid hemorrhage. Stroke; a journal of cerebral circulation. 2011;42(9):2436–42. doi: 10.1161/STROKEAHA.111.614685. [DOI] [PubMed] [Google Scholar]
- 4.van Gijn J, Rinkel GJ. Subarachnoid haemorrhage: diagnosis, causes and management. Brain : a journal of neurology. 2001;124(Pt 2):249–78. doi: 10.1093/brain/124.2.249. [DOI] [PubMed] [Google Scholar]
- 5.Broderick JP, Brott T, Tomsick T, Miller R, Huster G. Intracerebral hemorrhage more than twice as common as subarachnoid hemorrhage. Journal of neurosurgery. 1993;78(2):188–91. doi: 10.3171/jns.1993.78.2.0188. [DOI] [PubMed] [Google Scholar]
- 6.Bederson JB, Connolly ES, Jr, Batjer HH, Dacey RG, Dion JE, Diringer MN, et al. Guidelines for the management of aneurysmal subarachnoid hemorrhage: a statement for healthcare professionals from a special writing group of the Stroke Council, American Heart Association. Stroke; a journal of cerebral circulation. 2009;40(3):994–1025. doi: 10.1161/STROKEAHA.108.191395. [DOI] [PubMed] [Google Scholar]
- 7.Rinkel GJ, Djibuti M, Algra A, van Gijn J. Prevalence and risk of rupture of intracranial aneurysms: a systematic review. Stroke; a journal of cerebral circulation. 1998;29(1):251–6. doi: 10.1161/01.str.29.1.251. [DOI] [PubMed] [Google Scholar]
- 8.Mayberg MR, Batjer HH, Dacey R, Diringer M, Haley EC, Heros RC, et al. Guidelines for the management of aneurysmal subarachnoid hemorrhage. A statement for healthcare professionals from a special writing group of the Stroke Council, American Heart Association. Circulation. 1994;90(5):2592–605. doi: 10.1161/01.cir.90.5.2592. [DOI] [PubMed] [Google Scholar]
- 9.Jane JA, Winn HR, Richardson AE. The natural history of intracranial aneurysms: rebleeding rates during the acute and long term period and implication for surgical management. Clinical neurosurgery. 1977;24:176–84. doi: 10.1093/neurosurgery/24.cn_suppl_1.176. [DOI] [PubMed] [Google Scholar]
- 10.Kassell NF, Torner JC. Aneurysmal rebleeding: a preliminary report from the Cooperative Aneurysm Study. Neurosurgery. 1983;13(5):479–81. doi: 10.1227/00006123-198311000-00001. [DOI] [PubMed] [Google Scholar]
- 11.Brilstra EH, Rinkel GJ, van der Graaf Y, van Rooij WJ, Algra A. Treatment of intracranial aneurysms by embolization with coils: a systematic review. Stroke; a journal of cerebral circulation. 1999;30(2):470–6. doi: 10.1161/01.str.30.2.470. [DOI] [PubMed] [Google Scholar]
- 12.Hayakawa M, Murayama Y, Duckwiler GR, Gobin YP, Guglielmi G, Vinuela F. Natural history of the neck remnant of a cerebral aneurysm treated with the Guglielmi detachable coil system. Journal of neurosurgery. 2000;93(4):561–8. doi: 10.3171/jns.2000.93.4.0561. [DOI] [PubMed] [Google Scholar]
- 13.Ogilvy CS. Neurosurgical clipping versus endovascular coiling of patients with ruptured intracranial aneurysms. Stroke; a journal of cerebral circulation. 2003;34(10):2540–2. doi: 10.1161/01.STR.0000092894.71909.FF. [DOI] [PubMed] [Google Scholar]
- 14.Roy D, Milot G, Raymond J. Endovascular treatment of unruptured aneurysms. Stroke; a journal of cerebral circulation. 2001;32(9):1998–2004. doi: 10.1161/hs0901.095600. [DOI] [PubMed] [Google Scholar]
- 15.Molyneux AJ, Kerr RS, Yu LM, Clarke M, Sneade M, Yarnold JA, et al. International subarachnoid aneurysm trial (ISAT) of neurosurgical clipping versus endovascular coiling in 2143 patients with ruptured intracranial aneurysms: a randomised comparison of effects on survival, dependency, seizures, rebleeding, subgroups, and aneurysm occlusion. Lancet. 2005;366(9488):809–17. doi: 10.1016/S0140-6736(05)67214-5. [DOI] [PubMed] [Google Scholar]
- 16.Ferns SP, Sprengers ME, van Rooij WJ, Rinkel GJ, van Rijn JC, Bipat S, et al. Coiling of intracranial aneurysms: a systematic review on initial occlusion and reopening and retreatment rates. Stroke; a journal of cerebral circulation. 2009;40(8):e523–9. doi: 10.1161/STROKEAHA.109.553099. [DOI] [PubMed] [Google Scholar]
- 17.Crobeddu E, Lanzino G, Kallmes DF, Cloft HJ. Review of 2 Decades of Aneurysm-Recurrence Literature, Part 1: Reducing Recurrence after Endovascular Coiling. AJNR American journal of neuroradiology. 2012 doi: 10.3174/ajnr.A3032. [DOI] [PMC free article] [PubMed] [Google Scholar]
- 18.Sluzewski M, van Rooij WJ, Rinkel GJ, Wijnalda D. Endovascular treatment of ruptured intracranial aneurysms with detachable coils: long-term clinical and serial angiographic results. Radiology. 2003;227(3):720–4. doi: 10.1148/radiol.2273020656. [DOI] [PubMed] [Google Scholar]
- 19.Debrun GM, Aletich VA, Kehrli P, Misra M, Ausman JI, Charbel F. Selection of cerebral aneurysms for treatment using Guglielmi detachable coils: the preliminary University of Illinois at Chicago experience. Neurosurgery. 1998;43(6):1281–95. doi: 10.1097/00006123-199812000-00011. discussion 96–7. [DOI] [PubMed] [Google Scholar]
- 20.Moret J, Cognard C, Weill A, Castaings L, Rey A. The “Remodelling Technique” in the Treatment of Wide Neck Intracranial Aneurysms. Angiographic Results and Clinical Follow-up in 56 Cases. Interventional neuroradiology : journal of peritherapeutic neuroradiology, surgical procedures and related neurosciences. 1997;3(1):21–35. doi: 10.1177/159101999700300103. [DOI] [PubMed] [Google Scholar]
- 21.Fernandez Zubillaga A, Guglielmi G, Vinuela F, Duckwiler GR. Endovascular occlusion of intracranial aneurysms with electrically detachable coils: correlation of aneurysm neck size and treatment results. AJNR American journal of neuroradiology. 1994;15(5):815–20. [PMC free article] [PubMed] [Google Scholar]
- 22.Hope JK, Byrne JV, Molyneux AJ. Factors influencing successful angiographic occlusion of aneurysms treated by coil embolization. AJNR American journal of neuroradiology. 1999;20(3):391–9. [PMC free article] [PubMed] [Google Scholar]
- 23.Kai Y, Hamada J, Morioka M, Yano S, Kuratsu J. Evaluation of the stability of small ruptured aneurysms with a small neck after embolization with Guglielmi detachable coils: correlation between coil packing ratio and coil compaction. Neurosurgery. 2005;56(4):785–92. doi: 10.1227/01.neu.0000156790.28794.ea. discussion -92. [DOI] [PubMed] [Google Scholar]
- 24.Tamatani S, Ito Y, Abe H, Koike T, Takeuchi S, Tanaka R. Evaluation of the stability of aneurysms after embolization using detachable coils: correlation between stability of aneurysms and embolized volume of aneurysms. AJNR American journal of neuroradiology. 2002;23(5):762–7. [PMC free article] [PubMed] [Google Scholar]
- 25.Kawanabe Y, Sadato A, Taki W, Hashimoto N. Endovascular occlusion of intracranial aneurysms with Guglielmi detachable coils: correlation between coil packing density and coil compaction. Acta neurochirurgica. 2001;143(5):451–5. doi: 10.1007/s007010170073. [DOI] [PubMed] [Google Scholar]
- 26.Uchiyama N, Kida S, Nomura M, Hasegawa M, Yamashima T, Yamashita J, et al. Significance of volume embolization ratio as a predictor of recanalization on endovascular treatment of cerebral aneurysms with guglielmi detachable coils. Interventional neuroradiology : journal of peritherapeutic neuroradiology, surgical procedures and related neurosciences. 2000;6 (Suppl 1):59–63. doi: 10.1177/15910199000060S106. [DOI] [PMC free article] [PubMed] [Google Scholar]
- 27.Satoh K, Matsubara S, Hondoh H, Nagahiro S. Intracranial Aneurysm Embolization Using Interlocking Detachable Coils. Correlation between Volume Embolization Rate and Coil Compaction. Interventional neuroradiology : journal of peritherapeutic neuroradiology, surgical procedures and related neurosciences. 1997;3 (Suppl 2):125–8. doi: 10.1177/15910199970030S226. [DOI] [PubMed] [Google Scholar]
- 28.Sluzewski M, van Rooij WJ, Slob MJ, Bescos JO, Slump CH, Wijnalda D. Relation between aneurysm volume, packing, and compaction in 145 cerebral aneurysms treated with coils. Radiology. 2004;231(3):653–8. doi: 10.1148/radiol.2313030460. [DOI] [PubMed] [Google Scholar]
- 29.Yagi K, Satoh K, Satomi J, Matsubara S, Nagahiro S. Evaluation of aneurysm stability after endovascular embolization with Guglielmi detachable coils: correlation between long-term stability and volume embolization ratio. Neurologia medico-chirurgica. 2005;45(11):561–5. doi: 10.2176/nmc.45.561. discussion 5–6. [DOI] [PubMed] [Google Scholar]
- 30.Raymond J, Guilbert F, Weill A, Georganos SA, Juravsky L, Lambert A, et al. Long-term angiographic recurrences after selective endovascular treatment of aneurysms with detachable coils. Stroke; a journal of cerebral circulation. 2003;34(6):1398–403. doi: 10.1161/01.STR.0000073841.88563.E9. [DOI] [PubMed] [Google Scholar]
- 31.Wakhloo AK, Gounis MJ, Sandhu JS, Akkawi N, Schenck AE, Linfante I. Complex-shaped platinum coils for brain aneurysms: higher packing density, improved biomechanical stability, and midterm angiographic outcome. AJNR American journal of neuroradiology. 2007;28(7):1395–400. doi: 10.3174/ajnr.A0542. [DOI] [PMC free article] [PubMed] [Google Scholar]
- 32.Phatouros CC, Higashida RT, Halbach VV. New methods of treatment for cerebral aneurysms. The Western journal of medicine. 1998;169(5):286–7. [PMC free article] [PubMed] [Google Scholar]
- 33.Bendok BR, Parkinson RJ, Hage ZA, Adel JG, Gounis MJ. The effect of vascular reconstruction device-assisted coiling on packing density, effective neck coverage, and angiographic outcome: an in vitro study. Neurosurgery. 2007;61(4):835–40. doi: 10.1227/01.NEU.0000298913.24625.26. discussion 40–1. [DOI] [PubMed] [Google Scholar]
- 34.Cha KS, Balaras E, Lieber BB, Sadasivan C, Wakhloo AK. Modeling the interaction of coils with the local blood flow after coil embolization of intracranial aneurysms. Journal of biomechanical engineering. 2007;129(6):873–79. doi: 10.1115/1.2800773. [DOI] [PubMed] [Google Scholar]
- 35.Kakalis NM, Mitsos AP, Byrne JV, Ventikos Y. The haemodynamics of endovascular aneurysm treatment: a computational modelling approach for estimating the influence of multiple coil deployment. IEEE transactions on medical imaging. 2008;27(6):814–24. doi: 10.1109/TMI.2008.915549. [DOI] [PubMed] [Google Scholar]
- 36.Seong J, Sadasivan C, Onizuka M, Gounis MJ, Christian F, Miskolczi L, et al. Morphology of elastase-induced cerebral aneurysm model in rabbit and rapid prototyping of elastomeric transparent replicas. Biorheology. 2005;42(5):345–61. [PubMed] [Google Scholar]
- 37.Brutsaert W. Probability Laws for Pore-Size Distributions. Soil Sci. 1966;101(2):85. [Google Scholar]
- 38.Shen H, Oppenheimer SM, Dunand DC, Brinson LC. Numerical modeling of pore size and distribution in foamed titanium. Mechanics of Materials. 2006;38(8–10):933–44. [Google Scholar]
- 39.Sampson WW, Urquhart SJ. The contribution of out-of-plane pore dimensions to the pore size distribution of paper and stochastic fibrous materials. J Porous Mat. 2008;15(4):411–7. doi: 10.1007/s10934-006-9088-9. [DOI] [Google Scholar]
- 40.Piotin M, Mandai S, Murphy KJ, Sugiu K, Gailloud P, Martin JB, et al. Dense packing of cerebral aneurysms: an in vitro study with detachable platinum coils. AJNR American journal of neuroradiology. 2000;21(4):757–60. [PMC free article] [PubMed] [Google Scholar]
- 41.Piotin M, Iijima A, Wada H, Moret J. Increasing the packing of small aneurysms with complex-shaped coils: an in vitro study. AJNR American journal of neuroradiology. 2003;24(7):1446–8. [PMC free article] [PubMed] [Google Scholar]
- 42.Mehra M, Hurley MC, Gounis MJ, King RM, Shaibani A, Dabus G, et al. The impact of coil shape design on angiographic occlusion, packing density and coil mass uniformity in aneurysm embolization: an in vitro study. Journal of neurointerventional surgery. 2011;3(2):131–6. doi: 10.1136/jnis.2010.004390. [DOI] [PubMed] [Google Scholar]
- 43.Sherif C, Plenk H, Jr, Grossschmidt K, Kanz F, Bavinzski G. Computer-assisted quantification of occlusion and coil densities on angiographic and histological images of experimental aneurysms. Neurosurgery. 2006;58(3):559–66. doi: 10.1227/01.NEU.0000197490.60670.A8. discussion -66. [DOI] [PubMed] [Google Scholar]
- 44.Morales HG, Larrabide I, Geers AJ, Dai D, Kallmes DF, Frangi AF. Analysis and quantification of endovascular coil distribution inside saccular aneurysms using histological images. Journal of neurointerventional surgery. 2012 doi: 10.1136/neurintsurg-2012-010456. [DOI] [PMC free article] [PubMed] [Google Scholar]
- 45.Slob MJ, van Rooij WJ, Sluzewski M. Influence of coil thickness on packing, re-opening and retreatment of intracranial aneurysms: a comparative study between two types of coils. Neurological research. 2005;27(Suppl 1):S116–9. doi: 10.1179/016164105X49292. [DOI] [PubMed] [Google Scholar]
- 46.Sadasivan C, Lieber BB. Numerical Investigation of Coil Configurations That Provide Ultra-High Packing Density of Saccular Aneurysms. Journal of medical devices. 2009;3(4):41005. doi: 10.1115/1.4000453. [DOI] [PMC free article] [PubMed] [Google Scholar]
- 47.Wang X, Mohanty KK. Critical Condensate Saturation in Porous Media. J Colloid Interface Sci. 1999;214(2):416–26. doi: 10.1006/jcis.1999.6223. [DOI] [PubMed] [Google Scholar]
- 48.Neithalath N, Sumanasooriya MS, Deo O. Characterizing pore volume, sizes, and connectivity in pervious concretes for permeability prediction. Materials Characterization. 2010;61(8):802–13. doi: 10.1016/j.matchar.2010.05.004. [DOI] [Google Scholar]
- 49.Johnston PR. Revisiting the most probable pore-size distribution in filter media: The gamma distribution. Filtration and Separation. 1998;35(3):287–92. [Google Scholar]
- 50.Orlovskaja N, Peterlik H, Steinkellner W, Kromp K. Prediction of strength of recrystallized siliconcarbide from pore size measurement. Part I. The bimodality of the distribution. Journal of Materials Science. 2000;35(3):699–705. doi: 10.1023/a:1004705300886. [DOI] [Google Scholar]


