Abstract
Chromium (Cr) is an abundant element in the Earth’s crust. It exhibits various oxidation states, from divalent to hexavalent forms. Cr has diverse applications in various industrial processes and inadequate treatment of the industrial effluents leads to the contamination of the surrounding water resources. Hexavalent chromium (Cr (VI)) is the most toxic form, and its toxicity has been associated with oxidative stress. The present study was designed to investigate the toxic potential of Cr (VI) in fish. In this research, we investigated the role of oxidative stress in chromium-induced genotoxicity in the liver and kidney cells of goldfish, Carassius auratus. Goldfish were acclimatized to the laboratory conditions and exposed them to 5% and 10% of 96 hr-LC50 (85.7 mg/L) of aqueous Cr (VI) in a continuous flow through system. Fish were sampled every 7 days for a period of 28 days to analyze the lipid hydroperoxides (LHP) levels and genotoxic potentials in the liver and kidney. LHP levels were analyzed by spectrophotometry while genotoxicity was assessed by single cell gel electrophoresis (comet) assay. LHP levels in the liver increased significantly at week 1, followed by a decrease. LHP levels in the kidney increased significantly at weeks 1, 2, and 3, and decreased at week 4 compared to the control. The percentage of DNA damage increased in both liver and kidney at both test concentrations. The results clearly indicate that Cr (VI) induces significant levels of DNA damage in liver and kidney cells of goldfish. The induced LHP levels in both organs were concentration-dependent and were directly correlated with the levels of DNA damage. The two tested Cr (VI) concentrations induced significant levels of oxidative stress in both organs, however the kidney appears to be more vulnerable and sensitive to Cr-induced toxicity than the liver.
Keywords: chromium, goldfish, sub-chronic exposure, oxidative stress, DNA damage
Introduction
Chromium (Cr) is a heavy metal that exhibits various oxidation states; trivalent (Cr (III)) and hexavalent (Cr (VI)) states are most common. Cr has diverse applications in various industrial processes including leather tanning, stainless steel production, refractory industry, and wood preservative. Inadequate treatment of the industrial effluents leads to the contamination of surrounding water bodies.1 Among the various oxidation states, Cr (VI) can easily penetrate cellular membranes of aquatic organisms and causes cellular and tissue damage.2,3
After Cr enters into the biological system, Cr (VI) is reduced to Cr (III) and releases free radicals into the system.4 The released free radicals are highly reactive and interact with various macromolecules. Antioxidants play an important role in balancing the reactive oxygen species (ROS) levels in biological systems. Many studies have reported toxic potentials of Cr in aquatic organisms. Cr is reported to induce histological changes in fish gills.5 Hematological studies in Cr exposed fish have revealed thrombocytopenia,6 anemic, leucopoenia conditions, erythrocytosis, and leukocytosis.7 Cr inhibits ion-transporting ATPases in gills, kidney, and intestinal tissues.8 Cr (VI) has also been reported to alter antioxidant and associated enzymes including superoxide dismutase (SOD), catalase (CAT) and glutathione reductase.9,10
Industrial wastes and effluents released from industries in which chromite ore is used as a raw material have ample amounts of Cr. Fish exposed to these industrial effluents have shown a significant increase in the frequency of micro nucleated erythrocytes and gill cells. However, the frequencies of lobed nuclei (LN), blebbed nuclei (BL), and notched nuclei (NT) are not significant.11–13 Additionally, there are few reports on Cr-induced genotoxicity at the cellular level in different organs of aquatic organisms. Hence, the present study was designed to investigate the genotoxic potentials of Cr (VI) in fish liver and kidney cells sub-chronically exposed goldfish. We also made an attempt to correlate the Cr (VI)-induced oxidative stress and DNA damage at organ and cellular levels.
Materials and Methods
Chemicals and reagents
Sodium dichromate (Na2Cr2O7), dimethyl sulfoxide, sodium hydroxide, ethanol, tris-borate EDTA (TBE) buffer, chloroform, and methanol were purchased from Sigma-Aldrich (Sigma-Aldrich, USA). Extract R, chromogen, and lipid hydroperoxides (LHPs) were purchased from Calbiochem (Calbiochem, USA). Agarose, lysis solution, SYBR green, ethylene diamin tetra acetic acid (EDTA), and phosphate buffer saline (PBS) were purchased from Trevigen (Trevigen Inc., USA).
Experimental animals’ maintenance and sub chronic exposure
Carassius auratus of both sexes (length 9.0 ± 0.6 cm and weight 17.4 ± 4.5 g) were purchased from a local store in Jackson Mississippi. The purchased fish were disease-free and did not have any history of previous chemical exposure. The healthy fish were acclimated to the laboratory conditions for a period of 30 days. No mortality was observed during the acclimatization period. They were fed with aquarium flake food twice a day. Natural photoperiod was maintained. During sub-chronic exposure, fish were exposed to Cr (VI) (source Na2Cr2O7) for a period of 4 weeks in a continuous flow through system in which toxicant and water (filtered and aerated) was added continuously with constant flow rate to the tanks. The tanks were prepared with glass and had capacity of 150 L. The flow rate was maintained with peristaltic pumps. The total toxicant water was renewed in every 24 hr in each tank. Three of these described set ups were prepared for control, 5% of 96 hr-LC50 (4.28 ppm), and 10% of 96 hr-C50 (8.57 ppm) concentrations. Cr (VI) 96 hr-LC50 value of 85.7 ± 4 ppm was estimated from our recent study.14 The acclimatized fish were placed in the three glass aquaria. The fish were fed with aquarium flake food twice a day and 12 hr-light/12 hr-dark photoperiod was maintained throughout the study. No mortality of fish was observed during the toxicant exposure. Every 7 days, an adequate numbers of fish were taken out from the control aquarium, the aquarium with 5% of LC50, and the aquarium with 10% of LC50 test solution. The fish were anesthetized with 0.1% 2-phenoxy ethanol (Fluka, USA) and sacrificed with decapitation. Liver and kidney organs were dissected for further analysis.
Lipid hydroperoxide assay
Lipid peroxidation (LP) in liver and kidney of Cr (VI)-exposed goldfish was estimated using LHP assay kit (Calbiochem, USA). The dissected goldfish liver and kidney were processed and homogenized (1:8 w/v) in HPLC grade water. Homogenized liver and kidney of 500 μL was placed in separate glass test tubes. An equal amount of Extract R saturated methanol was added and mixed by vortexing. 1 mL of cold deoxygenated chloroform was added to all the control and sample tubes and centrifuged at 1500 × g for 5 min at 0 °C (Beckman XL-100 K, USA). After centrifugation, bottom chloroform layer of 500 μL was mixed with 450 μL of chloroform:methanol (2:1) mixture and 50 μL of chromogen (thiocyanate ion). The reaction mixtures of all the control and sample tubes were incubated at room temperature for 5 min. The absorbance of each control and sample was recorded at 500 nm using a research spectrophotometer (2800 Unico Spectrophotometer, USA).
DNA damage assay
Isolation of cells from the liver and kidney tissues
Cr (VI) exposed or non-exposed liver and kidney tissues were dissected and small pieces of the tissues were placed in Eppendorf tubes containing Ca++ and Mg++ free cold PBS to remove red blood cells adhered to the tissues. These tissues were placed in 1 mL of PBS with 20 mM EDTA and were gently minced with scissors to release single cells from the tissues. The samples were incubated for several minutes to allow for settling of tissues pieces and cell debris. The upper layer with cell suspension was placed into separate tubes, and bottom layer tissues and cell debris was discarded. The cells in the cell suspension were counted, centrifuged at 4 °C, and resuspended in 1 mL of ice cold PBS with 1 × 10⁵ cells/mL.
Single cell gel electrophoresis (comet) assay
The comet assay was performed as described by Singh et al15 with few modifications.1 The whole process was carried out under yellow light in order to minimize UV light damage. Agarose was prepared through melting in a boiling water bath and allowing it to return to room temperature. The isolated liver and kidney cells were mixed with the melted agarose in a 1:10 ratio. Approximately 75 μL of the mixture of agarose and cells were placed on comet slides, and the agarose was solidified at 4 °C for 10 min. After 10 min, the slides were placed in a lysis solution at 4 °C for 30 min to lyse the embedded cells in the agarose. The excess lysis solution was removed from the slides and placed in an alkaline solution to denature the DNA for 40 min at room temperature. Later, the slides were subjected to TBE (Tris borate EDTA buffer) electrophoresis for 10 min with 1 volt/cm current between the two electrodes. Then the slides were fixed with 70% ethanol for 5 min, followed by SYBR green staining. The stained slides were examined using an epifluorescent microscope (Olympus BX51 TRF, USA). The data were analyzed with DNA damage analysis software (Loats Associates Inc., USA). The control comet slides were prepared along with the test comet slides under yellow light.
Statistical analysis
The data was analyzed using SAS 9.1 software and expressed as arithmetic mean ± standard deviation. One-way ANOVA and student t test were performed to determine the level of significance. Given correlation coefficients were significant with P < 0.05.
Results
Lipid peroxidation
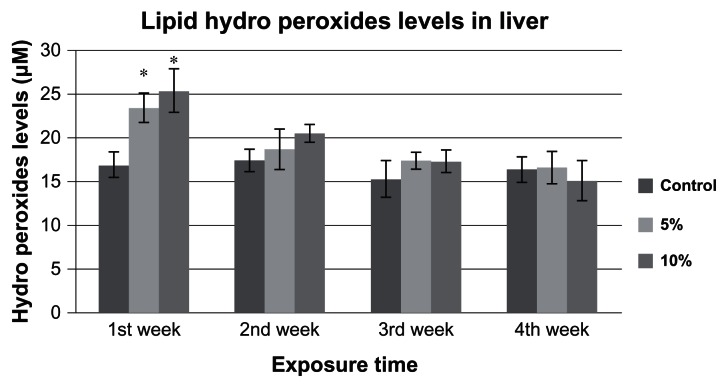
The estimated LHP levels in goldfish liver exposed to 5% and 10% of 96h-LC50 of Cr (VI) are presented in Figure 1. The LHP levels in the liver of the control group goldfish were 16.9 ± 3.0 μM, 17.4 ± 3.0 μM, 15.2 ± 3.0 μM, and 16.3 ± 2.0 μM for week 1, 2, 3, and 4, respectively. The LHP levels in the liver of 5% of 96h-LC50 exposed fish were 23.4 ± 1.0 μM, 18.6 ± 2.0 μM, 17.3 ± 0.3 μM, and 16.6 ± 1.0 μM for week 1, 2, 3, and 4, respectively. The LHP levels in liver of 10% of 96h-LC50 exposed fish were 25.3 ± 2.0 μM, 20.4 ± 1.0 μM, 17.2 ± 1.0 μM, and 15.0 ± 2.0 μM for week 1, 2, 3, and 4, respectively. The LHP levels in goldfish liver exposed to 5% and 10%-LC50 increased at week 1, 2, 3, and 4 compared to the controls. The increases at week 1 were significantly different (P < 0.05) from the controls, whereas the increase in week 2, 3, and 4 levels were not significantly different (P > 0.05) from the controls.
Figure 1.
LHP levels in Carassius auratus liver exposed to 5% and 10% of 96 hr LC50 Cr (VI) for four weeks.
Notes: Each point represents a mean value and standard deviation of three replicates. The LHP levels were 16.9 ± 3.0, 17.4 ± 3.0, 15.2 ± 3.0 and 16.3 ± 2.0 μM in control group; 23.4 ± 1.0, 18.6 ± 2.0, 17.3 ± 0.0 and 16.6 ± 1.0 μM in 5% of 96h-LC50; and 25.3 ± 2.0, 20.4 ± 1.0, 17.2 ± 1.0 and 15.0 ± 2.0 μM in 10% of 96h-LC50-exposed fish for Weeks 1, 2, 3, and 4, respectively. Both 5% and 10% 96h-LC50 concentrations induced an increase in LHP levels during Week 1. *indicates significantly different from the control according to DUNNETT’s multiple comparison test.
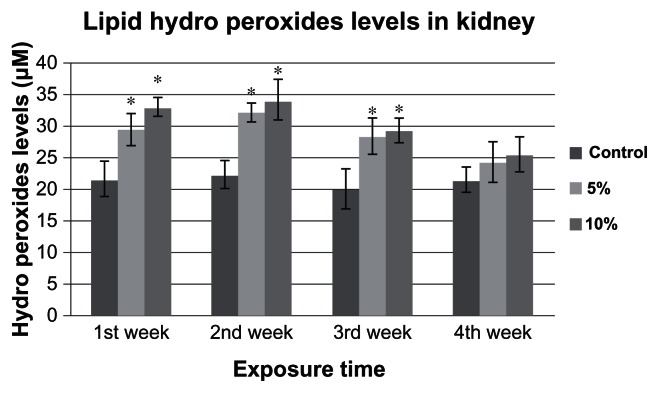
LHP levels in the goldfish kidney after chronic exposure for 4 weeks with Cr (VI) are summarized in Figure 2. The LHP levels in the kidney of the control group goldfish were 21.7 ± 2.0 μM, 22.4 ± 2.0 μM, 20.1 ± 3.0 μM, and 21.5 ± 2.0 μM for week 1, 2, 3, and 4, respectively. The LHP levels in the kidney of 5% of 96h-LC50 exposed fish were 29.6 ± 2.0 μM, 32.2 ± 1.0 μM, 28.5 ± 2.0 μM, and 24.4 ± 3.0 μM for week 1, 2, 3, and 4, respectively. The LHP levels in kidney of 10% of 96h-LC50 exposed fish were 33.1 ± 1.0, 34.2 ± 3.0, 29.4 ± 1.0 and 25.6 ± 2.0 μM for week 1, 2, 3 and 4, respectively. LHP levels in the kidney of the 5% and 10%-LC50 exposed fish increased in week 1, 2, 3, and 4 compared to the controls. However, only the increases of week 1, 2, and 3 were significantly different (P < 0.05) from the control.
Figure 2.
Lipid hydro peroxides levels in Carassius auratus kidney exposed to 5% and 10% of 96 hr-LC50 Cr (VI) for four weeks.
Notes: LHP levels of control group were 21.7 ± 2.0, 22.4 ± 2.0, 20.1 ± 3.0 and 21.5 ± 2.0 μM; of 5% of 96h-LC50 were 29.6 ± 2.0, 32.2 ± 1.0, 28.5 ± 2.0 and 24.4 ± 3.0 μM; and of 10% of 96h-LC50 exposed fish were 33.1 ± 1.0, 34.2 ± 3.0, 29.4 ± 1.0 and 25.5 ± 2.0 μM, for Week 1, 2, 3, and 4, respectively. LHP levels were increased during Weeks 1, 2, and 3. Each point represents a mean value and standard deviation of three replicates. *indicates significantly different from the control according to DUNNETT’s multiple comparison test.
Comet assay
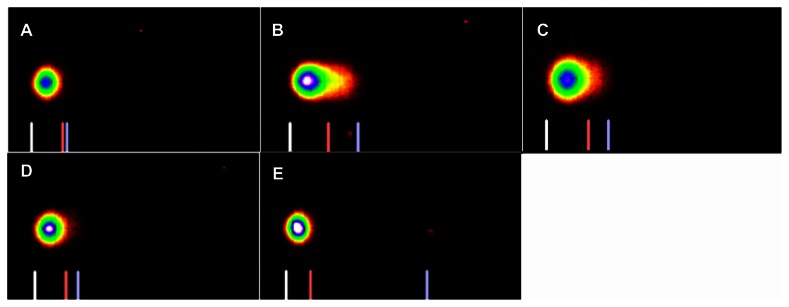
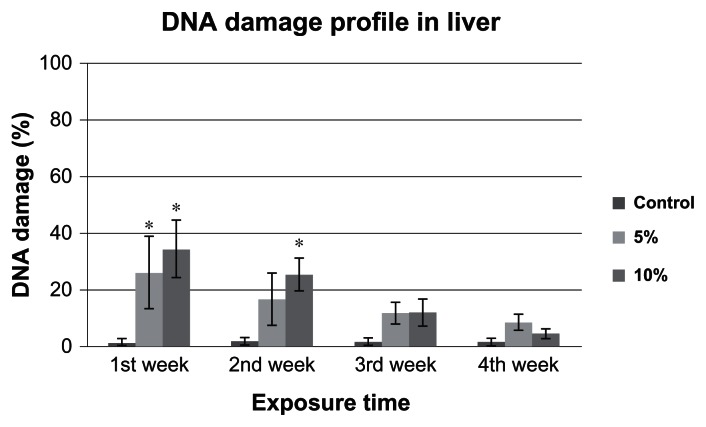
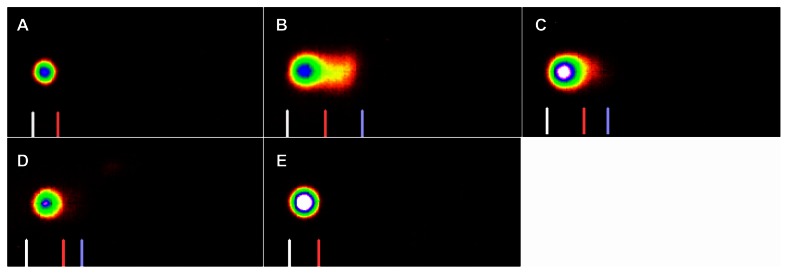
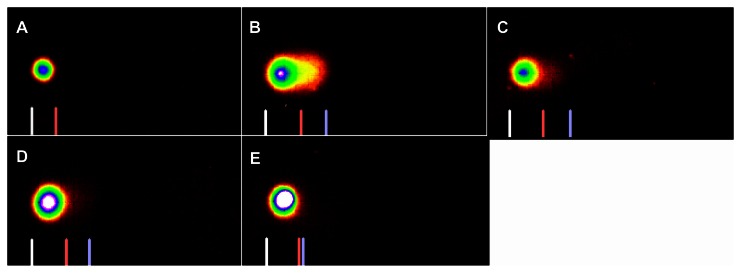
The comet assay images of 5% and 10%-LC50 exposed liver cells are presented in Figures 3 and 4. The profile of DNA damage in goldfish liver cells is presented in Figure 5. The percentages of DNA damage in liver cells of control group goldfish were 1.58% ± 1%, 2.1% ± 1%, 1.82% ± 0.9%, and 1.68% ± 1% for week 1, 2, 3, and 4, respectively. The percentages of DNA damage in liver cells of 5% of 96h-LC50 exposed fish were 26.3% ± 12.0%, 16.8% ± 9.0%, 11.9% ± 3.0%, and 8.8% ± 2.0% for week 1, 2, 3, and 4, respectively. The percentages of DNA damage in liver of 10% of 96h-LC50 exposed fish were 34.4% ± 10.0%, 25.5% ± 5.0%, 12.2% ± 4.0%, and 4.6% ± 1.0% for week 1, 2, 3, and 4, respectively. The percentage of DNA damage in goldfish liver cells exposed to 5%-LC50 increased for all the four weeks. However, only the increased percentage of DNA damage at week 1 was significantly different (P < 0.05) from the control. The percentage of DNA damage in goldfish liver cells exposed to 10%-LC50 increased for all the four weeks, however only week 1 and 2 were significantly different (P < 0.05) from the controls.
Figure 3.
SYBR green stained comet assay images of DNA damage in Carassius auratus liver cells exposed to 5% of 96 hr-LC50 Cr (VI) for four weeks. The 5% of 96 hr-LC50 test concentration induced more DNA damage during Week 1. (A) Control, (B) Week 1, (C) Week 2, (D) Week 3, and (E) Week 4.
Note: The comet assay was performed as described in Materials and Methods section.
Figure 4.
SYBR green stained comet assay images of DNA damage in Carassius auratus liver cells exposed to 10% of 96 hr-LC50 Cr (VI) for four weeks. The 10% of 96 hr-LC50 test concentration induced more DNA damage during Weeks 1 and 2. (A) Control, (B) Week 1, (C) Week 2, (D) Week 3 and (E) Week 4.
Note: The comet assay was performed as described in Materials and Methods section.
Figure 5.
Percentage of DNA damage in Carassius auratus liver exposed to 5% and 10% of 96 hr-LC50 Cr (VI) for four weeks.
Notes: The percentages of DNA damage in control group were 1.6% ± 1.0%, 2.1% ± 1.0%, 1.8% ± 0.9%, and 1.7% ± 1.0%; in 5% of 96h-LC50 exposed fish were 26.3% ± 12.0%, 16.8% ± 9.0%, 11.9% ± 3.0%, and 8.8% ± 2.0%, and in 10% of 96h-LC50 exposed fish were 34.4% ± 10.0%, 25.5% ± 5.0%, 12.2% ± 4.0%, and 4.6% ± 1.0%, for Weeks 1, 2, 3, and 4, respectively. The 10% of 96h-LC50 induced more DNA damage in liver cells. Each point represents a mean value and standard deviation of three replicates. *indicates significantly different from the control according to DUNNETT’s multiple comparison test.
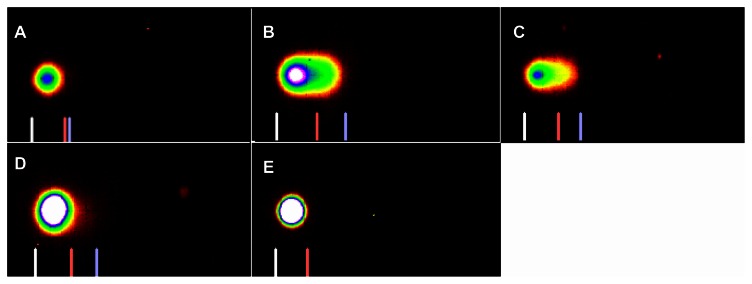
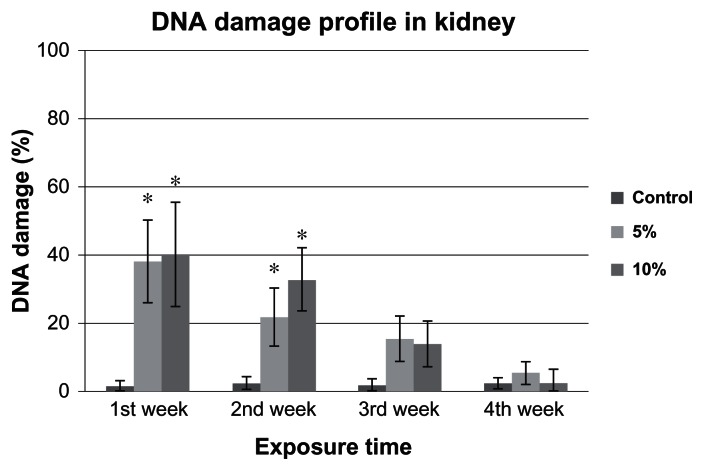
The comet assay images of control, 5% and 10%-LC50 exposed kidney cells are presented in Figures 6 and 7. The percentages of DNA damage in goldfish kidney exposed to 5% and 10%-LC50 are presented in Figure 8. The percentages of DNA damage in the kidneys of the control group goldfish were 1.4% ± 1.0%, 2.5% ± 1.0%, 1.8% ± 1.0%, and 2.3% ± 1.0% for week 1, 2, 3, and 4, respectively. The percentages of DNA damage in kidney cells of 5% of 96h-LC50 exposed fish were 38.2% ± 12.0%, 21.8% ± 8.0%, 15.4% ± 6.0%, and 5.5% ± 3.0% for week 1, 2, 3, and 4, respectively. The percentages of DNA damage in kidney cells of 10% of 96h-LC50 exposed fish were 40.0% ± 15.0%, 32.8% ± 9.0%, 14.0% ± 6.0%, and 2.4% ± 4.0% for week 1, 2, 3, and 4, respectively. The percentages of DNA damage in goldfish kidney cells exposed to 5% and 10%-LC50 increased over all 4 weeks of exposure. However, only the increase at week 1 and 2 in 5% and 10%-LC50 exposed fish was significantly different (P < 0.05) from the controls whereas week 3 and 4 increases were not significantly different (P > 0.05) from the controls.
Figure 6.
SYBR green stained comet assay images of DNA damage in Carassius auratus kidney cells exposed to 5% of 96 hr-LC50 Cr (VI) for four weeks. The 5% of 96 hr-LC50 test concentration induced more DNA damage during Weeks 1 and 2. (A) Control, (B) Week 1, (C) Week 2, (D) Week 3, and (E) Week 4.
Note: The comet assay was performed as described in Materials and Methods section.
Figure 7.
SYBR green stained comet assay images of DNA damage in Carassius auratus kidney cells exposed to 10% of 96 hr-LC50 Cr (VI) for four weeks. The 10% of 96 hr-LC50 test concentration induced more DNA damage during Weeks 1 and 2. (A) Control, (B) Week 1, (C) Week 2, (D) Week 3 and (E) Week 4.
Note: The comet assay was performed as described in Materials and Methods section.
Figure 8.
Percentage of DNA damage in Carassius auratus kidney cells exposed to 5% and 10% of 96h-LC50 Cr (VI) for four weeks.
Notes: The percentages of DNA damage in control group were 1.4% ± 1.0%, 2.5% ± 1.0%, 1.8% ± 1.0%, and 2.3% ± 1.0%; in 5% of 96h-LC50 exposed fish were 38.2% ± 12.0%, 21.8% ± 8.0%, 15.4% ± 6.0%, and 5.5% ± 3.0%; and in 10% of 96h-LC50-exposed fish were 40.0% ± 15.0%, 32.8% ± 9.0%, 14.0% ± 6.0%, and 2.4% ± 4.0%, for Weeks 1, 2, 3, and 4, respectively. Both 5% and 10% of 96h-LC50 concentrations induced significantly more DNA damage during the week 1 and 2. Each point represents a mean value and standard deviation of three replicates. *indicates significantly different from the control according to DUNNETT’s multiple comparison test.
Discussion
Releasing Cr-containing industrial effluents into the surrounding environment will contaminate bodies Chromium-induced oxidative stress and DNA damage of water. Cr contaminants in the aquatic environment are known to induce oxidative stress in fish.10,16–18 The induction of oxidative stress and triggering of defense mechanisms occur simultaneously in the cells of exposed fish.19 However, the induction of oxidative stress above the threshold levels will lead to the damage of its own cellular constituents.16 The United States Environmental Protection Agency (USEPA) has set the maximum contaminant level goal (MCLG) for Cr in human drinking water at 50 μg/L over a lifetime of exposure. For the protection of freshwater aquatic life, a level of 0.29 μg/L has been recommended for hexavalent chromium as a 24 hr average exposure limit and is not to exceed 21 μg/L at any time.20 In saltwater, 18 μg/L is recommended as a 24 hr average exposure limit and is not to exceed 1,260 μg/L at any time.20 Although these chronic exposure guidelines are much lower than the concentrations tested in our study, it is well documented that chromium concentrations in water resources are highly influenced by industrial operations, since inadequate treatment of industrial effluents often leads to significant environmental contamination.20,21 It is interesting to study the correlation of oxidative stress to the cellular damaging potentials of Cr (VI). In the present study we have analyzed the oxidative stress and genotoxic potentials of Cr (VI) in goldfish liver and kidney cells under sub-chronic exposure conditions. The results demonstrate the Cr (VI) potential to induce LP and significant DNA damage at early stages of chronic exposure in goldfish liver and kidney cells.
We have previously reported an increase in LHP levels in liver and kidney cells of goldfish exposed to Cr under acute exposure (96 hr).16 In the current study, we have examined the LHP levels in the liver and kidney of these fish after a sub-chronic exposure period of 4 weeks. The LHP levels were significantly increased in the liver (Fig. 1) and kidney (Fig. 2) at week 1 and gradually decreased at the end of week 4. LP is the result of oxidative stress that develops a serious imbalance between oxidants and antioxidants levels in cells.22 The increased LHP levels at the end of week 1 could be the result of increased levels of oxidants, which may have deleterious effects on cellular constituents. Oxidative stress, including lipid peroxidation, hampers Na+/K+ATPase activity and eventually leads to deleterious effects.23–25 Our results are in agreement with previous studies demonstrating that Cr induces LP and oxidative stress.26,27
In the present study, we found that LP was significantly induced in the liver and kidney at early stages of exposure. LP assessment is essential to identify the role of oxidative injury in pathophysiological disorders.28 Peroxidation of both saturated and unsaturated lipids results in the formation of highly reactive and unstable hydroperoxides which are known to cause oxidative stress. LP has been implicated in the etiology of a number of disease conditions including reproductive and developmental disorders, respiratory dysfunctions, cardiovascular diseases, neurological disorders, and many chronic diseases such as cancers.28–30 In the present study, an LP assay was used to evaluate the levels of LHP as markers of oxidative stress produced from goldfish exposure to Cr. Although LP may also lead to other byproducts, such as conjugated dienes, 4-hydroxynonenal, isoprostanes, lipid-DNA adducts, and aldehydes,29 we chose to measure LHP levels because of the relatively higher sensitivity of the test method, cost-effectiveness, and availability of equipment in our laboratory.
As previously reported, acute exposure of goldfish to Cr for 96 hr increased the DNA damage potential with increasing concentration of Cr (VI).16 In the present study, we analyzed the DNA damage potential of Cr (VI) for chronic exposure. The DNA damage levels were highest at week 1 in the liver (Figs. 3 and 4) and kidney (Figs. 6 and 7). Levels of DNA damage by Cr (VI) were decreased by the end of week 4 in the liver (Fig. 5) and kidney (Fig. 8). At the end of week 4, the oxidant levels may have decreased and the cells may have recovered from the DNA damage through repair mechanisms. It is possible that the defense mechanisms effectively controlled the oxidants levels and recovered from the DNA damage. Our results are consistent with a recent publication by Reinardy et al.31 The authors reported that fish exposed to cobalt induces DNA damage recovery genes. To support the present results, as we reported previously,10 the antioxidants levels including SOD, glutathione peroxidase, and metallothionein levels were significantly increased during similar exposure conditions (5% and 10% of LC50) of fish to Cr (VI). In accordance with the present results, it has also been reported that Cr (VI) has the potential to induce double strand breaks, chromosomal aberrations,32 and differential gene expression.33
In the present study, the single-cell gel electrophoresis, also known as Comet assay, was used to detect DNA damage in liver and kidney cells of goldfish exposed to Cr (VI). This assay has been commonly applied to detect single and double strand breaks in DNA caused by various factors including biological, chemical, environmental, nutritional, and pharmaceutical agents.34,35 The main advantages of this assay include its low cost, reliability, simplicity, well defined test procedures, and availability of equipment.34 However, one of the biggest drawbacks is that it does not detect mitochondrial DNA damage or small DNA fragments (smaller than 50 kb) as they are mostly washed away during the lysis and electrophoresis processes.35–37 Because of this limitation, the microgel electrophoresis assay has been modified to allow for the detection of DNA double-strand breaks, crosslinks, base damage, and apoptotic nuclei, in addition to its ability to measure single-strand DNA breaks.35,36
Our results indicate that the goldfish kidney is more vulnerable to the genotoxic potential of Cr (VI) when compared to the liver. The LHP levels increased at both testing concentrations (5% and 10% of LC50), however the LHP levels were significantly higher until the end of week 3 in the kidney when compared to liver (Figs. 1 and 2). The significant increase in LHP levels during early stages of exposure indicates that the fish might have experienced oxidative stress. In the similar trend, kidney cells had more DNA damage (Fig. 8) in comparison to liver cells (Fig. 5). These results demonstrate that there is a direct correlation between the levels of oxidative stress and DNA damage potentials. However, at the end of week 4, the liver and kidney cells were almost recovered from the DNA damage as the result of decreased LHP levels. The decreased levels of LHP and DNA damage may have resulted from reduced oxidative stress. We previously reported10 increased levels of antioxidants at the end of week 4 under similar experimental conditions in the both the organs. These results suggest that the levels of oxidative stress may be decreased by end of the week 4.
Conclusion
Cr (VI) is used as raw material in various industrial applications. Lack of proper treatment of these industrial effluents has lead to Cr (VI) becoming a common contaminant in surrounding water systems. This study was designed to investigate the toxic potential of Cr (VI) in goldfish. As we hypothesized, Cr (VI) significantly induced LP and DNA damage in goldfish liver and kidney cells. Both LP and DNA damage were more pronounced in the goldfish kidney when compared to the liver. These results indicate that the goldfish are more vulnerable for DNA damage and oxidative stress in Cr contaminated water bodies. Additionally, these findings may be helpful in establishing the best practical technologies and regulatory levels of Cr in industrial effluents.
Footnotes
Author Contributions
Conceived and designed the experiments: PBT, VV. Analyzed the data: VV, PBT. Wrote the first draft of the manuscript: VV. Contributed to the writing of the manuscript: PBT. Agree with manuscript results and conclusions: PBT, VV. Jointly developed the structure and arguments for the paper: PBT, VV. Made critical revisions and approved final version: VV, PBT. All authors reviewed and approved of the final manuscript.
Competing Interests
Author(s) disclose no potential conflicts of interest.
Disclosures and Ethics
As a requirement of publication the authors have provided signed confirmation of their compliance with ethical and legal obligations including but not limited to compliance with ICMJE authorship and competing interests guidelines, that the article is neither under consideration for publication nor published elsewhere, of their compliance with legal and ethical guidelines concerning human and animal research participants (if applicable), and that permission has been obtained for reproduction of any copyrighted material. This article was subject to blind, independent, expert peer review. The reviewers reported no competing interests.
Funding
This research was supported in part by the RCMI Center for Environmental Health (Grants No. G12RR013459 and No. 8G12MD007581) from the National Institutes of Health, and in part by the Environmental Cooperative Science Center (Grant No. NA11SEC4810001) from the National Oceanic and Atmospheric Administration.
References
- 1.Velma V, Vutukuru SS, Tchounwou PB. Ecotoxicology of hexavalent chromium in fresh water fish: a critical review. Rev Environ Health. 2009;24(2):129–45. doi: 10.1515/reveh.2009.24.2.129. [DOI] [PMC free article] [PubMed] [Google Scholar]
- 2.Mishra AK, Mohanty B. Chronic exposure to sublethal hexavalent chromium affects organ histopathology and serum cortisol profile of a teleost, Channa punctatus (Bloch) Sci Tot Environ. 2009;407(18):982–8. doi: 10.1016/j.scitotenv.2009.05.042. [DOI] [PubMed] [Google Scholar]
- 3.Begum G, Venkateswara RJ, Srikanth K. Oxidative stress and changes in locomotor behavior and gill morphology of Gambusia affinis exposed to chromium. Toxicol Environ Chem. 2006;88(2):355–65. [Google Scholar]
- 4.Wilbur S, Voytek P. Toxicological profile for chromium. Agency for Toxic Substances and Disease Registry; Atlanta, GA USA: 1988. p. 376. [PubMed] [Google Scholar]
- 5.Van Der Putte I, Brinkhorst MA, Koeman JH. Effect of pH on the acute toxicity of hexavalent chromium to Rainbow trout (Salmo gairdneri) Aqua Toxicol. 1981;1:129–42. [Google Scholar]
- 6.Van Pittius MG, Van Vuren JHJ, Du Preez HH. Effects of chromium during pH change on blood coagulation in Tilapia sparrmanii. Comp Biochem Physiol. 1992;101C(2):371–4. doi: 10.1016/0742-8413(92)90289-j. [DOI] [PubMed] [Google Scholar]
- 7.Wepener V, Van Vuren JHJ, Du Preez HH. The effect of hexavalent chromium at different pH values on the hematology of Tilapia sparrmanii (Cichlidae) Comp Biochem Physiol. 1992;101C(2):375–81. doi: 10.1016/0742-8413(92)90290-n. [DOI] [PubMed] [Google Scholar]
- 8.Thaker K, Chhaya J, Nuzhat S, Mittal R, Mansuri AP, Kundu R. Effects of chromium (6+) on some ion-dependent ATPases in gills, kidney and intestine of a coastal teleost Periophthalmus dipes. Toxicol. 1996;112:237–44. doi: 10.1016/0300-483x(96)86481-x. [DOI] [PubMed] [Google Scholar]
- 9.Lushchak OV, Kubrak OI, Nykorak MZ, Story KB, Lushchak VI. The effect of potassium dichromate on free radical processes in goldfish: Possible protective role of glutathione. Aqua Toxicol. 2008;87(2):108–14. doi: 10.1016/j.aquatox.2008.01.007. [DOI] [PubMed] [Google Scholar]
- 10.Velma V, Tchounwou PB. Hexavalent chromium-induced multiple biomarker responses in liver and kidney of Goldfish, Carassius auratus. Environ Toxicol. 2011;26(6):649–56. doi: 10.1002/tox.20602. [DOI] [PMC free article] [PubMed] [Google Scholar]
- 11.Cavas T, Ergene-Gozukara S. Induction of micronuclei and nuclear abnormalities in Oreochromis niloticus following exposure to petroleum refinery and chromium processing plant effluents. Aqua Toxicol. 2005;74(3):264–71. doi: 10.1016/j.aquatox.2005.06.001. [DOI] [PubMed] [Google Scholar]
- 12.Zhu Y, Wang J, Bai Y, Zhang R. Cadmium, chromium, and copper induce polychromatocyte micronuclei in Carp (Cyprinus carpio L.) Bull Environ Contamn Toxicol. 2004;72(1):78–86. doi: 10.1007/s00128-003-0243-6. [DOI] [PubMed] [Google Scholar]
- 13.De Lemos CT, Rodel PM, Terra NR, Erdtman B. Evaluation of basal micronucleus frequency and hexavalent chromium effects in fish erythrocytes. Environ Toxicol Chem. 2001;20(6):1320–4. doi: 10.1897/1551-5028(2001)020<1320:eobmfa>2.0.co;2. [DOI] [PubMed] [Google Scholar]
- 14.Velma V, Tchounwou PB. Acute toxicity of sodium dichromate to gold fish, Carassius auratus. Metal Ions Biol Med. 2008;10:642–6. [Google Scholar]
- 15.Singh NP, McCoy MC, Tice R, Schnider EL. A simple technique for quantification of low levels of DNA damage in individual cells. Exp Cell Res. 1988;175(1):184–91. doi: 10.1016/0014-4827(88)90265-0. [DOI] [PubMed] [Google Scholar]
- 16.Velma V, Tchounwou PB. Chromium-induced biochemical and genotoxic effects in liver and kidney of Goldfish, Carassius auratus. Mutat Res. 2010;698(1–2):43–51. doi: 10.1016/j.mrgentox.2010.03.014. [DOI] [PMC free article] [PubMed] [Google Scholar]
- 17.Li ZH, Li P, Randak T. Evaluating the toxicity of environmental concentrations of waterborne chromium (VI) to a model teleost, Oncorhynchus mykiss: a comparative study of in vivo and in vitro. Comp Biochem Physiol C Toxicol Pharmacol. 2011;153(4):402–7. doi: 10.1016/j.cbpc.2011.01.005. [DOI] [PubMed] [Google Scholar]
- 18.Vasylkiv OY, Kubrak OI, Storey KB, Lushchak VI. Cytotoxicity of chromium ions may be connected with induction of oxidative stress. Chemosphe. 2010;80(9):1044–9. doi: 10.1016/j.chemosphere.2010.05.023. [DOI] [PubMed] [Google Scholar]
- 19.Kubrak OI, Lushchak OV, Lushchak JV, et al. Chromium effects on free radical processes in goldfish tissues: comparison of Cr(III) and Cr(VI) exposures on oxidative stress markers, glutathione status and antioxidant enzymes. Comp Biochem Physiol C Toxicol Pharmacol. 2010;152(3):360–70. doi: 10.1016/j.cbpc.2010.06.003. [DOI] [PubMed] [Google Scholar]
- 20.US Environmental Protection Agency. Ambient Water Quality Criteria for Chromium. Office of Water Regulations and Standards. Criteria and Standards Division. US EPA; Washington, DC: 1980. EPA-440/5-80-036. [Google Scholar]
- 21.World Health Organization. Chromium in Drinking Water. World Health Organization; Geneva, Switzerland: 2003. WHO/SDE/WSH?03.04/04. [Google Scholar]
- 22.Halliwell B. Biochemistry of oxidative stress. Biochem Soc Trans. 2007;35(5):1147–50. doi: 10.1042/BST0351147. [DOI] [PubMed] [Google Scholar]
- 23.Andreoli SP, McAteer JA, Seifert SA, Kempson SA. Oxidant-induced alterations in glucose and phosphate transport in LLC-PK1cells: Mechanisms of injury. Am J Physiol. 1993;265:F377–84. doi: 10.1152/ajprenal.1993.265.3.F377. [DOI] [PubMed] [Google Scholar]
- 24.Matalon S, Hardiman KM, Jain L, et al. Regulation of ion channel structure and function by reactive oxygen-nitrogen species. Am J Physiol Lung Cell Mol Physiol. 2003;285:L1184–9. doi: 10.1152/ajplung.00281.2003. [DOI] [PubMed] [Google Scholar]
- 25.Schliess F, Haussinger D. The cellular hydration state: a critical determinant for cell death and survival. Biol Chem. 2002;383(3–4):577–83. doi: 10.1515/BC.2002.059. [DOI] [PubMed] [Google Scholar]
- 26.Coudray C, Faure P, Rachidi S, et al. Hydroxyl radical formation and lipid peroxidation enhancement by chromium In vitro study. Biol Trace Elem Res. 1992;32(1–3):161–70. doi: 10.1007/BF02784601. [DOI] [PubMed] [Google Scholar]
- 27.Bagchi D, Hassoun EA, Bagchi M, Stohs SJ. Chromium-induced excretion of urinary lipid metabolites, DNA damage, nitric oxide production, and generation of reactive oxygen species in Sprague-Dawley rats. Comp Biochem Physiol C Pharmacol Toxicol Endocrinol. 1995;110(2):177–87. doi: 10.1016/0742-8413(94)00093-p. [DOI] [PubMed] [Google Scholar]
- 28.Dalle-Donne I, Ranieri R, Roberto C, Daniela G, Aldo M. Biomarkers of Oxidative Damage in Human Disease. Clin Chem. 2006;52(4):601–23. doi: 10.1373/clinchem.2005.061408. [DOI] [PubMed] [Google Scholar]
- 29.Devasagayam TPA, Boloor KK, Ramasarma T. Methods for estimating lipid peroxidation: an analysis of meruts and demerits. Indian J Biochem Biophysics. 2003;40(5):300–8. [PubMed] [Google Scholar]
- 30.Palmer HJ, Paulson KE. Reactive oxygen species and antioxidants in signal transduction and gene expression. Nutr Rev. 1997;55(10):353–61. doi: 10.1111/j.1753-4887.1997.tb01561.x. [DOI] [PubMed] [Google Scholar]
- 31.Reinardy HC, Syrett JR, Jeffree RA, Henry TB, Jha AN. Cobalt-induced genotoxicity in male zebrafish (Danio rerio), with implications for reproduction and expression of DNA repair genes. Aquat Toxicol. 2013;126:224–30. doi: 10.1016/j.aquatox.2012.11.007. [DOI] [PubMed] [Google Scholar]
- 32.Goodale BC, Walter R, Pelsue SR, et al. The cytotoxicity and genotoxicity of hexavalent chromium in medaka (Oryzias latipes) cells. Aqua Toxicol. 2008;87(1):60–7. doi: 10.1016/j.aquatox.2008.01.014. [DOI] [PubMed] [Google Scholar]
- 33.Chapman LM, Roling JA, Bingham LK, Herald MR, Baldwin WS. Construction of a subtractive library from hexavalent chromium treated winter flounder (Pseudopleuronectes americanus) reveals alterations in ion-selenium glutathione peroxidases. Aqua Toxicol. 2004;67:181–94. doi: 10.1016/j.aquatox.2003.12.006. [DOI] [PubMed] [Google Scholar]
- 34.Tice RR, Agurell E, Anderson D, et al. Single cell gel/comet assay: guidelines for in vitro and in vivo genetic toxicology testing. Environ Mol Mutagen. 2008;35(3):206–22. doi: 10.1002/(sici)1098-2280(2000)35:3<206::aid-em8>3.0.co;2-j. [DOI] [PubMed] [Google Scholar]
- 35.Olive PL. DNA damage and repair in individual cells: applications of the comet assay in radiobiology. Int J Rad Biol. 1999;75(4):393–405. doi: 10.1080/095530099140311. [DOI] [PubMed] [Google Scholar]
- 36.Olive PL, Banáth JP. The comet assay: a method to measure DNA damage in individual cells. Nature Protocols. 2006;1(1):23–9. doi: 10.1038/nprot.2006.5. [DOI] [PubMed] [Google Scholar]
- 37.Collins AR, Oscoz AA, Brunborg G, et al. The comet assay: topical issues. Mutagenesis. 2008;23(3):143–51. doi: 10.1093/mutage/gem051. [DOI] [PubMed] [Google Scholar]


