Abstract
Pain assessment in patients who are unable to verbally communicate with medical staff is a challenging problem in patient critical care. The fundamental limitations in sedation and pain assessment in the intensive care unit (ICU) stem from subjective assessment criteria, rather than quantifiable, measurable data for ICU sedation and analgesia. This often results in poor quality and inconsistent treatment of patient agitation and pain from nurse to nurse. Recent advancements in pattern recognition techniques using a relevance vector machine algorithm can assist medical staff in assessing sedation and pain by constantly monitoring the patient and providing the clinician with quantifiable data for ICU sedation. In this paper, we show that the pain intensity assessment given by a computer classifier has a strong correlation with the pain intensity assessed by expert and non-expert human examiners.
I. Introduction
Pain assessment in patients who are unable to verbally communicate with the medical staff is a challenging problem in patient critical care. This problem is most prominently encountered in sedated patients in the intensive care unit (ICU) recovering from trauma and major surgery, as well as infant patients and patients with brain injuries [1], [2]. Current practice in the ICU requires the nursing staff in assessing the pain and agitation experienced by the patient, and taking appropriate action to ameliorate the patient’s anxiety and discomfort.
The fundamental limitations in sedation and pain assessment in the ICU stem from subjective assessment criteria, rather than quantifiable, measurable data for ICU sedation. This often results in poor quality and inconsistent treatment of patient agitation from nurse to nurse. Recent advances in computer vision techniques can assist the medical staff in assessing sedation and pain by constantly monitoring the patient and providing the clinician with quantifiable data for ICU sedation. An automatic pain assessment system can be used within a decision support framework which can also provide automated sedation and analgesia in the ICU [3]. In order to achieve closed-loop sedation control in the ICU, a quantifiable feedback signal is required that reflects some measure of the patient’s agitation. A non-subjective agitation assessment algorithm can be a key component in developing closed-loop sedation control algorithms for ICU sedation.
Individuals in pain manifest their condition through “pain behavior” [4], which includes facial expressions. Clinicians regard the patient’s facial expression as a valid indicator for pain and pain intensity [5]. Hence, correct interpretation of the facial expressions of the patient and its correlation with pain is a fundamental step in designing an automated pain assessment system. Of course, other pain behaviors including head movement and the movement of other body parts, along with physiological indicators of pain, such as heart rate, blood pressure, and respiratory rate responses should also be included in such a system.
The current clinical standard in the ICU for assessing the level of sedation is an ordinal scoring system, such as the motor activity and assessment scale (MAAS) [6] or the Richmond agitation-sedation scale (RASS) [7], which includes the assessment of the level of agitation of the patient as well as the level of consciousness. Assessment of the level of sedation of a patient is, therefore, subjective and limited in accuracy and resolution, and hence, prone to error which in turn may lead to oversedation. In particular, oversedation increases risk to the patient since liberation from mechanical ventilation, one of the most common lifesaving procedures performed in the ICU, may not be possible due to a diminished level of consciousness and respiratory depression from sedative drugs resulting in prolonged length of stay in the ICU. Alternatively, undersedation leads to agitation and can result in dangerous situations for both the patient and the intensivist. Specifically, agitated patients can do physical harm to themselves by dislodging their endotracheal tube which can potentially endanger their life. In addition, an intensivist who must restrain a dangerously agitated patient has less time for providing care to other patients, making their work more difficult.
Computer vision techniques can be used to quantify agitation in sedated ICU patients. In particular, such techniques can be used to develop objective agitation measurements from patient motion. In the case of paraplegic patients, whole body movement is not available, and hence, monitoring the whole body motion is not a viable solution. In this case, measuring head motion and facial grimacing for quantifying patient agitation in critical care can be a useful alternative.
Although there is a vast potential for using computer vision for agitation and pain assessment, there are very few articles in the computer vision literature addressing this issue. In [8], an agitation assessment scheme is proposed for patients in the ICU. The approach of [8] is based on the hypothesis that facial grimacing induced by pain results in additional “wrinkles” (equivalent to edges in the processed image) on the face of the patient, and this is the only factor they use in assessing pain. Although this approach is computationally inexpensive and especially appealing for a real-time decision support system, it can be limiting since it does not account for other facial actions (e.g., smiling, crying, etc.), which may not necessarily correspond to pain. The authors in [2], [9] use various face classification techniques including support vector machines (SVM) and neural networks (NN) to classify facial expressions in neonates into “pain” and “non-pain” classes. Such classification techniques were shown to have reasonable accuracy.
In this paper, we extend the classification technique addressed in [2], [9] to distinguish pain from non-pain as well as assess pain intensity using a relevance vector machine (RVM) classification technique [10]. The RVM classification technique is a Bayesian extension of SVM which achieves comparable performance to SVM while providing posterior probabilities for class memberships and a sparser model. In a Bayesian interpretation of probability, as opposed to the classical interpretation, the probability of an event is an indication of the uncertainty associated with the event rather than its frequency [11]. If data classes represent “pure” facial expressions, that is, extreme expressions that an observer can identify with a high degree of confidence, the posterior probability of the membership of some intermediate facial expression to a class can provide an estimate of the intensity of such an expression. This, along with other pain behaviors, can be translated into one of the scoring systems currently being used for assessing sedation (e.g., MAAS or RASS).
II. Sparse Kernel Machines
In this section, we discuss two sparse kernel-based algorithms, namely, the support vector machine and the relevance vector machine. For a more comprehensive discussion on these methods, see [11].
A. Support Vector Machine Algorithm
The support vector machine (SVM) algorithm [11] is a sparse kernel algorithm used in classification and regression problems. Here we will briefly discuss the SVM framework for the two-class classification problem. Let the training set be given by x1, x2, …, xN, with target values given by z1, z2, …, zN, respectively, where xn ∈ ℝD and zn ∈ {−1, 1}, n = 1, 2, …, N. Moreover, assume that this training set is linearly separable in a feature space ℝM defined by the transformation φ : ℝD → ℝM ; that is, there exists a linear decision boundary in the feature space separating the two classes.
To classify a new data point x ∈ ℝD by predicting its target value z define y(x) = wTφ(x) + b, where w ∈ ℝM is a weight vector and b ∈ ℝ is a bias parameter. This representation can be rewritten in terms of a kernel function as , where an, n = 1, 2, …, N, and b are parameters determined by the training set xn and zn, n = 1, 2, …, N, and k(·, ·) is the kernel function. The sign of the function y(x) determines the class of x. More specifically, for a new data point x, the target value is given by z = sgn(y(x)), where , y ≠ 0, and sgn(0) ≜ 0. In the SVM approach the parameters w and b are chosen such that the margin, that is, the minimum distance between the decision boundary and the data points, is maximized. Hence, only a subset of the training data (i.e., support vectors) is used to determine the decision boundary. It can be shown that the solution to the SVM problem results in a convex optimization problem, and hence, a global optimum is guaranteed.
In the case where there is an overlap between the two data classes, the SVM algorithm can be modified by allowing misclassification of the data points. In this case the margin is maximized while penalizing misclassified points. Such a trade-off is controlled by a positive complexity parameter C, which is determined using a hold-out method such as cross-validation [11].
B. Relevance Vector Machine Algorithm
The SVM algorithm, although a powerful classifier, has a number of limitations. A key deficiency of the approach is the fact that the output of the SVM algorithm is the classification decision and not the class membership posterior probability. As will be discussed in Section III, methods which possesses an inherent Bayesian structure are more powerful and can provide more information. Such methods not only classify a new point, but also provide a degree of uncertainty (in terms of posterior probabilities) for such a classification. The relevance vector machine (RVM) algorithm [10] is a Bayesian sparse kernel algorithm, which can be regarded as the Bayesian extension of the SVM algorithm.
Next, we briefly review the method for the classification problem involving two data classes, namely
 and
and
 . Let the training set be given by x1, x2, …, xN, with target values given by z1, z2, …, zN, where xn ∈ ℝD and zn ∈ {0, 1}, n = 1, 2, …, N, xn ∈
 if zn = 1, and xn ∈
 if zn = 0. For a new data point x ∈ ℝD, we predict the associated class membership posterior probability distribution, namely, p(
 |x), k = 1, 2, where p(x) represents the probability density function of the random variable x and p(
 |x) is the conditional probability of the data class
 given the data point x. The class membership posterior probability for a given data point x is given by
| (1) |
where φ : ℝD → ℝM is a fixed feature-space transformation, with components φ(x) = [φ1(x), φ2(x), … φM (x)]T ∈ ℝM, w = [w1, w2, … wM]T ∈ ℝM is the weight vector, and σ(·) is the logistic sigmoidal function defined by . Note that the RVM algorithm is a special case of the above model. Specifically, in the RVM algorithm wTφ(x) in (1) has a special form (similar to the SVM algorithm) given by , where k(·, ·) is the kernel function. Hence, the class membership posterior probability for a given data point x is given by
| (2) |
In the sequel, we consider the general formulation (1). Each weight parameter wi, i = 1, …, M, in (1) is assumed to have a zero-mean Gaussian distribution, and hence, the weight prior distribution is given by
| (3) |
where αi, i = 1, 2, …, M, is the precision corresponding to the weight component wi, α = [α1, α2, … αM]T ∈ ℝM, and
 (x|μ, σ2) represents the normal distribution with mean μ and variance σ2. The parameters αi, i = 1, 2, …, M, in the prior distribution (3) are called the hyperparameters.
The hyperparameters αi, i = 1, 2, …, M, can be determined by maximizing the marginal likelihood distribution p(w|z, α), where z = [z1, z2, … zN]T ∈ ℝN. As a result of the maximization of the marginal likelihood distribution, a number of the hyperparameters αi approach infinity. Thus, the corresponding weight parameter wi will be centered at zero, and hence, the corresponding component of the feature vector φi(x) plays no role in the prediction, resulting in a sparse predictive model. For further details of this approach, see [10], [11].
III. Pain and Pain Intensity Assessment
In this section, we use the classification techniques described in Section II in order to assess pain in infants using their facial expressions. For our data set we use the Infant Classification of Pain Expressions (COPE) database [2]. As was shown in [2], the SVM can classify facial images into two groups of “pain” and “non-pain” with an accuracy between 82% to 88%. Here we extend the results of [2] to additionally assess pain intensity using the class membership posterior probability. Note that although we consider infants, studies have shown that the pain-induced facial expressions in newborns are similar to those observed in older children and adults [12]. Hence, we expect that the approach discussed in this paper to be applicable to adult pain assessment as well.
Before applying the classification techniques to the facial images, we give a brief description of the infant COPE database used in our experimental results.
A. Infant COPE Database
The infant COPE database is composed of 204 color photographs of 26 Caucasian neonates (13 boys and 13 girls) with an age range of 18 hours to 3 days. The photographs were taken after a series of stress-inducing stimuli were administered by a nurse. The stimuli consist of the following [2]:
Transport from one crib to another.
Air stimulus, where the infant’s nose was exposed to a puff of air.
Friction, where the external lateral surface of the heel was rubbed with a cotton wool soaked in alcohol.
Pain, where the external surface of the heel was punctured for blood collection.
The facial expressions induced by the first three stimuli are classified as non-pain. Four photographs of a subject are given in Figure 1. One of the challenges in the recognition of pain, even for clinicians, is the ability to distinguish an infant’s cry induced by pain and some other non-painful stimulus.
Fig. 1.

Four different expressions of a subject. The 2 left images correspond to non-pain, whereas the 2 right images correspond to pain.
B. Pain Recognition using Sparse Kernel Machine Algorithms
The classification techniques discussed in Section II were used to identify the facial expressions corresponding to pain. A total of 21 subjects from the infant COPE database were selected such that for each subject at least one photograph corresponded to pain and one to non-pain. The total number of photographs available for each subject ranged between 5 to 12, with a total of 181 photographs considered. We applied the leave-one-out method for validation [11].
In the preprocessing stage, the faces were standardized for their eye position using a similarity transformation. Then, a 70 × 93 window was used to crop the facial region of the image and only the grayscale values were used. For each image, a 6510-dimensional vector was formed by column stacking the matrix of intensity values. We used the OSU SVM MATLAB Toolbox [13] to run the SVM classification algorithm. The classification accuracy for the SVM algorithm with a linear kernel was 90%, where, as suggested in [2], we chose the complexity parameter C = 1. The number of support vectors averaged 5. Applying the RVM algorithm with a linear kernel to the same data set resulted in an almost identical classification accuracy, namely, 91%; while the number of relevance vectors was reduced to 2. However, in 5 out of the 21 subjects considered, the algorithm did not converge. This is due to the fact that, in contrast to the SVM algorithm, the RVM algorithm involves a non-convex optimization problem [11].
C. Pain Intensity Assessment
In addition to classification, the RVM algorithm provides the posterior probability of the membership of a test image to a class. As discussed earlier, using a Bayesian interpretation of probability, the probability of an event can be interpreted as the degree of the uncertainty associated with such an event. This uncertainty can be used to estimate pain intensity. In particular, if a classifier is trained with a series of facial images corresponding to pain and non-pain, then there is some uncertainty for associating the facial image of a person experiencing moderate pain to the pain class. The efficacy of such an interpretation of the posterior probability was validated by comparing the algorithm’s pain assessment with that assessed by several experts (intensivists) and non-experts.
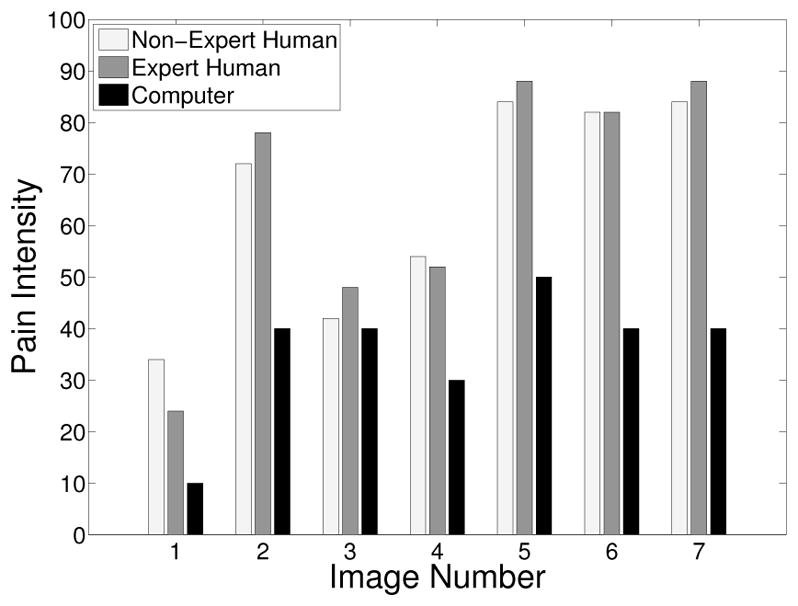
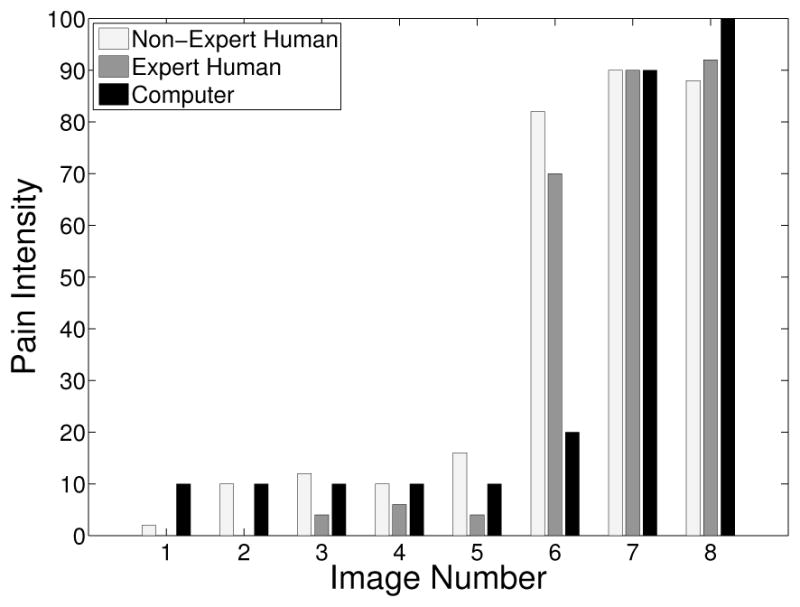
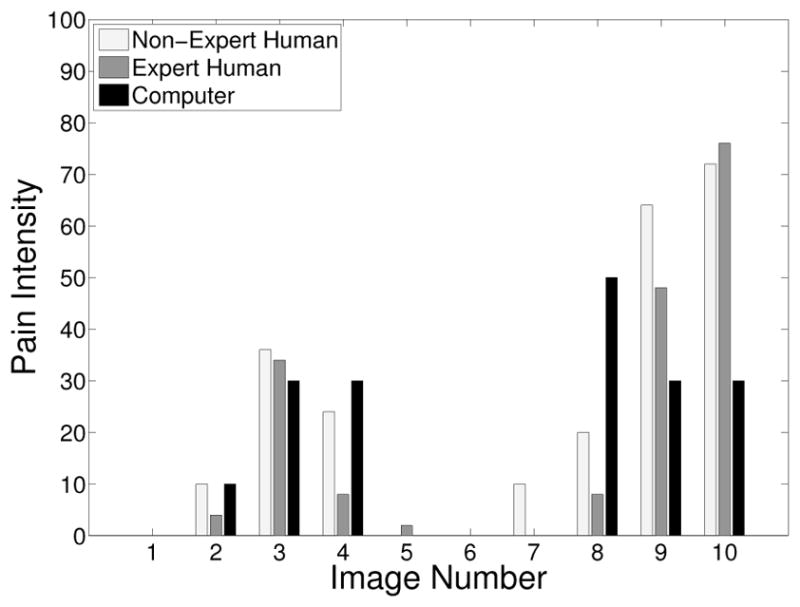
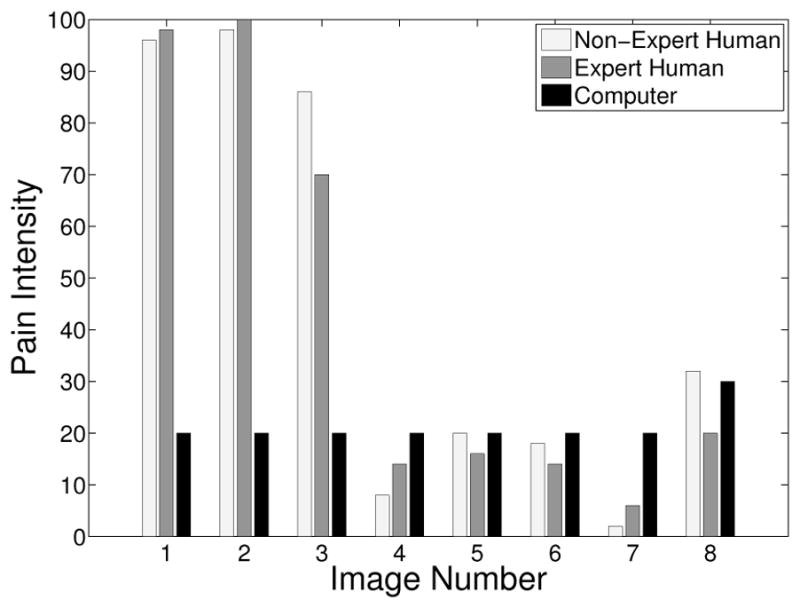
In order to compare the pain intensity assessment given by the RVM algorithm with human assessment, we compared the subjective measurement of the pain intensity assessed by expert and non-expert examiners with the uncertainty in the pain class membership (posterior probability) given by the RVM algorithm. We chose 5 random infants from the COPE database, and for each subject two photographs of the face corresponding to the non-pain and pain conditions were selected. In the selection process, photographs were selected where the infant’s facial expression truly reflected the pain condition—calm for non-pain and distressed for pain—and a score of 0 and 100, respectively, was assigned to these photographs to give the human examiner a fair prior knowledge for the assessment of the pain intensity.
Ten data examiners were asked to provide a score ranging from 0 to 100 for each new photograph of the same subject, using a multiple of 10 for the scores. Five examiners with no medical expertise and five examiners with medical expertise were selected for this assessment. The medical experts were members of the clinical staff at the intensive care unit of the Northeast Georgia Medical Center, Gainesville, GA, consisting of one medical doctor, one nurse practitioner, and three nurses. They were asked to assess the pain for a series of random photographs of the same subject, with the criterion that a score above 50 corresponds to pain, and with the higher score corresponding to a higher pain intensity. Analogously, a score below 50 corresponds to non-pain, with the higher score corresponding to a higher level of discomfort. The posterior probability given by the RVM algorithm with a linear kernel for each corresponding photograph was rounded off to the nearest multiple of 10.
The pain scores for the 5 infant subjects are given in Figures 2 – 6, where the average score of the expert and non-expert human examiners are compared to the score given by the RVM algorithm. We used the weighted kappa coefficient [14] to measure the agreement in the pain intensity assessment between the human examiners and the RVM algorithm. This coefficient is 0.48 for human experts and 0.52 for non-experts as compared with the RVM for the 5 subjects considered in the study which shows a moderate agreement. The results show an almost identical classification accuracy for a binary classification (with a score above 50 corresponding to pain). In particular, the non-expert human examiner, the expert human examiner, and the RVM classification accuracy is given by 87%, 85%, and 85%, respectively. Moreover, the results show that the expert human and non-expert human examiners tend to give the same pain intensity score based on the photographs of the facial expressions.
Fig. 2.

Pain score for Subject 1
Fig. 6.

Pain score for Subject 5
Fig. 3.

Pain score for Subject 2
Fig. 4.

Pain score for Subject 3
Fig. 5.

Pain score for Subject 4
Acknowledgments
This work was supported in part by grants from NSF, AFOSR, ARO, as well as by a grant from NIH (NAC P41 RR-13218).
The authors would like to thank Professor Sheryl Brahnam for providing the infant COPE database.
Contributor Information
Behnood Gholami, Email: behnood@gatech.edu, School of Aerospace Engineering, Georgia Institute of Technology, Atlanta, GA, 30332-0150.
Wassim M. Haddad, Email: wm.haddad@aerospace.gatech.edu, School of Aerospace Engineering, Georgia Institute of Technology, Atlanta, GA, 30332-0150
Allen R. Tannenbaum, Email: tannenba@ece.gatech.edu, Schools of Electrical & Computer and Biomedical Engineering, Georgia Institute of Technology, Atlanta, GA, 30332-0150
References
- 1.Herr K, Coyne P, Key T, Manworren R, McCaffery M, Merkel S, Pelosi-Kelly J, Wild L. Pain assessment in the nonverbal patient: Position statement with clinical practice recommendation. Pain Manag Nurs. 2006;7:44–52. doi: 10.1016/j.pmn.2006.02.003. [DOI] [PubMed] [Google Scholar]
- 2.Brahnam S, Nanni L, Sexton R. Introduction to neonatal facial pain detection using common and advanced face classification techniques. Stud Comput Intel. 2007;48:225–253. [Google Scholar]
- 3.Haddad WM, Bailey JM. Closed-loop control for intensive care unit sedation. Best Pract Res Clin Anaesth. doi: 10.1016/j.bpa.2008.07.007. in press. [DOI] [PubMed] [Google Scholar]
- 4.Fordyce WE. Pain and suffering: A reappraisal. Am Psych. 1988;43:276–283. doi: 10.1037//0003-066x.43.4.276. [DOI] [PubMed] [Google Scholar]
- 5.Craig KD, Prkachin KM, Grunau RVE. The facial expression of pain. In: Turk D, Melzack R, editors. Handbook of Pain Assessment. New York, NY: Guilford; 2001. [Google Scholar]
- 6.Devlin J, Boleski G, Mlynarek M, Nerenz D, Peterson E, Jankowski M, Horst H, Zarowitz B. Motor activity assessment scale: A valid and reliable sedation scale for use with mechanically ventilated patients in an adult surgical intensive care unit. Crit Care Med. 1999;1:1271–1275. doi: 10.1097/00003246-199907000-00008. [DOI] [PubMed] [Google Scholar]
- 7.Sessler C, Gosnell M, Grap MJ, Brophy G, O’Neal P, Keane K, Tesoro E, Elswick R. The Richmond agitation-sedation scale. Am J Resp Crit Care Med. 2002;166:1338–1344. doi: 10.1164/rccm.2107138. [DOI] [PubMed] [Google Scholar]
- 8.Becouze P, Hann C, Chase J, Shaw G. Measuring facial grimacing for quantifying patient agitation in critical care. Comp Meth Programs Biomed. 2007;87:138–147. doi: 10.1016/j.cmpb.2007.05.005. [DOI] [PubMed] [Google Scholar]
- 9.Brahnam S, Chuang CF, Randall S, Shih F. Machine assessment of neonatal facial expressions of acute pain. Dec Supp Sys. 2007;43:1242–1254. [Google Scholar]
- 10.Tipping ME. Sparse Bayesian learning and the relevance vector machine. J Mach Learn Res. 2001;1:211–244. [Google Scholar]
- 11.Bishop CM. Pattern Recognition and Machine Learning. New York, NY: Springer; 2006. [Google Scholar]
- 12.Craig KD, Hadjistavropoulos HD, Grunau RVE, Whitfield MF. A comparison of two measures of facial activity during pain in the newborn child. J Ped Psych. 1994;19:305–318. doi: 10.1093/jpepsy/19.3.305. [DOI] [PubMed] [Google Scholar]
- 13.OSU SVM Toolbox for MATLAB. http://sourceforge.net/projects/svm.
- 14.Cohen J. Weighted kappa: nominal scale agreement with provision for scale disagreement or partial credit. Psych Bull. 1968;70:213–220. doi: 10.1037/h0026256. [DOI] [PubMed] [Google Scholar]


