Abstract
Purpose
To develop a T2*-compensated parallel imaging and compressed sensing framework for water-fat separation, and to demonstrate accelerated quantitative imaging of proton density fat fraction.
Materials & Methods
The proposed method extends a previously developed framework for water-fat separation by additionally compensating for T2* decay. A two stage estimation was formulated that first determines an approximation of the B0 field map and then jointly estimates and refines the R2* (=1/T2*) and B0 field maps, respectively. The method was tested using a set of water-fat phantoms as well as liver datasets that were acquired from seven asymptomatic adult volunteers. The fat fraction estimates were compared to those from a commonly used non-accelerated water-fat imaging method and also to a sequential parallel imaging and water-fat imaging method.
Results
The proposed method properly compensated for T2* decay to yield accurate fat fraction estimates in the water-fat phantoms. Further, linear regression analysis from the liver datasets showed that the proposed method accurately estimated fat fraction at acceleration factors that were higher than those achievable by the sequential parallel imaging and water-fat imaging method. Accurate fat fraction estimates were demonstrated at acceleration factors up to 4x, although some image artifacts were observed.
Conclusion
The proposed T2*-compensated parallel imaging and compressed sensing framework demonstrates the potential to further accelerate water-fat imaging while maintaining accurate estimates of proton density fat fraction.
Keywords: accelerated imaging, water-fat imaging, chemical shift encoding
INTRODUCTION
The renewed interest in water-fat imaging (1) has led to the development of a quantitative imaging biomarker known as the proton density fat fraction (PDFF) (2). The importance of this biomarker is underscored by two factors: 1) the increasing prevalence of nonalcoholic fatty liver disease (NAFLD), which is now estimated to affect 20-30% of people in the United States, and 2) the inadequacies of biopsy, which include risk, invasiveness, and the variability in sampling that can cause contradicting diagnoses (3,4). The development of an MRI-based method provides the potential for a safe, noninvasive, and reliable alternative to biopsy for the diagnosis and grading of steatosis (5). Recent studies have demonstrated the accuracy and/or precision of chemical shift encoded methods in estimating the PDFF (hereafter referred to as fat fraction) (6-8).
The benefits of an MRI-based method for quantifying liver fat fraction naturally come with the limitations of MRI. Of particular relevance is the lengthy scan time, which is further compounded in chemical shift encoded MRI due to the need for measurements at multiple echo times. This presents an especially challenging problem for liver imaging in which the patient must maintain a breath-hold during the scan to avoid respiratory-related image artifacts. A compromise is often made between spatial resolution, volume coverage, and/or SNR to achieve a manageable breath-hold time.
Acceleration techniques have been proposed with the goal of reducing the degree of needed compromise between imaging parameters. The most common technique uses parallel imaging to un-alias the echo time images followed by water-fat imaging to recover the signals of interest (7,9). In this case, acceleration is achieved by exploiting only the distinct spatial sensitivities of the receiver elements. It is conceivable that incorporating additional acceleration techniques, such as constrained reconstruction (10) and/or compressed sensing (11), could lead to an even higher acceleration while maintaining accurate estimates of fat fraction.
The goal of this work is to develop and demonstrate the feasibility of a joint parallel imaging and compressed sensing technique for estimating liver fat fraction. Whereas previous works (12-15) have used parallel imaging and/or compressed sensing for qualitative water-fat imaging, the focus of this work is in accurately quantifying fat fraction. We extend a previously developed framework for water-fat separation (14) that employed parallel imaging and compressed sensing to achieve acceleration in the liver, brachial plexus, ankle, and knee. The current work extends that framework by additionally compensating for the effects of T2* decay to allow for accurate liver fat fraction estimates. The proposed method is tested on a set of water-fat phantoms and is then demonstrated on seven asymptomatic adult volunteers. It is shown to accurately estimate fat fraction at acceleration factors that are higher than those achievable by the sequential parallel imaging and water-fat imaging technique.
MATERIALS AND METHODS
Signal Model
We extend the formulation that was proposed in previous work (14) by including the effects of T2* on the received signal. Doing so is especially critical when estimating fat fraction in the liver due to the potential presence of iron (16), which increases the rate of signal decay. Both Yu et al. (17) and Bydder et al. (18) have shown that T2* compensation is necessary for accurate fat fraction quantitation, particularly when the patient exhibits hepatic iron overload.
The signal model, presented in Eq. 1, relates the unknown signals of interest directly to the acquired data.
| [1] |
The undersampled k-space measurements from all coils and at all echo times (ku) are modeled as a function of the known k-space sampling (Fu), unknown normalized coil sensitivity maps (C), unknown B0 field map (ψ) and R2* (=1/T2*) map (both represented in ψR), known chemical shift encoding matrix (A), and the unknown coil-combined water and fat images (ρ), in the presence of additive Gaussian noise with zero mean and covariance matrix Σ. The term ψR is a block diagonal matrix that contains exp(-j2πψp tn)·exp(-R2*p·tn) at the pth diagonal element of the nth block, where p and n serve as indices over the pixels and echo times, respectively.
Signal Estimation
Because the R2* term appears in the argument of an exponential function, it is natural to consider updating its estimate alongside the B0 field map term (17). Under our simplifying assumption of additive white Gaussian noise (i.e. Σ = σ2I), Figure 1 shows the least squares cost as a function of B0 field map and R2* map values for one pixel from a fully-sampled six-echo liver dataset. This exemplary cost surface is a nonconvex function of both the B0 field map and the R2* map parameters. Thus, standard convex minimization may result in local minima (i.e. suboptimal) estimates. However, we have observed that in the neighborhood of the true B0 field map value, the cost is a convex function of both parameters. This observation suggests that estimation can be done in two stages: first, an approximation of the B0 field map is found (setting R2* = 0) and second, the B0 field and R2* maps are jointly refined and estimated, respectively. A similar two stage approach was proposed by Berglund et al. (19), although their motivation for doing so was to reduce both computational complexity and memory requirements.
Figure 1.
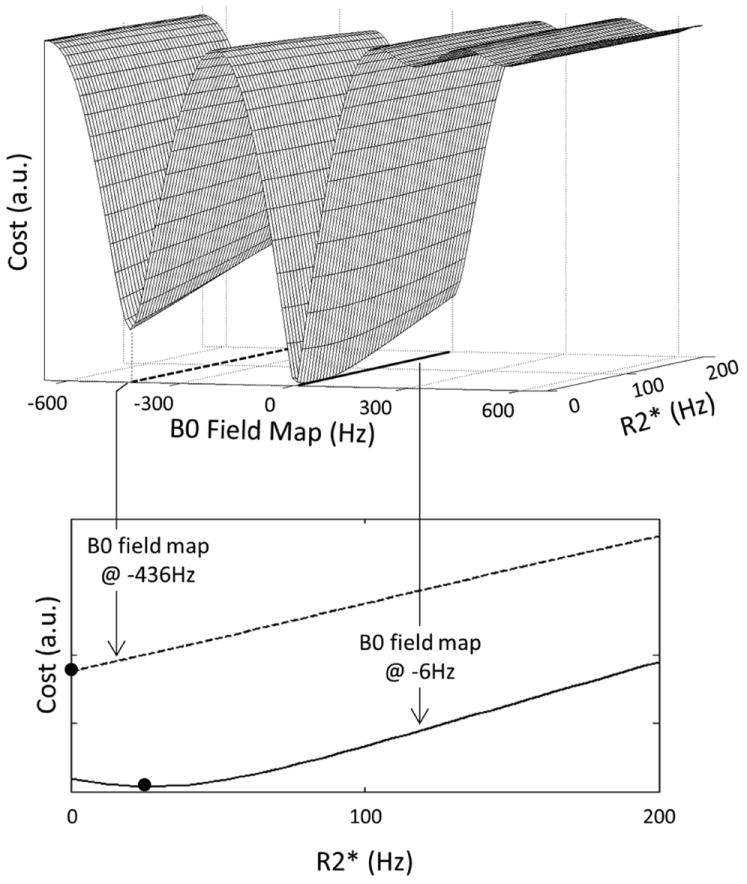
The least squares cost (top figure) for one representative pixel from a fully-sampled six-echo liver dataset is a nonconvex function of the B0 field map and R2* parameters. At different values of the B0 field map (denoted by the dashed and solid lines in the top figure), the cost function is minimized at different values of R2* (solid dots in the bottom figure). These observations suggest that standard convex minimization algorithms may converge to local minima (i.e. non-optimal) solutions. To address this issue, a two stage estimation scheme was proposed in which an approximation of the B0 field map is found (setting R2* = 0) followed by a joint refinement and estimation of the B0 field and R2* maps, respectively.
As with the water and fat images and the B0 field map, a regularization criterion should be imposed on the estimate of the R2* map to compensate for the non-acquired k-space samples. In general this criterion does not prevent convergence to local minima, however the proposed two stage estimation permits the assumption of a cost function that is convex with respect to the R2* map parameter. Under this assumption, techniques such as l1-regularization are applicable with an appropriate sparsifying transform. In particular, we have found that only 15-25% of the Daubechies-4 (db4) wavelet transform coefficients are needed to provide a sufficient representation of the R2* map. Thus, an l1-penalty on the db4 wavelet coefficients of the R2* map should help to guide the reconstruction to the true solution.
We compute the first-order Taylor series expansion of the exponential function exp(-R2*p·tn) to update the estimate of the R2* map. Using this approximation, the R2* map (and the B0 field map) update terms are calculated using the following expression.
| [2] |
In Eq. 2, r is a vector whose elements contain the difference between the measured k-space and the current estimate of k-space, x is the linear function that relates the B0 field map update term (Δψ) and the R2* map update term (ΔR2*) to r, λ is the user defined regularization parameter, W represents the db4 wavelet transform, and Bmax is the finest-scale cubic B-spline set. The use of cubic B-splines has been shown to compactly represent the B0 field map estimate while avoiding local minima that would cause a water-fat swap (14).
By estimating the R2* map in this manner, the remaining parameters of interest may be estimated by the method that was proposed in previous work (14). In particular, the coil sensitivity maps are derived from the SPIRiT (20) k-space kernel and the water and fat images are estimated by minimizing a cost function that balances data fidelity with an l1-penalty on the db4 wavelet coefficients of the images, as seen in Eq. 3, where the ‘hat’ denotes current estimates. For simplicity, we use the same value of λ in Eqs. 2 and 3, while acknowledging the potential for further optimization.
| [3] |
The estimation algorithm is summarized in Figure 2.
Figure 2.
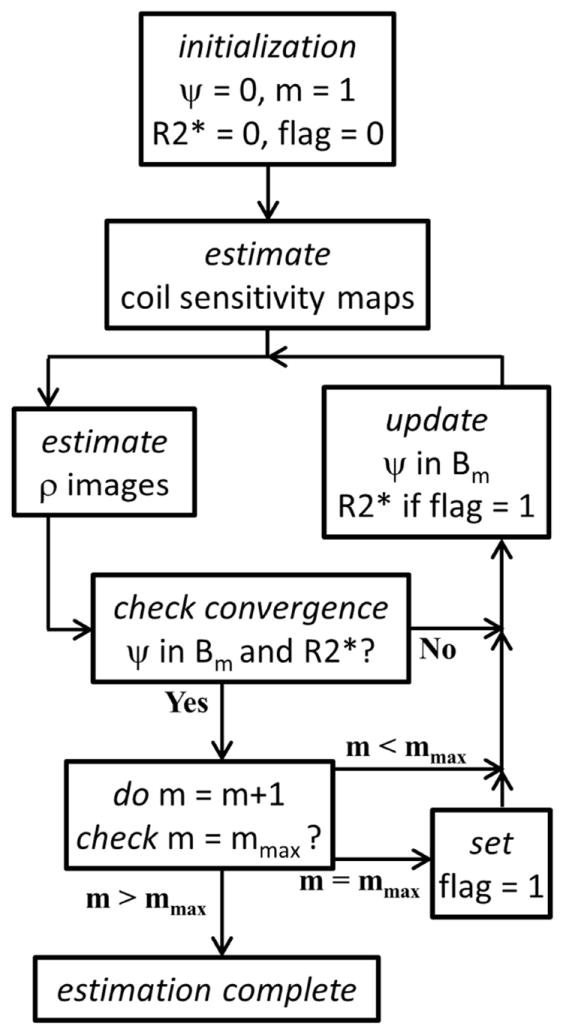
A flowchart depicting the estimation algorithm. After estimating the coil sensitivity maps, the water and fat images (ρ) and the B0 field (ψ) and R2* maps are alternately estimated. The B0 field map is updated using cubic B-splines of successively finer scale, where m represents the scale and Bm is the corresponding B-spline set. The R2* map is estimated only upon reaching the finest scale mmax. Convergence is reached when both the B0 field and the R2* map update terms (Δψ and ΔR2*, respectively) have a maximum absolute value of less than 1Hz.
Experiments
Acquisition & Reconstruction
Data were acquired on a GE Signa EXCITE HDxt 3T (Version 16) system (GE Healthcare, Waukesha, WI). Fully-sampled k-space measurements were acquired at six different echo times using an investigational version of the GE IDEAL-IQ sequence (GE Healthcare, Waukesha, WI). The acquisition parameters are listed in Table 1.
Table 1. Data Acquisition Parameters.
The fully-sampled k-space data were acquired at six echo times using the parameters that are listed in this table. The Δz term denotes slice thickness and ΔTE is the echo spacing.
| Object | Coil | Matrix Size | FOV (cm) | Δz (mm) | Flip Angle (deg) | TE1 (ms) | ΔTE (ms) | Scan Time (mm:ss) |
|---|---|---|---|---|---|---|---|---|
| Phantom | eight-channel head | 256×256×8 | 20 | 4.1 | 5 | 1.57 | 0.9 | 01:01 |
| Liver | eight-channel torso | 160×160×8 | 32 - 44 | 5 | 5 | 1.08 | 0.668 - 0.754 | 00:18 - 00:20 |
Images were reconstructed using up to three different methods (described later). For all methods other than the proposed one, a phase preserving algorithm (21) was implemented on an echo-by-echo basis to combine the individual coil images at each echo time. This coil combination step was done immediately prior to the water-fat reconstruction. Note that coil combination was not performed when using the proposed method since the signals of interest are estimated directly from the undersampled k-space measurements. In all reconstructions, we assumed a six-peak fat spectrum (9) with known relative amplitudes and frequency shifts. The fat fraction image was calculated from the water and fat estimates using the magnitude discrimination method (22). Lastly, the value of the regularization parameter was selected based on subjective assessment of image quality. A value of 4.5 was used for all of the reconstructions presented in this paper. Image reconstruction was performed in Matlab R2011a (The Mathworks Inc., Natick, MA), which was installed on a personal computer (8 GB RAM, 2.8 GHz dual-core processor).
Phantom
Three water-fat phantoms were constructed, each containing a different concentration of distilled water and 20% Intralipid (Baxter Healthcare, Deerfield, IL). The first phantom contained only distilled water, the second contained equal parts by mass of distilled water and 20% Intralipid, and the third contained only 20% Intralipid. One milligram of manganese chloride (J.T. Baker, Center Valley, PA) was dissolved in each phantom to create a T2* shortening effect. The phantoms were placed in a circular glass container together with other phantoms that were not a part of this experiment. The container was filled with tap water to reduce susceptibility.
The center slice was reconstructed using an in-house implementation of the IDEAL algorithm (23) without and with T2* compensation (17) to determine the effects on the fat fraction estimate. To demonstrate the feasibility of the proposed method, the fully-sampled k-space data were retrospectively undersampled using a variable-density Poisson disk sampling pattern. The central 16 phase encoding lines were retained to estimate the 7×7 SPIRiT kernel, yielding a net acceleration factor of 3.4x. The retrospectively undersampled data were then reconstructed using the proposed method.
Liver
Based on previous MRI scans, an effort was made to choose a subject cohort that represented a spectrum of liver fat fractions. The presence of iron in the liver was not an inclusion/exclusion criterion in this study. Each subject was instructed to maintain a breath-hold during the 18-20s scan.
The center two slices from each subject were reconstructed using the following three methods. First, the fully-sampled dataset was reconstructed using an in-house implementation of T2*-IDEAL (17). The estimates from this reconstruction served as the references. Second, the fully-sampled data were uniformly undersampled at net acceleration rates of 2.5x, 3.1x, 3.6x, and 4x, and were then reconstructed using Autocalibrating Reconstruction for Cartesian sampling (ARC) (24) followed by T2*-IDEAL (ARC/T2*-IDEAL) (7,9). We used the ARC implementation that is found in the SPIRiT (20) software package. Lastly, the fully-sampled data were undersampled using a variable-density Poisson disk sampling pattern at the same net acceleration rates as for ARC/T2*-IDEAL, and were then reconstructed using the proposed method. In both ARC/T2*-IDEAL and the proposed method, the 16 central phase encoding lines were retained to estimate the 7×7 k-space kernels.
A total of three ROIs were placed in each fat fraction image. The water image was used as a guide to avoid placing the ROIs in regions of large vessels. Each ROI was 9 × 9 pixels, which was approximately 2.2 × 2.2 cm2.
RESULTS
Figure 3 shows the estimated fat fraction images for the three water-fat phantoms using 1x IDEAL without and with T2* compensation as well as the proposed method at 3.4x acceleration. By not accounting for T2* decay, the fat fraction is overestimated by between 4-5%. The fat fraction estimates using T2*-IDEAL and the proposed method are in close agreement with the expected values and a similar image quality is observed between the two methods.
Figure 3.
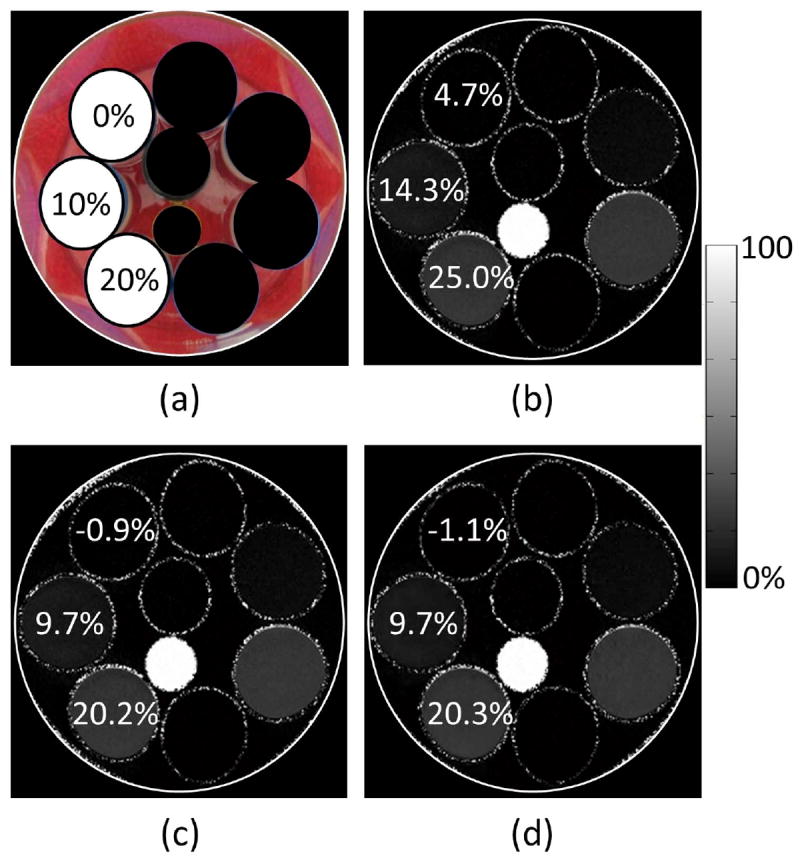
(a) Photograph of three water-fat phantoms that were constructed using different concentrations of distilled water and Intralipid. One milligram of manganese chloride was dissolved in each phantom to create a T2* shortening effect. The expected fat fraction value is shown for each phantom. The remaining phantoms in the photograph were not a part of this experiment. (b) The estimated fat fractions using IDEAL without T2* compensation. An overestimation of between 4-5% is seen when T2* is not accounted for. (c) The estimated fat fractions using IDEAL with T2* compensation (T2*-IDEAL). The estimated values agree closely with the expected values. (d) The estimated fat fractions using the proposed method at 3.4x acceleration. Accurate estimates are maintained at this acceleration factor. In addition, a similar image quality is observed between the proposed method and T2*-IDEAL.
Figure 4 shows the fat fraction estimates for one slice using 1x T2*-IDEAL as well as for ARC/T2*-IDEAL and the proposed method at net acceleration rates of 2.5x, 3.1x, 3.6x, and 4x. Unresolved aliasing artifacts are seen throughout the images estimated by ARC/T2*-IDEAL, which causes inaccurate fat fraction estimates especially at the higher acceleration factors. Using the proposed method, the fat fraction estimates are in close agreement with the reference values and image quality is largely preserved, although some artifacts are observed at 4x acceleration.
Figure 4.
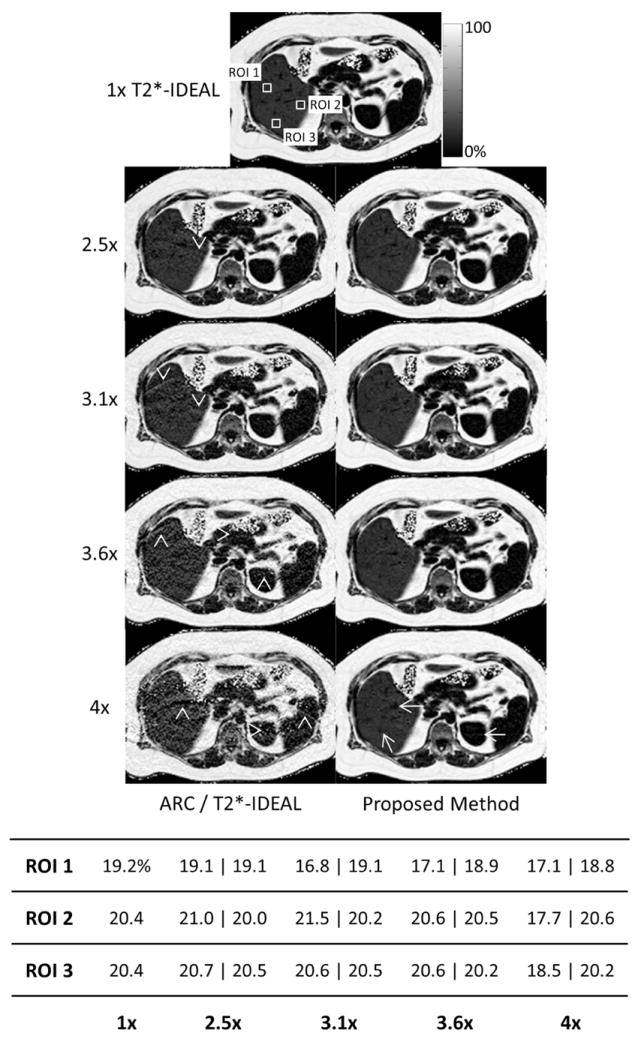
The fat fraction image estimates using 1x T2*-IDEAL as well as ARC/T2*-IDEAL and the proposed method at four acceleration factors. The table shows the fat fraction estimates for each ROI. For the accelerated methods, the ROI fat fraction estimates are displayed as ARC/T2*-IDEAL ∣ proposed method. Unresolved aliasing artifacts are observed in all of the images estimated using ARC/T2*-IDEAL (arrowheads), with increased severity at the higher acceleration factors. These artifacts affect the quantitation. Image quality using the proposed method is largely preserved, although artifacts are apparent at 4x acceleration (arrows). However, the accuracy of the fat fraction estimates remains fairly consistent across all acceleration factors.
Figure 5 shows scatterplots of the estimated fat fractions from both ARC/T2*-IDEAL and the proposed method versus the reference fat fraction values. The equations of the linear trendlines are also shown. The coefficient of determination (R2) for each of those linear trendlines is plotted in Figure 6. The falloff of the R2 values for ARC/T2*-IDEAL indicates a reduced goodness of fit at the higher acceleration factors, which is qualitatively observed in Figure 5. In contrast, the R2 values for the proposed method remain above 0.99 for all acceleration factors. Figure 7 shows scatterplots of the standard deviation of the fat fraction estimates versus the reference fat fraction value for each of the three reconstruction methods. For all of the methods, the low R2 values from linear regression analysis indicate that the standard deviation does not exhibit a strong linear dependence on the reference fat fraction value. Qualitatively, one may observe that the standard deviations tend to be higher for ARC/T2*-IDEAL than for the other two methods. This observation is supported by Table 2, which lists the mean of the standard deviations for each method.
Figure 5.
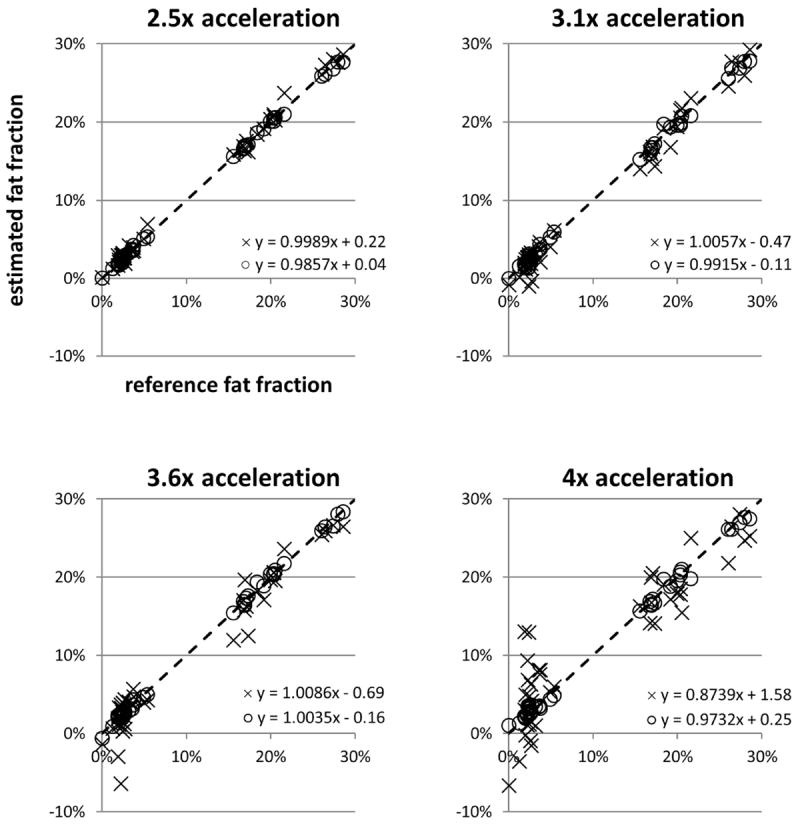
Scatterplots and linear trendline equations of the estimated fat fraction versus reference fat fraction for ARC/T2*-IDEAL (×) and the proposed method (○) at each acceleration factor. Each point in the plot represents the estimates in one ROI. The identity line is denoted by dashes.
Figure 6.
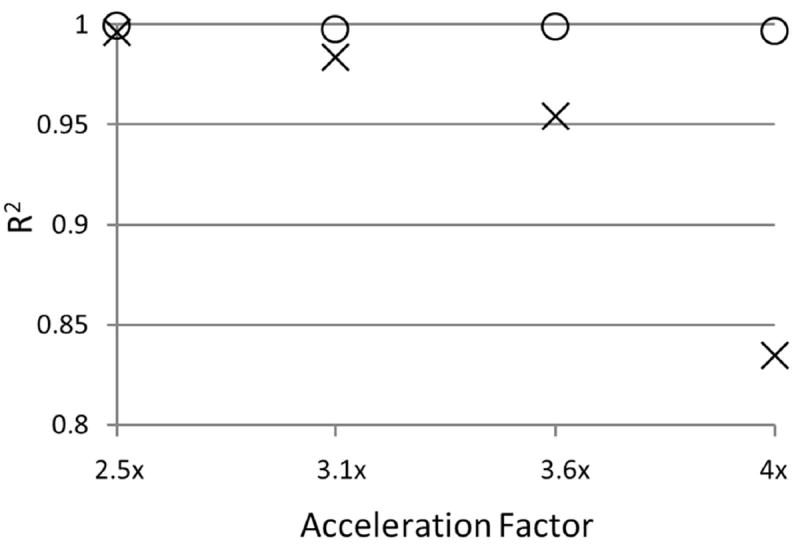
The coefficient of determination (R2) of the linear trendlines for ARC/T2*-IDEAL (×) and the proposed method (○) at each acceleration factor. Observe the falloff of the R2 value for ARC/T2*-IDEAL, which indicates a reduced goodness of fit of the linear trendline at higher acceleration factors. The R2 values for the proposed method remain above 0.99 at all acceleration factors.
Figure 7.
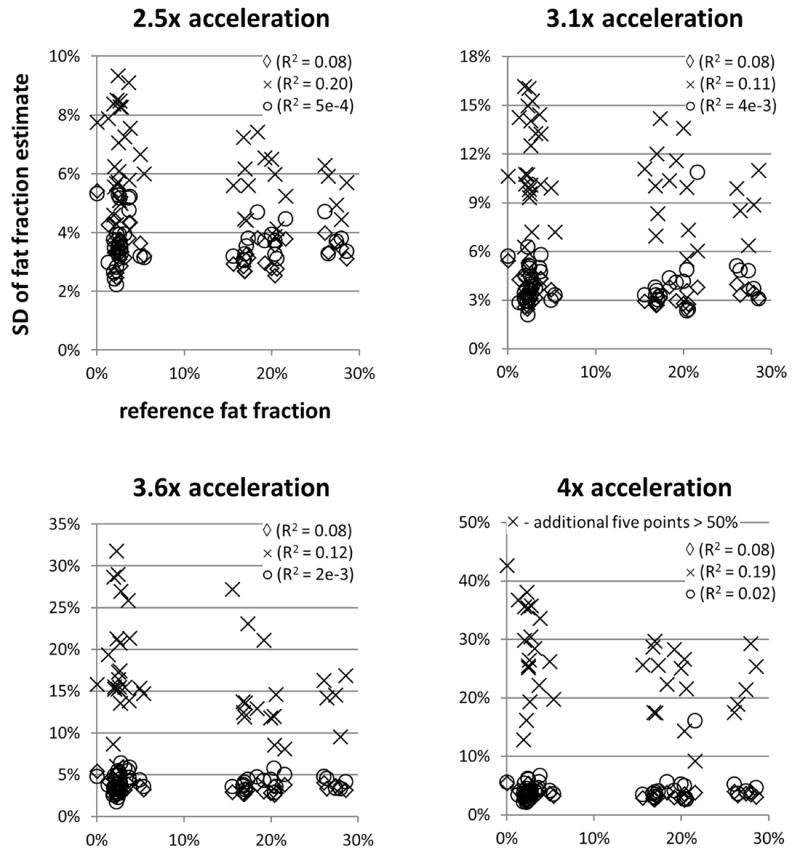
Scatterplots showing the standard deviation (SD) of the fat fraction estimates in the ROI versus the reference fat fraction value for T2*-IDEAL (◊), ARC/T2*-IDEAL (×), and the proposed method (○). Note that the SD values for T2*-IDEAL (◊) are for 1x acceleration. At all acceleration factors, the average standard deviation for ARC/T2*-IDEAL was higher than that for the proposed method. For all three methods, the low R2 values indicate that the standard deviation of the fat fraction estimates does not exhibit a strong linear dependence on the reference fat fraction value.
Table 2. Average of the Standard Deviations of the Fat Fraction Estimates.
Each entry was calculated as the simple average of the standard deviation values over all ROIs.
| 1x | 2.5x | 3.1x | 3.6x | 4x | |
|---|---|---|---|---|---|
| T2*-IDEAL | 3.4% | - | - | - | - |
| ARC/T2*-IDEAL | - | 6.3% | 10.5% | 16.7% | 30.8% |
| Proposed Method | - | 3.7% | 4.1% | 4.2% | 4.4% |
DISCUSSION
The findings from this preliminary study demonstrate that the proposed parallel imaging and compressed sensing framework can accurately estimate liver fat fraction at acceleration factors that are higher than those achievable by ARC/T2*-IDEAL. Linear regression showed the accuracy of the fat fraction estimates from the proposed method at acceleration factors up to 4x. Further, the average standard deviation of the fat fraction estimates at each acceleration factor was within 1% (in absolute terms) of that using 1x T2*-IDEAL, which suggests relatively minor noise amplification. Despite these quantitative findings, a qualitative perspective reveals the presence of image artifacts, especially at 4x acceleration, that could degrade the confidence of the estimated fat fractions in prospective studies. Therefore, it would be premature to draw final conclusions about the acceleration potential of the proposed method until a further analysis is performed that uses a larger subject cohort and radiologists’ evaluations of image quality.
The signal model in Eq. 1 assumes that water and fat share a common R2* value, which is not true in general. This assumption is known to introduce bias into the fat fraction estimate. However at clinically-relevant values of SNR and fat fraction, the introduced bias is outweighed by an improvement in noise performance when compared to the dual-R2* model (25,26). Thus it has been suggested by Reeder et al. that the use of the single-R2* model is appropriate in this setting (26).
Our findings indicate that cubic B-splines provide a representation of the B0 field map that is sufficient enough for accurate fat fraction quantitation. The use of cubic B-splines imposes a parametric model on the B0 field map, which allows for the field map to be represented using fewer variables (i.e. B-spline coefficients) than the number of pixels. While this modeling is beneficial for estimating the B0 field map from undersampled measurements, it also prevents the field map estimate from assuming arbitrary values. Thus, it could have been the case that small errors in the B0 field map estimate caused significant errors in the fat fraction estimate.
A limitation of this study was that the undersampled k-space measurements were obtained by retrospectively downsampling the fully-sampled data rather than by truly acquiring them in an accelerated acquisition. Additional limitations of the present work include the need for a user defined regularization parameter and a relatively long reconstruction time of approximately 15 minutes per slice. It is worth noting that the same value of λ was used for all reconstructions, so it may be reasonable to fix this value for all future acquisitions that use similar parameters. However, for a more general approach, recent developments from Khare et al. (27) can be incorporated both to free the user from selecting any regularization parameters and to reduce the reconstruction time using iterative soft thresholding algorithms.
In conclusion, we have developed and demonstrated the feasibility of a joint parallel imaging and compressed sensing framework for liver fat quantitation. The proposed method accurately estimated liver fat fraction at acceleration factors that are higher than those achievable by a sequential parallel imaging and water-fat imaging method.
Acknowledgments
The authors thank Dr. Michael Lustig for making available his code to implement ARC.
Grant Support:
NIH R21DK081173 and K25DK087931
References
- 1.Hu HH, Bornert P, Hernando D, et al. ISMRM workshop on fat-water separation: insights, applications and progress in MRI. Magn Res Med. 2012;68:378–388. doi: 10.1002/mrm.24369. [DOI] [PMC free article] [PubMed] [Google Scholar]
- 2.Reeder SB, Hu HH, Sirlin CB. Proton density fat fraction: a standardized MR-based biomarker of tissue fat concentration. J Magn Res Imaging. doi: 10.1002/jmri.23741. [DOI] [PMC free article] [PubMed] [Google Scholar]
- 3.Janiec DJ, Jacobson ER, Freeth ER, Spaulding L, Blaszyk H. Histologic variation of grade and stage of non-alcoholic fatty liver disease in liver biopsies. Obes Surg. 2005;15:497–501. doi: 10.1381/0960892053723268. [DOI] [PubMed] [Google Scholar]
- 4.Ratziu V, Charlotte F, Heurtier A, et al. Sampling variability of liver biopsy in nonalcoholic fatty liver disease. Gastroenterology. 2005;128:1898–1906. doi: 10.1053/j.gastro.2005.03.084. [DOI] [PubMed] [Google Scholar]
- 5.Reeder SB, Sirlin CB. Quantification of liver fat with magnetic resonance imaging. Magn Res Imaging Clin N Am. 2010;18:337–357. doi: 10.1016/j.mric.2010.08.013. [DOI] [PMC free article] [PubMed] [Google Scholar]
- 6.Hu HH, Kim HW, Nayak KS, Goran MI. Comparison of fat-water MRI and single-voxel MRS in the assessment of hepatic and pancreatic fat fractions in humans. Obes. 2010;18:841–847. doi: 10.1038/oby.2009.352. [DOI] [PMC free article] [PubMed] [Google Scholar]
- 7.Hines CDG, Frydrychowicz A, Hamilton G, et al. T1 independent, T2* corrected chemical shift based fat-water separation with multi-peak fat spectral modeling is an accurate and precise measure of hepatic steatosis. J Magn Res Imaging. 2011;33:873–881. doi: 10.1002/jmri.22514. [DOI] [PMC free article] [PubMed] [Google Scholar]
- 8.Meisamy S, Hines CDG, Hamilton G, et al. Quantification of hepatic steatosis with T1-independent, T2*-corrected MR imaging with spectral modeling of fat: blinded comparison with MR spectroscopy. Radiology. 2011;258:767–775. doi: 10.1148/radiol.10100708. [DOI] [PMC free article] [PubMed] [Google Scholar]
- 9.Yu H, Shimakawa A, McKenzie CA, Brodsky E, Brittain JH, Reeder SB. Multiecho water-fat separation and simultaneous R2* estimation with multifrequency fat spectrum modeling. Magn Reson Med. 2008;60:1122–1134. doi: 10.1002/mrm.21737. [DOI] [PMC free article] [PubMed] [Google Scholar]
- 10.Liang ZP, Constable T, Haacke EM, Boada F, Smith M, Lauterbur PC. Constrained reconstruction methods in MR imaging. Rev Magn Reson Med. 1992;4:67–185. [Google Scholar]
- 11.Lustig M, Donoho D, Pauly JM. Sparse MRI: The application of compressed sensing for rapid MR imaging. Magn Reson Med. 2007;58:1182–1195. doi: 10.1002/mrm.21391. [DOI] [PubMed] [Google Scholar]
- 12.Doneva M, Bornert P, Eggers H, Mertins A, Pauly J, Lustig M. Compressed sensing for chemical shift-based water-fat separation. Magn Reson Med. 2010;64:1749–1759. doi: 10.1002/mrm.22563. [DOI] [PubMed] [Google Scholar]
- 13.Sharma SD, Hu HH, Nayak KS. Accelerated water-fat imaging using restricted subspace field map estimation and compressed sensing. Magn Reson Med. 2012;67:650–659. doi: 10.1002/mrm.23052. [DOI] [PMC free article] [PubMed] [Google Scholar]
- 14.Sharma SD, Hu HH, Nayak KS. Chemical shift encoded water-fat separation using parallel imaging and compressed sensing. Magn Reson Med. doi: 10.1002/mrm.24270. [DOI] [PMC free article] [PubMed] [Google Scholar]
- 15.Wiens CN, McCurdy C, McKenzie CA. A combined approach to compressed sensing and parallel imaging for fat water separation with R2* estimation. Proc Intl Soc Magn Reson Med. 2012;20:7. [Google Scholar]
- 16.George D, Goldwurm S, Macdonald GA, et al. Increased hepatic iron concentration in nonalcoholic steatohepatitis is associated with increased fibrosis. Gastroenterology. 1998;114:311–318. doi: 10.1016/s0016-5085(98)70482-2. [DOI] [PubMed] [Google Scholar]
- 17.Yu H, McKenzie CA, Shimakawa A, et al. Multiecho reconstruction for simultaneous water-fat decomposition and T2* estimation. J Magn Reson Imaging. 2007;26:1153–1161. doi: 10.1002/jmri.21090. [DOI] [PubMed] [Google Scholar]
- 18.Bydder M, Yokoo T, Hamilton G, Middleton MS, Chavez AD, Schwimmer JB, Lavine JE, Sirlin CB. Relaxation effects in the quantification of fat using gradient echo imaging. Magn Reson Imaging. 2008;26:347–359. doi: 10.1016/j.mri.2007.08.012. [DOI] [PMC free article] [PubMed] [Google Scholar]
- 19.Berglund J, Kullberg J. Three-dimensional water/fat separation and T2* estimation based on whole-image optimization-application in breathhold liver imaging at 1.5T. Magn Reson Med. 2012;67:1684–1693. doi: 10.1002/mrm.23185. [DOI] [PubMed] [Google Scholar]
- 20.Lustig M, Pauly JM. SPIRiT: Iterative self-consistent parallel imaging reconstruction from arbitrary k-space. Magn Reson Med. 2010;64:457–471. doi: 10.1002/mrm.22428. [DOI] [PMC free article] [PubMed] [Google Scholar]
- 21.Walsh DO, Gmitro AF, Marcellin MW. Adaptive reconstruction of phased array MR imagery. Magn Reson Med. 2000;43:682–690. doi: 10.1002/(sici)1522-2594(200005)43:5<682::aid-mrm10>3.0.co;2-g. [DOI] [PubMed] [Google Scholar]
- 22.Liu CY, McKenzie CA, Yu H, Brittain JH, Reeder SB. Fat quantification with IDEAL gradient echo imaging: correction of bias from T1 and noise. Magn Reson Med. 2007;58:354–364. doi: 10.1002/mrm.21301. [DOI] [PubMed] [Google Scholar]
- 23.Reeder SB, Pineda AR, Wen Z, Shimakawa A, Yu H, Brittain JH, Gold GE, Beaulieu CH, Pelc NJ. Iterative decomposition of water and fat with echo asymmetry and least-squares estimation (IDEAL): application with fast spin-echo imaging. Magn Reson Med. 2005;54:636–644. doi: 10.1002/mrm.20624. [DOI] [PubMed] [Google Scholar]
- 24.Brau AC, Beatty PJ, Skare S, Bammer R. Comparison of reconstruction accuracy and efficiency among autocalibrating data-driven parallel imaging methods. Magn Reson Med. 2008;59:382–395. doi: 10.1002/mrm.21481. [DOI] [PMC free article] [PubMed] [Google Scholar]
- 25.Hernando D, Liang ZP, Kellman P. Chemical shift-based water/fat separation: a comparison of signal models. Magn Reson Med. 2010;64:811–822. doi: 10.1002/mrm.22455. [DOI] [PMC free article] [PubMed] [Google Scholar]
- 26.Reeder SB, Bice EK, Yu H, Hernando D, Pineda AR. On the performance of T2* correction methods for quantification of hepatic fat content. Magn Reson Med. 2012;67:389–404. doi: 10.1002/mrm.23016. [DOI] [PMC free article] [PubMed] [Google Scholar]
- 27.Khare K, Hardy CJ, King KF, Turski PA, Marinelli L. Accelerated MR imaging using compressive sensing with no free parameters. Magn Reson Med. 2012 doi: 10.1002/mrm.24143. [DOI] [PubMed] [Google Scholar]


