

Abstract
Background
Disability and frailty are associated with osteoporosis, obesity, and sarcopenia. HIV-infected persons have early functional impairment, but the association between body composition and functional impairment is unknown.
Methods
HIV-1-infected participants on combination antiretroviral therapy with virologic suppression, aged 45–65 years, had standardized physical function measures. In a nested analysis, 30 low- and 48 high-functioning cases and controls were matched by age, gender, and time since HIV diagnosis. Bone mineral density, fat mass, and lean body mass (LBM) were assessed by dual-energy X-ray absorptiometry. Odds ratios (OR) with 95% confidence intervals were obtained from conditional logistic regression.
Results
Mean age was 53 years, mean CD4+ lymphocytes 598 cells/μL, and 96% had plasma HIV-1 RNA <50 copies/mL. Low- and high-function subjects had similar CD4+lymphocyte count and duration and type of antiretroviral therapy. Lower T-scores at the hip (OR 3.8 [1.1, 12.5]) and lumbar spine (OR 2.3 [1.1, 4.5]) and lower LBM (OR 1.1 [1.0, 1.2]) were associated with significantly greater odds of low function (p≤0.03). Lower insulin-like growth hormone (IGF-1: OR 5.0 [1.4, 20.0]) and IGF-1 binding protein 3 (OR 3.3 [1.7, 9.9]) increased the odds of low functional status (p≤0.02). Fat mass and lower 25-OH vitamin D did not increase the odds of low functional status (p>0.05).
Conclusions
Functional impairment in HIV-1-infected persons on successful antiretroviral therapy is associated with low muscle mass, low bone mineral density and low IGF-1 and IGFBP-3. These characteristics may be a manifestation of early “somatopause” in middle-aged HIV-infected adults.
INTRODUCTION
Persons with human immunodeficiency virus-1 (HIV-1) infection are thought to undergo premature or accelerated aging, accompanied by an early occurrence of many comorbidities of aging [1, 2]. One such manifestation of premature aging in HIV-1 infection may be the early occurrence of the “somatopause.” The somatopause is an age-associated reduction in hypothalamic secretion of growth hormone-releasing hormone (GHRH), resulting in decreased growth hormone (GH) synthesis and, subsequently, lower hepatic production of insulin like growth factor (IGF)-1, the key mediator of GH action on bone, muscle, fat, and multiple other tissues [3–5]. Among persons without HIV-1 infection, this normal process of aging corresponds to increased visceral and subcutaneous fat (obesity), loss of muscle mass and strength (sarcopenia), and a loss of bone mineral density (BMD, osteopenia). Obesity, sarcopenia, osteopenia, and decreased IGF-1 are independently, and synergistically, associated with disability and frailty among elderly persons [6–9]. Similarly, weight loss and muscle strength interventions lead to improved physical function and reduced frailty among aging persons [10].
Changes in body composition resulting from HIV-1 infection and complications of antiretroviral therapy (ART) mimic those of normal aging, with common findings of low lean body mass, accumulation of visceral adipose tissue, and loss of BMD [4, 11–13]. Impairments in physical function and frailty are notable even among middle-aged HIV-infected persons [14, 15], but little is known about the contributions of body composition changes to physical function and frailty in persons aging with HIV-1. If persons with HIV-1 infection truly undergo early somatopause, body composition changes could lead to premature functional impairment. The goal of the present study was to assess the relationships of body fat, muscle mass, and bone mineral density with functional capacity among middle-aged persons with HIV-1 infection.
METHODS
Study population
All individuals receiving care for HIV infection in the Infectious Diseases Group Practice Clinic at the University of Colorado Hospital were evaluated for potential participation. Individuals meeting the following criteria were eligible to participate: 1) 45 to 65 years of age; 2) able to consent and participate in study procedures; and 3) taking effective combination ART (two or more) for at least six months with one undetectable plasma HIV-1 RNA (<48 copies/mL) and no plasma HIV-1 RNA >200 copies/mL in the prior six months. Individuals taking oral corticosteroids within four weeks of the visit and individuals weighing more than 300 pounds (limit of the dual-energy X-ray absorptiometry (DXA) machine) were excluded. Approval was obtained from the Colorado Multiple Institutional Review Board and informed consent was obtained from all participants.
All enrolled study participants completed a standardized interview and available medical records were reviewed. Alcohol use was defined by self-reported history of current or prior abuse or currently consuming >7 drinks per week. Height and weight were measured and body mass index (BMI) calculated and categorized as obese (BMI ≥ 30 kg/m2), underweight (<18.5 kg/m2), or non-obese (BMI <30 and ≥18.5 kg/m2). Physical activity was assessed by two-week recall from the Minnesota Leisure-Time Physical Activity Questionnaire [16]. Lipoatrophy was defined as self-reported loss of facial or extremity fat and confirmed by clinical diagnosis. A fall was defined as unintentionally coming to rest on the ground or lower level, not as a result of a major intrinsic event or external hazard [17]. Cardiovascular disease included coronary artery, carotid artery, or peripheral vascular disease. Viral hepatitis was defined by a positive hepatitis B surface antigen or hepatitis C antibody. Chronic pain was defined as responding “moderately”, “quite a bit”, or “extremely” to the SF-36® question “During the past 4 weeks, how much did pain interfere with your normal work (including both work outside the home and housework)?”. FRAX scores were calculated under the assumption of a negative parent fracture history (data not collected)[18]. The Veterans Aging Cohort Study Index (VACS) was calculated using CD4 count, viral load, age, aspartate aminotransferase, alanine aminotransferase, platelets, hemoglobin, hepatitis C, and estimated glomerular filtration rate. Of a possible 164 points, higher values indicate greater mortality risk, and scores of ≤ 34 are associated with the lowest mortality [19].
Physical function was assessed using three evaluation tools: Fried’s frailty phenotype, the Short Physical Performance Battery (SPPB), and the 400-m walk. For Fried’s frailty phenotype, shrinking was defined as unintentional weight loss of ≥10 pounds or decrease of ≥5% of body weight in the last year (self-reported and verified by records when available) [20]. Exhaustion was defined by three to four times per week of feeling “everything I do is an effort” or “sometimes I just cannot get going.” Low activity was defined as self-report of being “limited a lot” in vigorous physical activities from the Short-Form (SF)-36 ® [21, 22]. Weakness was assessed by the average of three maximal dominant hand grip strength measurements using a single Lafayette dynamometer, applying previously defined gender and BMI cutoffs [20]. Slowness was defined by 4.5-m walk time adjusted for height: men ≤173 cm and women ≤159 cm in height requiring ≥7 seconds and taller men and women requiring ≥6 seconds [20]. One point was given for each of the frailty indicators above. The SPPB comprised the tandem stand, time to complete a 4-m walk at usual pace, and time to complete five sit-to-stand repetitions without use of the arms [23]. On each SPPB task, zero points indicated inability to complete, two or less was considered “difficulty,” and three or four points was performance within the expected range, with a maximum attainable score of 12 [24]. A 400-m walk time was measured in a designated corridor; participants were instructed to walk the distance as quickly as possible [25].
High-function was defined as the ability to complete the 400-m walk and no deficits on Fried’s frailty phenotype or the SPPB (score of 0 or 12, respectively). Low-function was defined as a score of ≥ 3 on Fried’s frailty phenotype or <9 on the SPPB, and at least one deficit on the opposing test. All low-function persons were matched to one or two high-function persons (for a goal of 80 subjects) by age ± 2 years, gender, and time since HIV infection (diagnosed prior to or after 1/1/1996) and all were asked to return for body composition measures and a blood draw. Two male-to-female transgendered subjects were enrolled (one low- and one high-function) and considered as female for subsequent analyses.
Body and bone composition
Body composition and bone mineral density were measured by DXA with a Hologic Discovery W instrument. Whole body lean mass was the bone-free, fat-free tissue mass. Appendicular skeletal muscle index (ASMI) was calculated as the sum of lean mass in the arms and legs, normalized to height (kg/m2). Low muscle mass was defined as ASMI <5.45 kg/m2 for women and <7.26 kg/m2 for men [26]. The fat index was calculated as fat mass normalized to height (kg/m2). High relative body fat was defined as greater than the gender-specific median of 33% for women and 23% for men. Fat mass ratio using the ratio of % trunk to % lower extremity fat mass was dichotomized using a cut-off of >1.961 for men and >1.329 for women, as previously described [27]. Low relative fat was defined as less than the gender-specific median for the cohort. Osteoporosis was defined by World Health Organization criteria as the lowest T-score at hip or spine of ≤−2.5 and osteopenia as T-score < −1 but > −2.5 [28].
Laboratory Measurements
Serum IGF-1 and IGFBP-3 were measured by enzyme-linked immunosorbent assays using the manufacturer protocol (Diagnostic Systems Laboratory, Webster, TX). Low IGF-1 and IGFBP-3 were defined as at or above the gender-specific median (130 and 3.3 for women and 110 ng/mL and 2.9 μg/mL, respectively, for men). Serum 25-(OH) vitamin D was measured by chemiluminescence (Diasorin Liaison, Stillwater, MN). Vitamin D deficiency was defined as ≤ 20 ng/mL, vitamin D insufficiency >20ng/mL but <30 ng/mL, and vitamin D sufficiency as ≥ 30 ng/mL [29]. Low vitamin D was defined as either vitamin D deficiency or insufficiency. Serum testosterone was measured by immunoassay (Beckman Coulter, Brea, CA). HIV-1 RNA, CD4+ lymphocyte count, albumin, and hemoglobin were the most recent values in the medical record.
Statistical Analysis
Data were collected and managed with Research Electronic Data Capture (REDCap) tools hosted at the University of Colorado [30]. Demographic characteristics were summarized with mean and standard error (SE) for continuous measures, with log-transformation and geometric mean and 95% confidence intervals (CI) reported for skewed measures, and frequency with percentage for categorical variables. Differences were tested using unequal variance two-sample t-test of chi-square test. Conditional Logistic Regression was used in the primary analysis of body composition in the case-control data, with odds ratios (OR) and 95% CI, and the p-value of the Wald Chi-square statistic reported. Each component was adjusted for two to four potential confounders as supported by the literature. Fat comparisons were adjusted for CD4+ lymphocyte count < 350 cells/μL, current protease inhibitor, any use of zidovudine, didanosine or stavudine [11, 31]. Lean body mass was adjusted for CD4+ lymphocyte count < 350 cells/μL and any use of zidovudine, didanosine or stavudine [31, 32]. Bone mineral density (BMD) and t-scores were adjusted for nadir CD4+ lymphocyte count, BMI, current tenofovir and tobacco use [33]; FRAX estimates were adjusted for nadir CD4+ lymphocyte count and current tenofovir. IGF-1, IGFBP-3 and 25-OH vitamin D were adjusted for CD4+ lymphocyte count < 350 cells/μL, fat mass ratio, and BMI [4]. Logistic regression was used to assess the associations of age, race, ethnicity, current or prior ART class, hepatitis B and/or C, current tobacco or alcohol use, use of a statin, BMI, and lipoatrophy with relative fat, low muscle mass, osteopenia/ osteoporosis, low IGF-1 and IGFBP-3, and vitamin D insufficiency/deficiency across the entire cohort. The entire cohort comparisons were adjusted for functional status, age (except for the age comparison), gender, and time since HIV diagnosis. Analyses were performed in SAS v9.2 (SAS Institute Inc., Cary, NC). No adjustments were made for multiple comparisons..
RESULTS
Study population
Between February and November 2010, 542 patients with HIV-1 infection seen in the Infectious Disease Group Practice Clinic fulfilled the inclusion criteria and were asked to participate. Of these, 369 consented to study participation and 359 completed the study assessment. 33 (9%) were identified as low-, 186 (52%) as moderate-, and 140 (39%) as high-function (Table 1). 30 low-function persons returned for additional evaluation and were matched by age, gender, and time since HIV diagnosis to 48 high-function controls. Groups were similar by baseline demographic and clinical characteristics with the exception of more smokers, less physical function and lower CD4+ lymphocyte nadir in the low-function group (Table 2). Among the biological women, all had reached menopause. Low-function women had a significantly longer time since menopause (12.66 ± 2.0 versus 5.39 ± 1.96 years, p=0.008). Two low-function subjects had prior bilateral hip replacements and one high-function subject had a lumbar fusion. BMD data for the respective locations were excluded for those three subjects. No subjects were taking corticosteroids.
Table 1.
Demographic and clinical characteristics of overall cohort and functional groups.
| Characteristic | Overall Cohort | Low function | Intermediate | High function |
|---|---|---|---|---|
| N=359 (%) | N=33 (%) | N=186 (%) | N=140 (%) | |
| Demographics | ||||
| Age, years | 52.1 (0.3) | 52.9 (0.8) | 52.2 (0.4) | 51.7 (0.5) |
| Female | 54 (15) | 8 (24) | 27 (15) | 19 (14) |
| Hispanic/Latino | 65 (18) | 7 (21) | 37 (20) | 21 (15) |
| Non-white | 94 (26) | 8 (24) | 48 (26) | 38 (27) |
| Current smoker | 123 (34) | 17 (52) | 71 (38) | 35 (25) |
| HIV Characteristics | ||||
| Current CD4+ T-cells/μL | 600 (16) | 579 (55) | 578 (22) | 634 (25) |
| Detectable HIV-1 RNA (≥ 48 copies/mL) | 18 (5) | 1 (3) | 8 (4) | 9 (6) |
| Comorbidities | ||||
| Diabetes | 37 (11) | 7 (21) | 23 (13) | 7 (5) |
| Hypertension | 148 (41) | 18 (55) | 81 (44) | 49 (35) |
| Cardiovascular disease | 34 (9) | 4 (12) | 24 (13) | 6 (4) |
| Chronic pain | 129 (37) | 22 (71) | 95 (52) | 12 (9) |
| Hepatitis B or C* | 89 (25) | 15 (45) | 47 (25) | 27 (19) |
| VACS Index Score | 10.7 (0.6) | 25.1 (2.9) | 9.9 (0.8) | 8.4 (0.8) |
| Number of Non-ART Medications | 4.7 (0.2) | 6.4 (0.6) | 5.2 (0.2) | 3.5 (0.2) |
| Clinical Outcomes | ||||
| Any hospitalization during prior 12 months | 77 (22) | 17 (52) | 40 (22) | 20 (14) |
| Fall† during prior 12 months | 109 (30) | 24 (73) | 66 (35) | 19 (14) |
Values are presented as frequency (percentage) or mean (standard error). Abbreviations: SE, standard error; VACS, Veterans Aging Cohort Study
positive hepatitis B virus surface antigen and/or positive hepatitis C virus antibody,
Fall was defined as unintentionally coming to rest on the ground or other lower level, not as a result of a major intrinsic event or external hazard
Table 2.
Demographic and clinical characteristics between 78 low and high-functioning subjects.
| Characteristic | Low function | High function | P value |
|---|---|---|---|
| N=30 (%) | N=48 (%) | ||
| Age, years | 53.1 (0.8) | 52.8 (0.8) | 0.98 |
| Women | 7 (23) | 9 (19) | -- |
| White | 23 (77) | 37 (77) | 1 |
| Hispanic/Latino | 7 (23) | 6 (13) | 0.35 |
| Current smoker | 15 (50) | 10 (21) | 0.012 |
| Alcohol use* | 7 (23) | 8 (17) | 0.56 |
| Prior IVDU | 6 (20) | 9 (19) | 1 |
| Lipoatrophy | 7 (23) | 8 (17) | 0.56 |
| Hx stress fracture | 4 (13) | 2 (4) | 0.20 |
| Current CD4+ T-cell count (cells/μL) | 551 (50) | 628 (40) | 0.20 |
| Years since HIV diagnosis | 15.3 (1.4) | 15.6 (1.4) | 0.73 |
| Less than 2 years of ART | 8 (27) | 6 (13) | 0.14 |
| Nadir CD4+ T-cell count (cells/μL) | 106 (28) | 179 (23) | 0.028 |
| Physical Activity Level <500 Kcal/week | 19 (63) | 7(15) | <0.001 |
| Comorbidities | |||
| Diabetes | 6 (20) | 5 (11) | 0.32 |
| Hypertension | 15 (50) | 20 (42) | 0.49 |
| Cardiovascular disease | 2 (7) | 4 (8) | 1.0 |
| Chronic pain | 19 (68) | 4 (8) | <0.001 |
| Hepatitis B or C† | 14 (47) | 12 (26) | 0.083 |
| VACS Index Score | 26.3 (3.3) | 14.0 (1.3) | 0.001 |
| Medications | |||
| Tenofovir (any) | 24 (80) | 41 (85) | 0.76 |
| Protease inhibitor (any) | 24 (80) | 32 (67) | 0.30 |
| Testosterone | 3 (10) | 6 (13) | 1 |
| Estrogen | 1 (3) | 4 (8) | 0.64 |
| Vitamin D | 9 (30) | 10 (21) | 0.42 |
| Bisphosphonate | 2 (7) | 1 (2) | 0.56 |
Values are presented as frequency (percentage) or mean (standard error), p-value from chi-square or unequal variance T-test.
IVDU, intravenous drug use; ART, antiretroviral therapy; VACS, Veterans Aging Cohort Study
Self-reported history of current or prior abuse, or currently consuming >7 drinks per week,
positive hepatitis B virus surface antigen and/or positive hepatitis C virus antibody
Association of Fat with Physical Function
Six low-function (20%) and 6 high-function (13%) subjects were obese based on BMI, and 4 low-function (13%) but no high-function subjects were underweight. BMI was not significantly different between low-function (geometric mean 25.5 kg/m2, 95% CI 24.0–27.1 kg/m2) and high-function groups (24.2 kg/m2, 95% CI 22.4–26.0 kg/m2, p=0.25). Relative body fat was slightly higher among low-function (28.2 ± 1.6%) than high-function persons (25.0 ± 1.4%), but this was not significant after adjusting for CD4, current protease inhibitor use, or any use of zidovudine, didanosine or stavudine (p=0.14). Fat mass, fat index, fat distribution, and the fat mass ratio were not associated with greater odds of being low function (Table 3). In general and as expected, women had higher median percentage of body fat than men (33% versus 23%). When considering all subjects and adjusting for functional status, age, gender, and time since HIV diagnosis, demographics, smoking or alcohol use, or class of ART were not significantly associated with increased odds of higher relative body fat (all p ≥ 0.11).
Table 3.
Fat, muscle, bone, and hormone differences between functional groups.
| Low Function (N=30) | High function (N=48) | Crude OR | P value | Adjusted* OR | P value | |
|---|---|---|---|---|---|---|
| ↑Fat | ||||||
| Relative fat mass (% body mass) | 28.1 ± 1.6 | 24.7 ± 1.4 | 1.0 (0.9. 1.0) | 0.14 | 0.9 (0.8, 1.0) | 0.18 |
| Fat mass (kg) | 21.2 ± 2.0 | 18.3 ± 1.6 | 1.0 (0.9, 1.0) | 0.46 | 1.0 (0.9, 1.0) | 0.54 |
| Trunk: limb fat | 1.9 ± 0.2 | 2.1 ± 0.2 | 0.8 (0.5, 1.4) | 0.47 | 0.9 (0.5, 1.6) | 0.74 |
| Trunk: total fat† | 0.6 ± 0.02 | 0.6 ± 0.02 | 0.8 (0.4, 1.3) | 0.36 | 0.9 (0.5, 1.7) | 0.69 |
| Fat Index (kg/m2) | 7.0 ± 0.7 | 6.2 ± 0.6 | 1.0 (0.9, 1.1) | 0.55 | 1.0 (0.9, 1.1) | 0.68 |
| %Trunk fat/% leg fat | 1.9 ± 0.2 | 2.1 ± 0.2 | 0.8 (0.5, 1.4) | 0.47 | 0.9 (0.5, 1.6) | 0.74 |
| ↓Muscle | ||||||
| Lean body mass (kg) | 46.9 ± 1.7 | 51.6 ± 1.5 | 1.1 (1.0, 1.2) | 0.023 | 1.1 (1.0, 1.2) | 0.034 |
| Appendicular lean mass (kg) | 20.6 ± 0.9 | 23.7 ± 0.7 | 1.3 (1.0, 1.4) | 0.012 | 1.2 (1.1, 1.4) | 0.017 |
| ASMI (kg/m2) | 6.8 ± 0.2 | 7.8 ± 0.2 | 1.7 (1.1, 2.9) | 0.012 | 1.8 (1.1, 2.9) | 0.014 |
| ↓Bone | ||||||
| Lumbar spine BMD (g/m2)† | 0.917 ± 0.026 | 1.007 ± 0.021 | 1.7 (1.1, 2.3) | 0.023 | 2.1 (1.1, 4.0) | 0.023 |
| Lumbar spine T-score | −1.5 ± 0.2 | −0.7 ± 0.2 | 1.7 (1.1, 2.3) | 0.023 | 2.3 (1.1, 4.5) | 0.022 |
| Femoral neck BMD (g/m2)† | 0.703 ± 0.021 | 0.758 ± 0.016 | 1.7 (1.0, 2.6) | 0.051 | 2.0 (0.9, 4.3) | 0.075 |
| Femoral neck T-score | −1.6 ± 0.2 | −1.2 ± 0.1 | 2.0 (0.98, 3.3) | 0.057 | 2.3 (0.9, 6.3) | 0.093 |
| Total hip BMD (g/m2)† | 0.812 ± 0.023 | 0.908 ± 0.019 | 2.0 (1.2, 3.3) | 0.009 | 2.4 (1.1, 5.6) | 0.032 |
| Total hip T-score | −1.4 ± 0.2 | −0.7 ± 0.1 | 2.5 (1.3, 5.9) | 0.009 | 3.8 (1.1, 12.5) | 0.028 |
| ↓Hormone | ||||||
| IGF-1 (ng/mL)‡ | 99.0 ± 8.2 | 126.7 ± 6.6 | 5.0 (1.4, 20.0) | 0.015 | 5.0 (1.4, 20.0) | 0.015 |
| IGFBP-3 (μg/mL) | 2.5 ± 0.2 | 3.5 ± 0.2 | 3.3 (1.6, 6.3) | 0.001 | 3.3 (1.7, 9.9) | 0.002 |
| 25-OH vitamin D(ng/mL) | 25.4 ± 2.3 | 29.5 ± 1.9 | 1.0 (0.99, 1.1) | 0.11 | 1.0 (0.99, 1.1) | 0.11 |
Values are presented as mean ± standard error. ASMI, appendicular skeletal muscle index. BMD, bone mineral density. IGF, insulin-like growth factor. IGFBP-insulin-like growth factor binding protein. Odds Ratio is for the incremental increase in odds of Low Function for an increase (↑) or decrease (↓) of one unit, unless otherwise indicated.
Adjusted for potential confounders:
Fat mass: CD4+ lymphocyte count < 350 cells/μL, current protease inhibitor, any use of zidovudine, didanosine or stavudine.
Lean mass: CD4+ lymphocyte count < 350 cells/μL and any use of zidovudine, didanosine or stavudine.
BMD: nadir CD4+ lymphocyte count, BMI (kg/m2), current tenofovir use, and tobacco use.
Hormone: CD4+ lymphocyte count < 350 cells/μL, fat mass ratio, and BMI (kg/m2),.
Odds per change of 0.1 units
Odds per change of 100 units
Association of Muscle with Physical Function
Total lean body mass, appendicular lean mass, and ASMI were lower (all p < 0.05) among low-function subjects compared to high-function controls (Table 3). Using ASMI cut-points [26], 27 (35%) of all subjects met criteria for low muscle mass and 15 (50%) of the low-function subjects were classified as sarcopenic. We found a greater odds of low muscle mass among subjects with low-function (OR 2.5, 95% CI 1.0, 6.1, p=0.04). When considering all subjects and adjusting for functional status, age, gender, and time since HIV diagnosis, lower BMI (OR 1.7, 95% CI 1.2, 2.2, p<0.001), but not demographics, smoking or alcohol use, or ART class, were associated with increased odds of low muscle mass (all p ≥ 0.11). Serum albumin (OR 0.8, 95% CI 0.2, 2.6, p=0.68), hemoglobin (OR 0.96, 95% CI 0.7, 1.3, p=0.81), and testosterone (OR 1.0, 95% CI 0.9, 1.1, p=0.95) were not associated with an increased odds of low muscle mass.
Association of Bone with Physical Function
Overall, 11 subjects (14%) had osteoporosis at the lumbar spine and 3 subjects (4%) had osteoporosis at the hip. Osteopenia or osteoporosis was more common among low-function subjects: 20 low-function (67%) had osteopenia or osteoporosis at the lumbar spine compared to 18 (38%) in the high-function group (p=0.02); 19 low-function persons (68%) had osteopenia or osteoporosis at the hip compared to 16 (33%) in the high-function group (p=0.01). Low BMD and T-scores at both the hip and lumbar spine were associated with greater odds of being low-function. The predictive values of low BMD and T-score at the lumbar spine and total hip were robust to adjustments for BMI, nadir CD4+ T-cell count, current tenofovir use and smoking status (Table 3). By the FRAX tool, each 1% increase in the 10-year probability of a major osteoporotic fracture of a hip fracture was associated with a non-significant 1.2 (95% CI 0.9, 1.5; p=0.11) and 1.9 (95% CI 0.9, 4.4; p=0.25) greater odds, respectively, of low-function. When considering factors related to osteopenia/osteoporosis among all subjects and adjusting for functional status, age, gender, and time since HIV diagnosis, white race (OR 6.0, 95% CI 1.4–26.0, p=0.02) was associated with greater odds of osteopenia or osteoporosis. A trend towards greater odds of osteopenia or osteoporosis was seen with incrementally higher age (OR 1.1, 95% CI 0.99, 1.3, p=0.08). An incremental decrease in BMI was associated with an increased odds of osteopenia or osteoporosis (OR 1.3, 95% CI 1.1, 1.5, p=0.002). No significant associations were detected with ethnicity, tobacco or alcohol use, or class of ART (all p ≥ 0.25).
Association of Hormonal Alteration with Physical Function
Lower IGF-1 and IGFBP-3 were associated with significantly greater odds of being low-function (Table 3). Among all subjects and adjusting for functional status, age, gender, and duration of HIV diagnosis, hepatitis B or C was associated with greater odds of having low IGF-1 or IGFBP-3 (OR 3.5, 95% CI 1.2, 10.2, p=0.03; OR 6.6; 95% CI 2.0, 22.0, p=0.002) and alcohol use was associated with greater odds of low IGFBP-3 (OR 15.7, 95% CI 2.8, 88.5, p=0.002).
Nine (30%) low-function and 13 (27%) high-function subjects were found to have vitamin D deficiency; 13 (43%) low-function and 12 (25%) high-function subjects had vitamin D insufficiency. Serum 25-OH vitamin D was not a significant predictor of functional group (Table 3; p=0.11). Among all subjects and adjusting for functional status, age, gender, and duration of HIV diagnosis, no significant associations were seen with demographic characteristics, ART class, or BMI (all p ≥ 0.24).
DISCUSSION
The roles of adiposity, sarcopenia, and osteopenia/osteoporosis in functional impairment and frailty are well-described among multiple elderly cohorts [7, 8, 10]. Little is known, however, about the relationships of these normal aging processes to physical function in HIV-infected persons, who are at increased risk for premature body and bone composition changes due to HIV-1, ART and/or chronic inflammation [2, 11, 13, 33]. In the current study, we provided the first quantitative comparison of fat, muscle, and bone in HIV-infected persons with low-or high-function.
The frequency of low muscle mass was particularly surprising given the relatively young age (mean 52 years) of the cohort, and similar to what is commonly reported among persons 10 to 25 years older than the participants in our study [34, 35]. The implications of this finding are concerning because low muscle mass and sarcopenia are associated with functional dependence and increased mortality among both HIV-infected and HIV-uninfected adults [12, 26, 36].
BMD and T-scores in our entire middle-aged HIV-infected population, and the low-function cohort in particular, were also similar to those of older persons without HIV infection [13, 37, 38]. A decrease in BMD of 1-standard deviation among older women is associated with a 37–49% increased risk of fracture [39]. The difference between groups in our cohort was slightly less, but nonetheless indicates a significant increase in fracture risk among low-function persons. Functional impairment is a consistently strong predictor of increased fall risk in HIV-infected and -uninfected elderly [40–42]. The combination of increased fall risk and lower BMD highlights the importance of evaluating, monitoring, and modifying risks for both falls and bone fragility to prevent fractures among persons aging with HIV [40, 43]. In addition, persons with impaired physical function are less likely to engage in regular physical activity, and a resultant decline in muscle mass from physical inactivity may amplify the decline in BMD with age (Figure 1). Although low-function subjects had a slightly greater frequency of vitamin D deficiency or insufficiency compared to high-function subjects, we were unable to detect significant differences in serum vitamin D concentrations, possibly due to the fact that nearly 30% of low-function subjects were receiving vitamin D replacement therapy.
Figure 1.
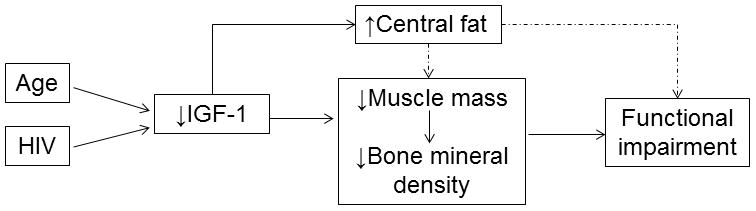
Proposed relationship between body and bone composition and the development of functional impairment in persons aging with HIV infection. Both age and HIV-1 contribute to low insulin-like growth factor (IGF)-1. Low IGF-1 is associated with central adiposity, low muscle mass, and low bone mineral density, all of which contribute to functional impairment.
Low functional status was associated with low serum IGF-1 and IGFBP-3 concentrations in our cohort. Indeed, levels of IGF-1 in our low-function group (99 ± 8 ng/mL) were comparable to those reported in healthy men 70–80 years of age (125 ± standard deviation of 48 ng/mL) [44] and frail women 70–79 years of age (104 ± standard deviation of 2 ng/mL) [45]. An age-related decline in the GH/IGF-1-axis has been well described [46, 47], but the unexpectedly low levels of IGF-1 in our cohort, even after adjusting for potential confounders, may represent early somatopause as a manifestation of premature aging in HIV-1 infection. Whether low IGF-1 in our physically impaired group is due to an age-related decrease in GHRH, impaired pituitary release of GH, impaired IGF-1 production, or related to hypothalamic infiltration of HIV or side effects of ART is not known [50, 51].
In our cohort, BMI and measures of fat were not significantly different between low- and high-functioning groups. This finding contrasts to findings from a cohort of “frail” (defined by at least two deficits in Physical Performance Test, peak oxygen uptake, activities of daily living, or instrumental activities of daily living), HIV-infected subjects in the Rochester, New York area that demonstrated higher BMI, waist circumference, fat mass, and trunk fat than HIV-infected, non-frail controls [52]. The discordance between studies may reflect the lower prevalence of obesity in Colorado compared to New York. In county-specific data collected by the Centers for Disease Control, 30.3% of adults in Monroe County, New York are obese compared to less than 20% of adults in counties of the Denver metropolitan area [53]. Indeed, the average BMI of our cohort was 25 kg/m2 compared to 29 kg/m2 in the Rochester cohort [52].
Our study had several limitations. First, we did not include an HIV-uninfected cohort. We used trunk fat as a measure of central adiposity, but did not include visceral fat. Visceral fat accumulates with ART [54], is more pro-inflammatory and insulin-resistant than subcutaneous fat [55], and, thus, could contribute to low lean mass and osteopenia. The relatively low BMI in our cohort may make our results less applicable to more obese patient populations in the United States. Additionally, our cohort was intentionally limited to HIV-infected persons on successful ART. This focus allowed us to study the relationship of body composition and physical function in persons aging during successful HIV-1 treatment as opposed to persons with complications of untreated HIV-1 infection. Body composition can vary considerably by age, genetics, and gender. We attempted to reduce potential confounding by these factors by matching our low- and high-function cases by age and gender. Lastly, we demonstrated an association between physical function, body composition and somatotropic hormones at a single time point. This cross-sectional design precludes conclusions regarding the direction and causality of the relationship of functional capacity to body composition.
Our findings indicate that functional impairment in middle-aged adults with HIV-1 infection is associated with low muscle mass, bone mineral density, IGF-1, and IGFBP-3. These characteristics may be a manifestation of early “somatopause” in middle-aged HIV-infected adults (pathway postulated in Figure 1) [6–9, 56, 57]. Longitudinal studies are needed to elucidate the complex interactions among bone, muscle, fat, GH/IGF-1, and physical function in HIV-infected adults during ART. Further studies should investigate the impact of interventions to increase bone, muscle, or IGF-1 on functional capacity among persons aging with HIV-infection.
Acknowledgments
Funding: This work was supported by the National Institutes of Health [5UL1TR000154, P30 DK048520, and T32 AI007447-1]; the Hartford Foundation Center of Excellence in Geriatric Medicine; and GlaxoSmithKline HIV Collaborative Investigator Research Award. Contents are the authors’ sole responsibility and do not necessarily represent official NIH views.
Footnotes
Conflict of Interest: The authors declare no conflicts of interest.
References
- 1.Deeks SG. Immune dysfunction, inflammation, and accelerated aging in patients on antiretroviral therapy. Top HIV Med. 2009;17:118–23. [PubMed] [Google Scholar]
- 2.Effros RB, Fletcher CV, Gebo K, et al. Aging and infectious diseases: workshop on HIV infection and aging: what is known and future research directions. Clin Infect Dis. 2008;47:542–53. doi: 10.1086/590150. [DOI] [PMC free article] [PubMed] [Google Scholar]
- 3.Rochira V, Zirilli L, Orlando G, et al. Premature Decline of Serum Total Testosterone in HIV-Infected Men in the HAART-Era. PLoS One. 2011;6:e28512. doi: 10.1371/journal.pone.0028512. [DOI] [PMC free article] [PubMed] [Google Scholar]
- 4.Falutz J. Growth hormone and HIV infection: contribution to disease manifestations and clinical implications. Best practice & research. Clinical endocrinology & metabolism. 2011;25:517–29. doi: 10.1016/j.beem.2010.11.001. [DOI] [PubMed] [Google Scholar]
- 5.Bartke A. Growth hormone andaging: a challenging controversy. Clin Interv Aging. 2008;3:659–65. doi: 10.2147/cia.s3697. [DOI] [PMC free article] [PubMed] [Google Scholar]
- 6.Frisoli A, Jr, Chaves PH, Ingham SJ, Fried LP. Severe osteopenia and osteoporosis, sarcopenia, and frailty status in community-dwelling older women: results from the Women’s Health and Aging Study (WHAS) II. Bone. 2011;48:952–7. doi: 10.1016/j.bone.2010.12.025. [DOI] [PubMed] [Google Scholar]
- 7.Jankowski CM, Gozansky WS, Van Pelt RE, et al. Relative contributions of adiposity and muscularity to physical function in community-dwelling older adults. Obesity (Silver Spring) 2008;16:1039–44. doi: 10.1038/oby.2007.84. [DOI] [PMC free article] [PubMed] [Google Scholar]
- 8.Lindsey C, Brownbill RA, Bohannon RA, Ilich JZ. Association of physical performance measures with bone mineral density in postmenopausal women. Arch Phys Med Rehabil. 2005;86:1102–7. doi: 10.1016/j.apmr.2004.09.028. [DOI] [PubMed] [Google Scholar]
- 9.Leng SX, Cappola AR, Andersen RE, et al. Serum levels of insulin-like growth factor-I (IGF-I) and dehydroepiandrosterone sulfate (DHEA-S), and their relationships with serum interleukin-6, in the geriatric syndrome of frailty. Aging Clin Exp Res. 2004;16:153–7. doi: 10.1007/BF03324545. [DOI] [PubMed] [Google Scholar]
- 10.Villareal DT, Chode S, Parimi N, et al. Weight loss, exercise, or both and physical function in obese older adults. N Engl J Med. 2011;364:1218–29. doi: 10.1056/NEJMoa1008234. [DOI] [PMC free article] [PubMed] [Google Scholar]
- 11.Kosmiski L, Kuritzkes D, Hamilton J, et al. Fat distribution is altered in HIV-infected men without clinical evidence of the HIV lipodystrophy syndrome. HIV Med. 2003;4:235–40. doi: 10.1046/j.1468-1293.2003.00151.x. [DOI] [PubMed] [Google Scholar]
- 12.Scherzer R, Heymsfield SB, Lee D, et al. Decreased limb muscle and increased central adiposity are associated with 5-year all-cause mortality in HIV infection. Aids. 2011;25:1405–14. doi: 10.1097/QAD.0b013e32834884e6. [DOI] [PMC free article] [PubMed] [Google Scholar]
- 13.Yin MT, Zhang CA, McMahon DJ, et al. Higher rates of bone loss in postmenopausal HIV-infected women: a longitudinal study. J Clin Endocrinol Metab. 2012;97:554–62. doi: 10.1210/jc.2011-2197. [DOI] [PMC free article] [PubMed] [Google Scholar]
- 14.Richert L, Dehail P, Mercie P, et al. High frequency of poor locomotor performance in HIV-infected patients. Aids. 2011;25:797–805. doi: 10.1097/QAD.0b013e3283455dff. [DOI] [PubMed] [Google Scholar]
- 15.Oursler KK, Sorkin JD, Smith BA, Katzel LI. Reduced aerobic capacity and physical functioning in older HIV-infected men. AIDS Res Hum Retroviruses. 2006;22:1113–21. doi: 10.1089/aid.2006.22.1113. [DOI] [PubMed] [Google Scholar]
- 16.Richardson MT, Leon AS, Jacobs DR, Jr, Ainsworth BE, Serfass R. Comprehensive evaluation of the Minnesota Leisure Time Physical Activity Questionnaire. J Clin Epidemiol. 1994;47:271–81. doi: 10.1016/0895-4356(94)90008-6. [DOI] [PubMed] [Google Scholar]
- 17.The prevention of falls in later life. A report of the Kellogg International Work Group on the Prevention of Falls by the Elderly. Danish medical bulletin. 1987;34 (Suppl 4):1–24. [PubMed] [Google Scholar]
- 18.FRAX WHO Fracture Risk Assessment Tool. World Health Organization Collaborating Centre for Metabolic Bone Diseases. University of Sheffield; UK: [Accessed 1/3/2013]. Available at: http://www.shef.ac.uk/FRAX/index.aspx?lang=En. [Google Scholar]
- 19.Justice A, Modur S, Tate J, et al. Predictive Accuracy of the Veterans Aging Cohort Study (VACS) Index for Mortality with HIV Infection: A North American Cross Cohort Analysis. J Acquir Immune Defic Syndr. 2012 doi: 10.1097/QAI.0b013e31827df36c. [DOI] [PMC free article] [PubMed] [Google Scholar]
- 20.Fried LP, Tangen CM, Walston J, et al. Frailty in older adults: evidence for a phenotype. J Gerontol A Biol Sci Med Sci. 2001;56:M146–56. doi: 10.1093/gerona/56.3.m146. [DOI] [PubMed] [Google Scholar]
- 21.Desquilbet L, Jacobson LP, Fried LP, et al. HIV-1 infection is associated with an earlier occurrence of a phenotype related to frailty. J Gerontol A Biol Sci Med Sci. 2007;62:1279–86. doi: 10.1093/gerona/62.11.1279. [DOI] [PubMed] [Google Scholar]
- 22.Onen NF, Agbebi A, Shacham E, et al. Frailty among HIV-infected persons in an urban outpatient care setting. J Infect. 2009;59:346–52. doi: 10.1016/j.jinf.2009.08.008. [DOI] [PubMed] [Google Scholar]
- 23.Guralnik JM, Simonsick EM, Ferrucci L, et al. A short physical performance battery assessing lower extremity function: association with self-reported disability and prediction of mortality and nursing home admission. J Gerontol. 1994;49:M85–94. doi: 10.1093/geronj/49.2.m85. [DOI] [PubMed] [Google Scholar]
- 24.Rejeski WJ, Fielding RA, Blair SN, et al. The lifestyle interventions and independence for elders (LIFE) pilot study: design and methods. Contemporary clinical trials. 2005;26:141–54. doi: 10.1016/j.cct.2004.12.005. [DOI] [PubMed] [Google Scholar]
- 25.Simonsick EM, Montgomery PS, Newman AB, Bauer DC, Harris T. Measuring fitness in healthy older adults: the Health ABC Long Distance Corridor Walk. J Am Geriatr Soc. 2001;49:1544–8. doi: 10.1046/j.1532-5415.2001.4911247.x. [DOI] [PubMed] [Google Scholar]
- 26.Baumgartner RN, Koehler KM, Gallagher D, et al. Epidemiology of sarcopenia among the elderly in New Mexico. Am J Epidemiol. 1998;147:755–63. doi: 10.1093/oxfordjournals.aje.a009520. [DOI] [PubMed] [Google Scholar]
- 27.Freitas P, Santos AC, Carvalho D, et al. Fat mass ratio: an objective tool to define lipodystrophy in hiv-infected patients under antiretroviral therapy. Journal of clinical densitometry : the official journal of the International Society for Clinical Densitometry. 2010;13:197–203. doi: 10.1016/j.jocd.2010.01.005. [DOI] [PubMed] [Google Scholar]
- 28.Assessment of fracture risk and its application to screening for postmenopausal osteoporosis. Report of a WHO Study Group. World Health Organization technical report series. 1994;843:1–129. [PubMed] [Google Scholar]
- 29.Holick MF. Vitamin D deficiency. N Engl J Med. 2007;357:266–81. doi: 10.1056/NEJMra070553. [DOI] [PubMed] [Google Scholar]
- 30.Harris PA, Taylor R, Thielke R, et al. Research electronic data capture (REDCap)--a metadata-driven methodology and workflow process for providing translational research informatics support. Journal of biomedical informatics. 2009;42:377–81. doi: 10.1016/j.jbi.2008.08.010. [DOI] [PMC free article] [PubMed] [Google Scholar]
- 31.McDermott AY, Terrin N, Wanke C, et al. CD4+ cell count, viral load, and highly active antiretroviral therapy use are independent predictors of body composition alterations in HIV-infected adults: a longitudinal study. Clin Infect Dis. 2005;41:1662–70. doi: 10.1086/498022. [DOI] [PubMed] [Google Scholar]
- 32.Yarasheski KE, Scherzer R, Kotler DP, et al. Age-related skeletal muscle decline is similar in HIV-infected and uninfected individuals. J Gerontol A Biol Sci Med Sci. 2011;66:332–40. doi: 10.1093/gerona/glq228. [DOI] [PMC free article] [PubMed] [Google Scholar]
- 33.Cazanave C, Dupon M, Lavignolle-Aurillac V, et al. Reduced bone mineral density in HIV-infected patients: prevalence and associated factors. Aids. 2008;22:395–402. doi: 10.1097/QAD.0b013e3282f423dd. [DOI] [PubMed] [Google Scholar]
- 34.Morley JE. Sarcopenia: diagnosis and treatment. J Nutr Health Aging. 2008;12:452–6. doi: 10.1007/BF02982705. [DOI] [PubMed] [Google Scholar]
- 35.Delmonico MJ, Harris TB, Lee JS, et al. Alternative definitions of sarcopenia, lower extremity performance, and functional impairment with aging in older men and women. J Am Geriatr Soc. 2007;55:769–74. doi: 10.1111/j.1532-5415.2007.01140.x. [DOI] [PubMed] [Google Scholar]
- 36.Visser M, Schaap LA. Consequences of sarcopenia. Clinics in geriatric medicine. 2011;27:387–99. doi: 10.1016/j.cger.2011.03.006. [DOI] [PubMed] [Google Scholar]
- 37.Arnsten JH, Freeman R, Howard AA, et al. HIV infection and bone mineral density in middle-aged women. Clin Infect Dis. 2006;42:1014–20. doi: 10.1086/501015. [DOI] [PubMed] [Google Scholar]
- 38.Arnsten JH, Freeman R, Howard AA, et al. Decreased bone mineral density and increased fracture risk in aging men with or at risk for HIV infection. Aids. 2007;21:617–23. doi: 10.1097/QAD.0b013e3280148c05. [DOI] [PMC free article] [PubMed] [Google Scholar]
- 39.Cauley JA, Lui LY, Ensrud KE, et al. Bone mineral density and the risk of incident nonspinal fractures in black and white women. Jama. 2005;293:2102–8. doi: 10.1001/jama.293.17.2102. [DOI] [PubMed] [Google Scholar]
- 40.Delbaere K, Close JC, Heim J, et al. A multifactorial approach to understanding fall risk in older people. J Am Geriatr Soc. 2010;58:1679–85. doi: 10.1111/j.1532-5415.2010.03017.x. [DOI] [PubMed] [Google Scholar]
- 41.Hauer K, Yardley L, Beyer N, et al. Validation of the Falls Efficacy Scale and Falls Efficacy Scale International in geriatric patients with and without cognitive impairment: results of self-report and interview-based questionnaires. Gerontology. 2010;56:190–9. doi: 10.1159/000236027. [DOI] [PubMed] [Google Scholar]
- 42.Erlandson KM, Allshouse AA, Jankowski CDS, MaWhinney S, Kohrt WM, Campbell TB. Risk Factors for Falls in HIV-Infected Persons. J Acquir Immune Defic Syndr Hum Retrovirol. 2012 doi: 10.1097/QAI.0b013e3182716e38. [DOI] [PMC free article] [PubMed] [Google Scholar]
- 43.McComsey GA, Tebas P, Shane E, et al. Bone disease in HIV infection: a practical review and recommendations for HIV care providers. Clin Infect Dis. 2010;51:937–46. doi: 10.1086/656412. [DOI] [PMC free article] [PubMed] [Google Scholar]
- 44.Leifke E, Gorenoi V, Wichers C, et al. Age-related changes of serum sex hormones, insulin-like growth factor-1 and sex-hormone binding globulin levels in men: cross-sectional data from a healthy male cohort. Clinical endocrinology. 2000;53:689–95. doi: 10.1046/j.1365-2265.2000.01159.x. [DOI] [PubMed] [Google Scholar]
- 45.Cappola AR, Xue QL, Fried LP. Multiple hormonal deficiencies in anabolic hormones are found in frail older women: the Women’s Health and Aging studies. J Gerontol A Biol Sci Med Sci. 2009;64:243–8. doi: 10.1093/gerona/gln026. [DOI] [PMC free article] [PubMed] [Google Scholar]
- 46.Sonntag WE, Csiszar A, de Cabo R, Ferrucci L, Ungvari Z. Diverse roles of growth hormone and insulin-likegrowth factor-1 in Mammalian aging: progress and controversies. J Gerontol A Biol Sci Med Sci. 2012;67:587–98. doi: 10.1093/gerona/gls115. [DOI] [PMC free article] [PubMed] [Google Scholar]
- 47.Perrini S, Laviola L, Carreira MC, et al. The GH/IGF1 axis and signaling pathways in the muscle and bone: mechanisms underlying age-related skeletal muscle wasting and osteoporosis. The Journal of endocrinology. 2010;205:201–10. doi: 10.1677/JOE-09-0431. [DOI] [PubMed] [Google Scholar]
- 48.Martin JL, Baxter RC. Signalling pathways of insulin-like growth factors (IGFs) and IGF binding protein-3. Growth Factors. 2011;29:235–44. doi: 10.3109/08977194.2011.614237. [DOI] [PubMed] [Google Scholar]
- 49.Le Roith D. The insulin-like growth factor system. Experimental diabesity research. 2003;4:205–12. doi: 10.1155/EDR.2003.205. [DOI] [PMC free article] [PubMed] [Google Scholar]
- 50.Mulroney SE, McDonnell KJ, Pert CB, et al. HIV gp120 inhibits the somatotropic axis: a possible GH-releasing hormone receptor mechanism for the pathogenesis of AIDS wasting. Proceedings of the National Academy of Sciences of the United States of America. 1998;95:1927–32. doi: 10.1073/pnas.95.4.1927. [DOI] [PMC free article] [PubMed] [Google Scholar]
- 51.Langford D, Baron D, Joy J, Del Valle L, Shack J. Contributions of HIV infection in the hypothalamus and substance abuse/use to HPT dysregulation. Psychoneuroendocrinology. 2011;36:710–9. doi: 10.1016/j.psyneuen.2010.10.005. [DOI] [PMC free article] [PubMed] [Google Scholar]
- 52.Shah K, Hilton TN, Myers L, et al. A new frailty syndrome: central obesity and frailty in older adults with the human immunodeficiency virus. J Am Geriatr Soc. 2012;60:545–9. doi: 10.1111/j.1532-5415.2011.03819.x. [DOI] [PMC free article] [PubMed] [Google Scholar]
- 53.Centers for Disease Control and Prevention. 2009 age-adjusted estimate of the percentage of adults who are obese. [Accessed 4/27/2012];County-Level Estimates of Obesity. http://apps.nccd.cdc.gov/DDT_STRS2/NationalDiabetesPrevalenceEstimates.aspx?mode=DBT.
- 54.McComsey GA, Kitch D, Sax PE, et al. Peripheral and central fat changes in subjects randomized to abacavir-lamivudine or tenofovir-emtricitabine with atazanavir-ritonavir or efavirenz: ACTG Study A5224s. Clin Infect Dis. 2011;53:185–96. doi: 10.1093/cid/cir324. [DOI] [PMC free article] [PubMed] [Google Scholar]
- 55.Ibrahim MM. Subcutaneous and visceral adipose tissue: structural and functional differences. Obesity reviews : an official journal of the International Association for the Study of Obesity. 2010;11:11–8. doi: 10.1111/j.1467-789X.2009.00623.x. [DOI] [PubMed] [Google Scholar]
- 56.Koster A, Ding J, Stenholm S, et al. Does the amount of fat mass predict age-related loss of lean mass, muscle strength, and muscle quality in older adults? J Gerontol A Biol Sci Med Sci. 2011;66:888–95. doi: 10.1093/gerona/glr070. [DOI] [PMC free article] [PubMed] [Google Scholar]
- 57.Gnudi S, Sitta E, Fiumi N. Relationship between body composition and bone mineral density in women with and without osteoporosis: relative contribution of lean and fat mass. Journal of bone and mineral metabolism. 2007;25:326–32. doi: 10.1007/s00774-007-0758-8. [DOI] [PubMed] [Google Scholar]