

Abstract
Purpose
While girls are generally less physically active than boys, some girls regularly engage in high levels of physical activity (PA); however, very little is known about these girls and how they differ from those who are less physically active. This study examined the PA behavior and related characteristics of highly-active adolescent girls and compared them with those who are less active.
Methods
Data from 1,866 8th grade girls from 6 field centers across the U.S. participating in the Trial of Activity for Adolescent Girls (TAAG) were included in the present analysis. Mixed model ANOVAs examined differences in sociodemographic, anthropometric, psychosocial, and physical activity (accelerometry and self-report) variables between high- and low-active girls; effect sizes were calculated for the differences.
Results
High-active girls were taller, had lower BMIs and body fat, and were less sedentary. High-active girls scored higher on self-efficacy, enjoyment of PA, self-management strategies, outcome-expectancy value, and support from family and friends than low-active girls. Low-active girls participated in more leisure-time and educational sedentary activities than high-active girls. High-active girls participated in more PA classes/lessons outside of school, team sports, and individual sports. They were also more likely to participate in sports in an organized setting in the community or at school than low-active girls.
Conclusions
Health promotion efforts should focus on decreasing the amount of time girls spend in sedentary activities and replacing that time with organized PA opportunities; such efforts should seek to minimize perceived barriers and increase self-efficacy and support for PA.
Keywords: physical activity, girls, psychosocial, sedentary behavior, sports participation
INTRODUCTION
It is well established in the literature that girls are less physically active than boys [1–3]. Girls are also less likely than boys to meet national guidelines for physical activity [4]. Potential reasons for this gender difference include boys spending more time in activity-enhancing environments (e.g., outdoors) and participating in sports, and boys and girls engaging in different types of activities [5]. Several studies have explored the correlates of physical activity in girls and found that socioeconomic status [6], psychosocial factors [7–9], support for physical activity [10,11], and sport participation [12] were associated with higher physical activity in girls. However, to date no studies have explicitly described the characteristics of girls who regularly engage in high levels of physical activity and compared these with girls who engage in low levels of physical activity.
Several studies have explored the factors associated with participating in higher levels of physical activity, specifically looking at children [13,14] or adolescents [15,16] who meet or fail to meet national physical activity guidelines. While very few girls are meeting national physical activity guidelines [6], some girls are more active than others. Currently, no studies have identified the specific psychosocial, behavioral, and environmental/contextual characteristics of highly-active girls and examined how these factors differ in girls who are less active. It is unclear whether the social and physical context for physical activity varies between children of different overall physical activity levels. A detailed understanding of where and with whom highly active girls participate in physical activity could be used to inform the design and approach of interventions to increase physical activity in less active girls.
The purpose of this study was to examine the physical activity behavior and related characteristics of highly-active adolescent girls. The study has two aims: a) to describe the physical activity behavior and related characteristics of high-active 8th grade girls, and b) to compare the behaviors and characteristics of high-active girls with low-active girls of similar ages.
METHODS
Study design
Participants in this study were enrolled in the Trial of Activity for Adolescent Girls (TAAG), a multi-center study sponsored by the National Heart, Lung, and Blood Institute (NHLBI). TAAG tested the effects of an intervention designed to reduce the typical decline in moderate-to-vigorous physical activity (MVPA) among middle school girls. Participants included girls from two successive 8th grade class cohorts from 36 middle schools across 6 field centers (Tucson, AZ, Baltimore, MD, Minneapolis, MN, San Diego, CA, New Orleans, LA, and Columbia, SC). The coordinating center at the University of North Carolina at Chapel Hill and the project office at the NHLBI managed the study. The study was approved by the Institutional Review Boards at each participating university. For the present study, only girls from the 18 control schools were included in the analyses.
Measurement
Measurement coordinators from each field center were trained at a central training session and they subsequently trained and certified local measurement staff. All data (e.g., surveys, accelerometry) were collected during at least 2 separate calendar weeks in each school to minimize intraclass correlation between girls within a school [17]. A self-administered, paper and pencil survey instrument was completed in a classroom setting during one 40–45 minute class period. Trained data collectors provided initial instruction, were available to answer questions, and oversaw the overall procedures of administration.
Participants
The original TAAG sample included 3,489 participants from both the intervention and control schools; the average age was 13.9 ± 0.5 years, and the racial/ethnic breakdown was 48% white, 22% Hispanic, 18% black, and 12% ‘other.’ The girls had an average BMI of 22.7 ± 5.4, and engaged in an average of 21.7 ± 11.3 minutes of MVPA per day. Parents provided written informed consent and girls gave their assent prior to beginning the study. Data collection occurred between 2005 and 2006.
From the original sample, two groups of girls (high-active and low-active) were created using specific criteria. These criteria included the triangulation of three separate physical activity cut-points in order to provide consistent evidence of high and low activity levels in girls. Adherence to the national guidelines for physical activity for youth (i.e., at least 60 minutes of MVPA each day) was not a criterion given that very few girls are meeting these guidelines [6]. The criteria to distinguish between high- and low-active girls included the following:
-
The high-active group consisted of girls across the 6 field centers who were at or above the 85th percentile for all of the following three MVPA variables assessed by accelerometry:
Average daily minutes of MVPA using 4.6 metabolic equivalents (METs; 1 MET = 3.5 mL O2 × kg−1 × min−1) as the cut-point; this cut-point has previously been shown to best discriminate between slow and brisk walking among 8th grade girls [18];
Average daily minutes of intensity-weighted (i.e., MET-weighted) MVPA using 4.6 METs as the cut-point (i.e., the sum of the MET values for all time increments above the 4.6 MET cut-point).
Average daily minutes of MVPA using 3 METs as the cut-point; this cut-point has been used in some studies with youth [19–21] and is typically used in studies with adults [22,23].
The low-active group consisted of girls across the 6 field centers who were below the 50th percentile for all three MVPA variables; the lower half of the distribution was selected because it was believed to be representative of low activity given girls’ very low levels of MVPA as a group.
The original TAAG sample (N=3,489) was restricted to girls with complete data on all variables of interest, resulting in a total of 479 8th grade girls who met the criteria for the high-active group, and 1,387 who met the criteria for the low-active group.
Accelerometry
The girls wore an ActiGraph accelerometer (Model 7164, Manufacturing Technologies Inc. Health Systems, Shalimar, FL) for 7 consecutive days. TAAG staff distributed the accelerometers and provided detailed verbal and written instructions on how and when to wear them. Accelerometers were initialized prior to data collection and were set to begin collecting data at 5 am on the day after they were distributed to participants; thus, data for 6 complete days were available for analysis. Data were collected and stored in 30-second intervals. Girls wore the accelerometers on their right hip, attached to a belt, and were asked to take it off only when sleeping, bathing, or swimming. After 6 days of recording, data collectors retrieved the monitors, downloaded the data, and sent it to the coordinating center.
Occasional missing data within a girl’s 6-day record were replaced via imputation based on the Expectation Maximization (EM) algorithm [24]. Girls were included if they had at least 1 full day of data out of the expected 6 days [6]. Non-wear time, defined as any period of 20 or more minutes of consecutive 0’s, was recoded to missing. On average, approximately 12 hours of data (about 11%) per girl were imputed over the 6 days of data collection.
Accelerometer readings at or above 1500 counts per 30 seconds were treated as MVPA (4.6 METs), and readings below 50 counts per 30 seconds (~2.1 METs) were treated as sedentary behavior [18]. Also for counts above 1500 per 30 seconds, METs were estimated using a regression equation [25]. One MET-minute represents the metabolic equivalent of energy expended while sitting at rest for 1 minute. The intensity-weighted (i.e., MET-weighted) minutes of MVPA (MW-MVPA) were then computed by summing the MET values for all time increments above the 1500 per 30 seconds cut-point divided by 2 (to convert 30-second intervals to minutes). Using these cut-points, accumulated minutes per day of MVPA, MW-MVPA and sedentary behavior were determined for each participant.
Psychosocial Variables
The psychosocial constructs assessed in the present study included self-efficacy for physical activity (8 items), perceived barriers to physical activity (9 items), enjoyment of physical activity (6 items), enjoyment of physical education (P.E.) class (1 item), self-management strategies (6 items), outcome-expectancy value (5 belief statements and their corresponding value statements), family support, (5 items) and friend support (3 items). All items were assessed using a 5-point Likert-type scale. These measures have been described in detail elsewhere [7,9,26], and the scales were found to have factorial validity across racial/ethnic and BMI groups in both 6th and 8th grade TAAG girls [27].
Body Mass Index (BMI) and Body Fat
Anthropometric measures were assessed by trained data collectors. Height and weight were measured two times each using state-of-the-art equipment with the participant wearing light clothing and no shoes. The average of each of the 2 measures was used to calculate BMI using the standard equation (body weight [kg] / height [m2]). BMI categories of normal weight (BMI <85th percentile), at-risk-for overweight (BMI ≥ 85th percentile but < 95th percentile), and overweight (BMI ≥ 95th percentile) were derived from the 2000 Centers for Disease Control and Prevention (CDC) growth charts (http://www.cdc.gov/growthcharts/) using age-specific percentiles for females.
Triceps skinfold was taken in triplicate to the nearest 0.1 cm on the right side of the body according to standard procedures [28]; the average of the three measurements was used. Fat mass and fat-free mass were estimated using an equation developed specifically for TAAG using age (yr), race/ethnicity (non-Hispanic black = 1, other = 0), BMI (kg/m2) and triceps skinfold (mm) [29].
Self-reported physical activity
Self-reported physical activity was assessed using a modified version of the 3-Day Physical Activity Recall (3DPAR) [30,31]. The 3DPAR required participants to recall their physical activity behavior from the previous 3 days, using a script and graphic figures to explain the intensity (e.g., light, moderate, hard) of common activities. Participants were asked to complete a grid divided into 30-minute time blocks, beginning at 6 am and ending at 12 midnight. A list of 71 activities was provided. MET values for each activity were obtained from the Compendium of Physical Activities [32]. Girls also reported where (e.g., school, home/ neighborhood, community facility, other outdoor public area, other location) and with whom (e.g., by herself, with one other person, with several people, with an organized program, class, or team) non-sedentary activities took place. For the present study, ‘other outdoor public area’ and ‘other’ were combined with community facility.
For each activity, the mean number of 30-min time blocks for each participant was calculated by dividing the number of reported 30-min blocks by the number of days on which the activity was performed to produce the frequency of 30-min blocks per day. For this analysis, the activities were grouped into 7 categories: all sedentary activities, leisure-time sedentary activities, (e.g., television, computer), educational sedentary activities (e.g., reading, homework), physical education, team sport activities (e.g., basketball, soccer), individual physical activities (e.g., aerobics, dance, running), and lifestyle physical activities (e.g., chores, shopping).
TAAG data collection for the 3DPAR was such that days of recall may include 0–2 weekend days. Further, although collection of the 3DPAR and accelerometer data was scheduled to overlap, occasionally it did not (e.g., if a girl was absent when she initially was scheduled to complete the 3DPAR).
Sociodemographic variables
Girls classified themselves in 1 of 5 racial/ethnic categories: Asian, African American, Hispanic, white, or other. Girls’ age was calculated as the time between their date of birth (reported by parents on the consent form) and the questionnaire completion date. Socioeconomic status (SES) was assessed by asking each girl whether she received free/reduced lunch at school (yes, no, or don’t know/missing).
Girls’ participation in community sports, and physical activity classes/lessons outside of school was assessed as scale scores. Community Sports was computed as the sum of a checklist (0 = no; 1 = yes) of 15 sports teams (including ‘other’) that a girl could have participated in outside of school during the past year. Sports and Activity Participation was computed as the sum of 18 physical activity classes/lessons (including ‘other’) that a girl could have participated in outside of school during the past year.
Statistical Analyses
Means (SD) for high-active girls and low-active girls were calculated for the sociodemographic, psychosocial and physical activity variables. Mixed model ANOVA (proc mixed) was used to compare these variables between the two activity groups. Girls were nested within schools and schools were nested within the study site; schools nested within the study site were treated as a random variable. Effect sizes were calculated for differences and a phi coefficient (equivalent to r) was calculated for frequency tables. Cohen’s d (M1 - M2/pooled SD) was converted to r as (d / (d 2 + 4)1/2). According to conventional statistical guidelines, effect sizes r were practically judged as small (r = .10), moderate (r = .20), or large (r = .40) [33]. The 3DPAR variables were also examined for the total day and by time of day (e.g., 6–8 am, 8 am–3 pm, 3 pm–9 pm). Using all three days of the report, distribution of the physical and social contexts in which the 30-minute intervals for team sports occurred for the two groups was examined.
RESULTS
More high-active girls were from California (25.5% high-active vs. 14.3% low-active), Minnesota (22.6% high-active vs. 17.9% low-active), and Arizona (16.9% high-active vs. 8.8% low-active), whereas more low-active girls were from South Carolina (23.1% low-active vs. 8.1% high-active), Maryland (21.4% low-active vs. 18.0% high-active), and Louisiana (14.5% low-active vs. 9.0% high-active).
There were no statistical differences between the high- and low-active girls with regard to age, race/ethnicity, weight, fat-free mass, on free or reduced lunch (Table 1). However, girls in the high-active group were significantly taller and had lower BMIs, lower fat mass, lower mean skinfold thickness, fewer sedentary min/day, and more MVPA and MET-weighted MVPA min/day than girls in the low-active group. High-active girls also reported participating in significantly more physical activity classes/lessons outside of school and more community sports teams. Effect sizes indicate that the differences between body weight/body fat variables were small, while differences between the physical activity variables were moderate to large.
Table 1.
Means (SD) and results of Univariate Mixed Model ANOVAs or logistic regression
| Low-active (n=1387) | High-active (N=479) | Effect size† | p-value‡ | ||
|---|---|---|---|---|---|
| Mean (SD) or % | Mean (SD) or % | Unadj. Adjusted | |||
| Age | 14.0 (0.5) | 14.0 (0.4) | .03 | .85 | .79 |
| Height, cm | 159.7 (6.5) | 161.0 (6.9) | .10 | .001 | .002 |
| Weight, kg | 58.9 (16.0) | 56.8 (14.2) | .07 | .07 | .08 |
| BMI | 23.0 (5.7) | 21.8 (4.7) | .11 | .002 | .002 |
| Race* | |||||
| Black | 19.4% | 12.9% | Phi=.0879 | .05 | .08 |
| White | 46.3% | 54.7% | |||
| Hispanic | 22.2% | 21.9% | |||
| Other | 12.1% | 10.4% | |||
| Free/reduced lunch | N=1372 | N=475 | |||
| Don’t know | 7.7% | 7.8% | Phi=.062 | .52 | .90 |
| No | 54.0% | 60.6% | |||
| Yes | 38.3% | 32.6% | |||
| Fat mass, kg | 19.9 (10.3) | 17.9 (9.1) | .10 | .001 | .003 |
| Fat-free mass, kg | 39.0 (6.6) | 38.9 (5.8) | .01 | ||
| Log fat-free mass | 3.7 (0.2) | 3.6 (0.1) | .00 | .40 | .43 |
| Triceps | 21.6 (8.4) | 19.4 (7.3) | .14 | <.001 | <.001 |
| Overweight/obese | 35.9% | 25.7% | Phi=.0948 | .001 | .002 |
| Sedentary min/day | 556.1 (55.8) | 483.0 (60.3) | .54 | <.001 | <.001 |
| MVPA min/day | 12.7 (1.8) | 42.9 (10.3) | .93 | <.001 | <.001 |
| MW-MVPA min/day | 74.6 (22.5) | 273.8 (77.3) | .92 | <.001 | <.001 |
| 6am–9am MW-MVPA | N=1375 | N=474 | |||
| 39.1 (301.9) | 37.1 (143.6) | ||||
| Log transformed | Median=7.6 | Median=18.4 | |||
| 0.9 (0.6) | 1.5 (0.6) | .43 | <.001 | <.001 | |
| 2–6pm MW-MVPA | N=1369 | N=475 | |||
| 70.9 (438.7) | 117.3 (255.1) | ||||
| Log transformed | Median=19.7 | Median=82.7 | |||
| 1.5 (0.6) | 2.6 (0.6) | .64 | <.001 | <.001 | |
| 9am–2pm MVPA min/day | N=1387 | N=479 | |||
| 4.3 (2.6) | 12.1 (7.2) | ||||
| Log transformed | 1.5 (0.5) | 2.4 (0.6) | .61 | <.001 | <.001 |
| 9am–2pm MW-MVPA min/day | N-1387 | N=479 | |||
| 25.1 (16.3) | 74.9 (49.9) | ||||
| Log transformed | Median=21.2 | Median=56.4 | |||
| 3.1 (0.7) | 4.1 (0.7) | .63 | <.001 | <.001 | |
| PA classes/lessons past year (sum of 1–8) | N=380 2.4 (1.9) |
N=926 2.0 (1.6) |
.12 | <.001 | <.001 |
| Sports teams past year (sum 1–15) | N=372 2.5 (1.9) |
N=903 2.3 (1.9) |
.06 | .01 | .01 |
Note: MVPA, moderate-to-vigorous physical activity; MW-MVPA, MET-weighted minutes of MVPA; PA, physical activity; Hour breakdown for MVPA and MW-MVPA based on accelerometry data; The sports teams variable included only those sports teams girls participated on outside of school in the past year;
Other race included girls who identified as more than one race or ‘Native Hawaiian or other Pacific Islanders’
r was calculated as (M1-M2)/pooled SD or Phi, Effect sizes are practically judged as small (r=.10), moderate (r=.20) or large (r=.40)
Adjusted for age, race, BMI (when appropriate); school nested within study site was treated as a random variable;
The results of mixed model ANOVA for the psychosocial variables by active group are presented in Table 2. High-active girls had significantly higher mean values for self-efficacy, enjoyment of physical activity, enjoyment of P.E. class, self-management strategies, outcome-expectancy value, family support, and friend support compared with low-active girls. Low-active girls had higher mean values for perceived barriers than high-active girls.
Table 2.
Psychosocial variables by high- and low-active group†
| Variable | Cronbach’s Alpha | Low-Active | High-Active | Effect size | Unadjusted p-value | Adjusted p-value | ||
|---|---|---|---|---|---|---|---|---|
| N | Mean (SD) | N | Mean (SD) | |||||
| Self-efficacy (8 items) | 0.81 | 1380 | 28.7 (6.3) | 474 | 31.1 (5.7) | .19 | <.001 | <.001 |
| Perceived Barriers (9 items) | 0.77 | 1367 | 19.3 (5.6) | 479 | 17.8 (5.3) | .13 | <.001 | <.001 |
| Enjoyment of PA (6 items) | 0.89 | 1387 | 28.8 (6.0) | 476 | 30.3 (5.5) | .13 | <.001 | <.001 |
| Enjoyment of P.E. (1 item) | N/A | 1375 | 3.5 (1.3) | 477 | 3.8 (1.3) | .12 | <.001 | <.001 |
| Self-Management strategies (6 items) | 0.83 | 1379 | 19.1 (4.9) | 475 | 20.4 (5.1) | .13 | <.001 | <.001 |
| Outcome-expectancy value (5 items) | 0.83 | 1366 | 85.7 (25.8) | 471 | 88.7 (27.4) | .06 | .01 | .01 |
| Family support (4 items) | 0.86 | 1370 | 15.2 (4.8) | 475 | 17.0 (4.8) | .18 | <.001 | <.001 |
| Friend support (3 items) | 0.81 | 1365 | 8.3 (2.9) | 476 | 9.4 (2.9) | .19 | <.001 | <.001 |
Note: PA, physical activity; PE, physical education; Mixed model ANOVA (proc mixed) analyses adjusted for age, race, and BMI; school nested within study site was treated as a random variable;
Sample sizes differed between cells due to the fact that not all instruments were completed by each girl
Table 3 presents the mean number of 30-min blocks per day of reported physical and sedentary activity categories by active group. These were averaged over the 3 days and are presented for the total day and by time of day. High-active girls reported participating in significantly more team sports during the total day (p<.001, r = .34), and between the hours of 8 am–3 pm (p<.001, r = .16) and 3 pm–9 pm (p<.001, r = .21) than low-active girls. High-active girls also reported participating in more individual sports during the total day (p<.01, r = .09) and between the hours of 3 pm–9 pm (p<.05, r = .08) than low-active girls. Further, high-active girls reported participating in more lifestyle activities than low-active girls during the total day (p<.01, r = .07) and between the hours of 6 am–8 am (p<.001, r = .11). Low-active girls reported engaging in significantly more total sedentary activities (total day: p<.001, r = .15; 3 pm–9 pm: p<.001, r = .14), leisure-time sedentary activities (total day: p<.001, r = .05; 3 pm–9 pm: p<.001, r = .14), and educational sedentary activities (total day: p<.001, r = .05) than high-active girls.
Table 3.
3DPAR number of 30 min blocks per day (averaged over 3 days) by active group
| Variable | Total day | Before school† | School day† | After school† | ||||||||
|---|---|---|---|---|---|---|---|---|---|---|---|---|
| 6 am–12 midnight | 6–8 am | 8 am–3 pm | 3–9 pm | |||||||||
| Low | High | r | Low | High | r | Low | High | r | Low | High | r | |
| Total sedentary | 10.1 (3.8) | 9.0 *** (3.6) | .15 | .14 (0.4) | .16 (0.4) | .02 | 2.4 (2.5) | 2.2 (2.3) | .03 | 4.4 (2.1) | 3.8*** (2.1) | .14 |
| Leisure sedentary | 8.2 (4.0) | 7.2*** (3.8) | .12 | .13 (0.4) | .15 (0.4) | .03 | 2.0 (2.3) | 1.9 (2.2) | .03 | 3.6 (2.1) | 3.0*** (2.1) | .14 |
| Educational sedentary | 2.0 (1.9) | 1.8*** (1.7) | .05 | .01 (0.1) | .00 (0.1) | .02 | 0.3 (0.8) | 0.3 (0.7) | .02 | 0.7 (1.1) | 0.7 (1.1) | .01 |
| P.E. class | 0.3 (0.6) | 0.4 (0.7) | .02 | |||||||||
| Team sports | 0.4 (0.9) | 1.3*** (1.8) | .34 | .00 (0.1) | .01 (0.1) | .03 | 0.1 (0.5) | 0.3*** (1.0) | .16 | 0.2 (0.7) | 0.5*** (1.1) | .21 |
| Individual PA | 0.5 (1.0) | 0.7** (1.3) | .09 | .01 (0.1) | .01 (0.1) | .02 | 0.1 (0.5) | 0.2 (0.8) | .04 | 0.2 (0.7) | 0.4* (0.9) | .08 |
| Lifestyle activities | 1.5 (1.5) | 1.8 ** (1.9) | .07 | .04 (0.2) | .09*** (0.3) | .11 | 0.8 (1.2) | 0.8 (1.3) | .03 | 0.6 (1.1) | 0.6 (1.1) | .01 |
Note: P.E., physical education; PA, physical activity; r = effect size;
p<.05,
p<.01,
p<.001 difference after adjusting for age, BMI, and race; school nested within study site was treated as a random variable;
TAAG data collection for the 3DPAR was such that days of recall may have included 0–2 weekend days; therefore, the in-school hours (8 am to 3 pm) may have included both weekdays and weekend days.
Figure 1 presents the locations where girls reported participating in the top 10 most prevalent team sports. For basketball, high-active girls reported playing more often at school, while low-active girls reported playing more often at home. High-active girls reported participating in cheerleading and volleyball more often in the community, while low-active girls reported participating in these activities more often at school. High-active girls reported playing soccer more often in the community, while low-active girls reported playing soccer more often at home. High-active girls reported participating in softball and track more often at school while low-active girls reported participating in these activities more often in the community. There were no differences between the two groups in reported location for gymnastics, hockey (i.e., ice, field, street, or floor), swimming, or tennis.
Figure 1. Team Sports, 3DPAR % of 30 minute blocks performed at different locations by active group;

LA, low-active girls; HA, high-active girls; Cheer, cheerleading; Gym, gymnastics; numbers refer to number of girls who reported engaging in that activity in the previous 3 days;
*Indicates significant difference between the high- and low-active girls
Figure 2 presents the social contexts (i.e., “with whom”) in which the girls reported participating in the 10 most prevalent team sports. There were significant differences between the high- and low-active girls for with whom they reported participating in the following activities: basketball, cheerleading, hockey, soccer, swimming, and volleyball (p’s<.01). Overall, high-active girls most often reported participating in these sports/physical activities with an organized program, class or team rather than by themselves, with one other person, or with several people. With the exception of cheerleading, low-active girls most often reported participating in these activities with several people compared with the high-active girls.
Figure 2. Team sports, 3DPAR % of 30 minute blocks with whom by active group;
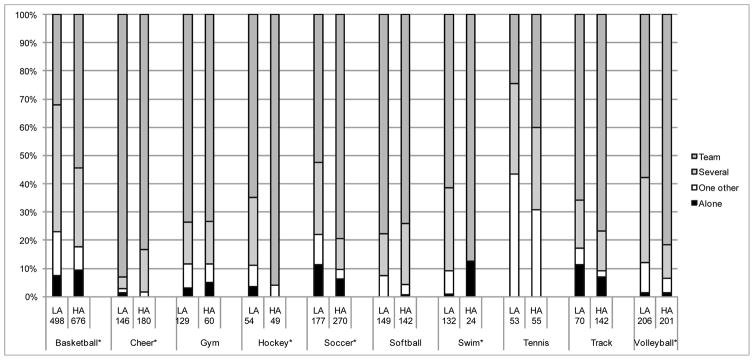
LA, low-active girls; HA, high-active girls; Cheer, cheerleading; Gym, gymnastics; numbers refer to number of girls who reported engaging in that activity in the past 3 days;
*Indicates significant difference between the high- and low-active girls
DISCUSSION
The present study found that high-active girls participated in more physical activity classes/lessons outside of school, team sports, and individual sports than low-active girls. Of the top 10 sports that were reported by girls, high-active girls reported participating in those sports with an organized program, class, or team rather than with several other people, one other person, or by themselves. It could be that low-active girls are engaging in these sports as a casual pick-up game around their home or at school with a few people, while high-active girls are participating on a team within organized programs. In line with this reasoning, this study provides evidence that high-active girls are more likely to participate in sports in an organized setting in the community or at school than low-active girls. Participation in organized sports has been associated with higher levels of physical activity in adolescents [34], and positive attitudes toward sports in adolescence have been shown to be a predictor of MVPA 5 and 10 years later [35]. Efforts should be made to recruit low-active girls to participate in such organized programs and provide them with adequate support in order to reap immediate and possibly more long-term health benefits.
Because this study provides a cross-sectional ‘snapshot’ we are unable to draw conclusions about the directionality of these relationships. Whether currently high-active girls seek out organized programs more, or have higher physical activity as a result of participating in these programs, is unknown. A complex interplay of individual, environmental, and cultural factors likely facilitates and promotes higher levels of physical activity in some girls. Longitudinal studies that are able to track the natural history and development of girls’ physical activity over time will allow researchers to begin to explore these questions.
This study found that girls who engaged in very low levels of MVPA also engaged in significantly more minutes per hour of sedentary behavior and significantly more total sedentary activities than high-active girls. It is possible that low-active girls simply prefer sedentary activities over more physically active ones. Time spent in sedentary activity has been associated with obesity [36,37] and unfavorable metabolic profiles in children [38,39]. As such, health promotion efforts should focus on decreasing the amount of time girls spend in leisure-time and educational sedentary activities and encouraging them to replace those activities with non-sedentary ones. Further, increasing family and friend support and decreasing perceived barriers to physical activity in low-active girls may be effective strategies to increase girls’ overall physical activity levels thereby helping them to meet the daily physical activity guidelines.
To our knowledge, this is the first study to examine the specific characteristics of highly-active girls and compare them with low-active girls. This study was further strengthened by its diverse sample and use of objective and validated measures of physical activity and social-cognitive variables. One limitation of this study is that participation in physical activities, lessons and sports were assessed as activities the girls performed in the past 3 days (3DPAR) or at least once in the past year (survey question), which limits our ability to describe in detail the frequency with which the high- and low-active girls are participating in these activities. Also, due to the cross-sectional nature of the data, we are unable to infer causality in the relationships between the variables and high physical activity in girls. An average of 11% of accelerometer data per girl was imputed over the 6 days of data collection. We did not have access to the raw accelerometry data and therefore were unable to run sensitivity analysis to determine whether girls with imputed data differ from those with complete data records.
This study provides valuable information about the physical activity behaviors and characteristics of highly-active adolescent girls. Participation in more organized and school-based activities with a class or team was characteristic of the high-active girls in this study. Further, in line with the existing literature and the Social Cognitive Theory, highly-active girls scored higher on self-efficacy, support for physical activity, enjoyment of physical activity and P.E., self-management strategies, and outcome-expectancy value, and lower on perceived barriers [7,8,40]. Interventions that aim to increase physical activity in girls may benefit from integrating approaches to increase girls’ self-efficacy and social support, as well as involve them in more organized physical activity opportunities.
IMPLICATIONS AND CONTRIBUTION.
This study is the first to examine the specific physical activity behaviors and related characteristics of highly-active adolescent girls. Information on the unique correlates of physical activity in highly-active girls can be used to inform future interventions to increase physical activity in less active girls.
Acknowledgments
This study was funded by the following cooperative agreements from the National Heart, Lung, and Blood Institute: U01 HL066855 (Tulane University); U01HL066845 (University of Minnesota); U01HL066852 (University of South Carolina); U01HL066853 (University of North Carolina at Chapel Hill); U01HL066856 (San Diego State University); U01HL066857 (University of Maryland); and U01HL066858 (University of Arizona). The authors thank Gaye Groover Christmus, MPH, University of South Carolina, for editorial assistance.
Abbreviations
- BMI
Body Mass Index
- TAAG
Trial of Activity for Adolescent Girls
- MVPA
moderate-to-vigorous physical activity
- MET
metabolic equivalent
- 3DPAR
3-Day Physical Activity Recall
- P.E.
physical education
Footnotes
The authors have no potential, perceived, or real conflicts of interest to disclose. SETR and MD wrote the first draft of the manuscript and neither received an honorarium, grant, or other form of payment to produce the manuscript.
Publisher's Disclaimer: This is a PDF file of an unedited manuscript that has been accepted for publication. As a service to our customers we are providing this early version of the manuscript. The manuscript will undergo copyediting, typesetting, and review of the resulting proof before it is published in its final citable form. Please note that during the production process errors may be discovered which could affect the content, and all legal disclaimers that apply to the journal pertain.
References
- 1.Olds T, Wake M, Patton G, et al. How do school-day activity patterns differ with age and gender across adolescence? J Adolesc Health. 2009 Jan;44:64–72. doi: 10.1016/j.jadohealth.2008.05.003. [DOI] [PubMed] [Google Scholar]
- 2.Riddoch CJ, Mattocks C, Deere K, et al. Objective measurement of levels and patterns of physical activity. Arch Dis Child. 2007 Nov;92:963–969. doi: 10.1136/adc.2006.112136. [DOI] [PMC free article] [PubMed] [Google Scholar]
- 3.Troiano RP, Berrigan D, Dodd KW, et al. Physical activity in the United States measured by accelerometer. Med Sci Sports Exerc. 2008 Jan;40:181–188. doi: 10.1249/mss.0b013e31815a51b3. [DOI] [PubMed] [Google Scholar]
- 4.Centers for Disease Control and Prevention. Youth Risk Behavior Surveillance - United States, 2009. MMWR Surveill Summ. 2010;59:1–148. [PubMed] [Google Scholar]
- 5.Bailey R, Wellard I, Dishmore H. Girl’s participation in physical activities and sports: Benefits, patterns, influences and ways forward. Canterbury, UK: Canterbury Christ Church University College for the World Health Organisation; 2005. [Google Scholar]
- 6.Pate RR, Stevens J, Pratt C, et al. Objectively measured physical activity in sixth-grade girls. Arch Ped Adolesc Med. 2006;160:1262–1268. doi: 10.1001/archpedi.160.12.1262. [DOI] [PMC free article] [PubMed] [Google Scholar]
- 7.Dishman RK, Dunn AL, Sallis JF, et al. Social-cognitive correlates of physical activity in a multi-ethnic cohort of middle-school girls: Two-year prospective study. J Pediatr Psychol. 2010 Mar;35:188–198. doi: 10.1093/jpepsy/jsp042. [DOI] [PMC free article] [PubMed] [Google Scholar]
- 8.Lawman HG, Wilson DK, Van Horn ML, et al. The relationship between psychosocial correlates and physical activity in underserved adolescent boys and girls in the ACT trial. J Phys Act Health. 2011 Feb;8:253–261. doi: 10.1123/jpah.8.2.253. [DOI] [PMC free article] [PubMed] [Google Scholar]
- 9.Barr-Anderson DJ, Young DR, Sallis JF, et al. Structured physical activity and psychosocial correlates in middle-school girls. Prev Med. 2007 May;44:404–409. doi: 10.1016/j.ypmed.2007.02.012. [DOI] [PubMed] [Google Scholar]
- 10.Flintoff A, Scraton S. Stepping into active leisure? Young women’s perceptions of active lifestyles and their experiences of school physical education. Sport, Education and Society. 2001;6:5–21. [Google Scholar]
- 11.Bauer KW, Neumark-Sztainer D, Fulkerson JA, et al. Familial correlates of adolescent girls’ physical activity, television use, dietary intake, weight, and body composition. Int J Behav Nutr Phys Act. 2011;8:25. doi: 10.1186/1479-5868-8-25. [DOI] [PMC free article] [PubMed] [Google Scholar]
- 12.Saxena R, Borzekowski DL, Rickert VI. Physical activity levels among urban adolescent females. J Pediatr Adolesc Gynecol. 2002 Dec;15:279–284. doi: 10.1016/s1083-3188(02)00193-6. [DOI] [PubMed] [Google Scholar]
- 13.Anderson SE, Economos CD, Must A. Active play and screen time in US children aged 4 to 11 years in relation to sociodemographic and weight status characteristics: a nationally representative cross-sectional analysis. BMC Public Health. 2008;8:366. doi: 10.1186/1471-2458-8-366. [DOI] [PMC free article] [PubMed] [Google Scholar]
- 14.Spinks A, Macpherson A, Bain C, et al. Determinants of sufficient daily activity in Australian primary school children. J Paediatr Child Health. 2006 Nov;42:674–679. doi: 10.1111/j.1440-1754.2006.00950.x. [DOI] [PubMed] [Google Scholar]
- 15.Ortega FB, Ruiz JR, Hurtig-Wennlof A, et al. Physically active adolescents are more likely to have a healthier cardiovascular fitness level independently of their adiposity status. The European youth heart study. Rev Esp Cardiol. 2008 Feb;61:123–129. [PubMed] [Google Scholar]
- 16.Butcher K, Sallis JF, Mayer JA, et al. Correlates of physical activity guideline compliance for adolescents in 100 US Cities. J Adolesc Health. 2008 Apr;42:360–368. doi: 10.1016/j.jadohealth.2007.09.025. [DOI] [PMC free article] [PubMed] [Google Scholar]
- 17.Murray DM, Catellier DJ, Hannan PJ, et al. School-level intraclass correlation for physical activity in adolescent girls. Med Sci Sports Exerc. 2004 Jun;36:876–882. doi: 10.1249/01.mss.0000126806.72453.1c. [DOI] [PMC free article] [PubMed] [Google Scholar]
- 18.Treuth MS, Schmitz K, Catellier DJ, et al. Defining accelerometer thresholds for activity intensities in adolescent girls. Med Sci Sports Exerc. 2004 Jul;36:1259–1266. [PMC free article] [PubMed] [Google Scholar]
- 19.Pate RR, Freedson PS, Sallis JF, et al. Compliance with physical activity guidelines: Prevalence in a population of children and youth. Ann Epidemiol. 2002;12:303–308. doi: 10.1016/s1047-2797(01)00263-0. [DOI] [PubMed] [Google Scholar]
- 20.Trost SG, Kerr LM, Ward DS, et al. Physical activity and determinants of physical activity in obese and non-obese children. Int J Obes Relat Metab Disord. 2001 Jun;25:822–829. doi: 10.1038/sj.ijo.0801621. [DOI] [PubMed] [Google Scholar]
- 21.Thompson AM, Campagna PD, Rehman LA, et al. Physical activity and body mass index in grade 3, 7, and 11 Nova Scotia students. Med Sci Sports Exerc. 2005 Nov;37:1902–1908. doi: 10.1249/01.mss.0000176306.11134.23. [DOI] [PubMed] [Google Scholar]
- 22.U.S. Department of Health and Human Services. Physical Activity and Health: A Report of the Surgeon General. Atlanta: USDHSS/CDC; 1996. [Google Scholar]
- 23.Pate RR, Pratt M, Blair SN, et al. Physical activity and public health. A recommendation from the Centers for Disease Control and Prevention and the American College of Sports Medicine. JAMA. 1995;273:402–407. doi: 10.1001/jama.273.5.402. [DOI] [PubMed] [Google Scholar]
- 24.Catellier DJ, Hannan PJ, Murray DM, et al. Imputation of missing data when measuring physical activity by accelerometry. Med Sci Sports Exerc. 2005;37:S555–S562. doi: 10.1249/01.mss.0000185651.59486.4e. [DOI] [PMC free article] [PubMed] [Google Scholar]
- 25.Schmitz KH, Treuth M, Hannan P, et al. Predicting energy expenditure from accelerometry counts in adolescent girls. Med Sci Sports Exerc. 2005 Jan;37:155–161. doi: 10.1249/01.MSS.0000150084.97823.F7. [DOI] [PMC free article] [PubMed] [Google Scholar]
- 26.Lytle LA, Murray DM, Evenson KR, et al. Mediators affecting girls’ levels of physical activity outside of school: findings from the Trial of Activity in Adolescent Girls. Ann Behav Med. 2009 Oct;38:124–136. doi: 10.1007/s12160-009-9127-2. [DOI] [PMC free article] [PubMed] [Google Scholar]
- 27.Dishman RK, Hales DP, Sallis JF, et al. Validity of social-cognitive measures for physical activity in middle-school girls. J Pediatr Psychol. 2010 Jan;35:72–88. doi: 10.1093/jpepsy/jsp031. [DOI] [PMC free article] [PubMed] [Google Scholar]
- 28.American College of Sports Medicine. ACSM’s Guidelines for Exercise Testing and Prescription. 8. Philadelphia: Lippincott Williams and Wilkins; 2010. [Google Scholar]
- 29.Loftin M, Nichols J, Going S, et al. Comparison of the validity of anthropometric and bioelectric impedance equations to assess body composition in adolescent girls. Int J Body Compos Res. 2007;5:1–8. [PMC free article] [PubMed] [Google Scholar]
- 30.Pate RR, Ross R, Dowda M, et al. Validation of a three-day physical activity recall instrument in female youth. Pediatr Exerc Sci. 2003;15:257–265. [Google Scholar]
- 31.McMurray RG, Ring KB, Treuth MS, et al. Comparison of two approaches to structured physical activity surveys for adolescents. Med Sci Sports Exerc. 2004 Dec;36:2135–2143. doi: 10.1249/01.mss.0000147628.78551.3b. [DOI] [PMC free article] [PubMed] [Google Scholar]
- 32.Ainsworth BE, Haskell WL, Whitt MC, et al. Compendium of physical activities: An update of activity codes and MET intensities. Med Sci Sports Exerc. 2000;32:S498–S516. doi: 10.1097/00005768-200009001-00009. [DOI] [PubMed] [Google Scholar]
- 33.Cohen J. Statistical Power Analysis for the Behavioral Sciences. 2. Mahway, NJ: Lawrence Erlbaum; 1988. [Google Scholar]
- 34.Nilsson A, Andersen LB, Ommundsen Y, et al. Correlates of objectively assessed physical activity and sedentary time in children: a cross-sectional study (The European Youth Heart Study) BMC Public Health. 2009 Sep 7;9:322. doi: 10.1186/1471-2458-9-322. [DOI] [PMC free article] [PubMed] [Google Scholar]
- 35.Graham DJ, Sirard JR, Neumark-Sztainer D. Adolescents’ attitudes toward sports, exercise, and fitness predict physical activity 5 and 10 years later. Prev Med. 2011 Feb;52:130–132. doi: 10.1016/j.ypmed.2010.11.013. [DOI] [PMC free article] [PubMed] [Google Scholar]
- 36.Pratt C, Webber LS, Baggett CD, et al. Sedentary activity and body composition of middle school girls: the trial of activity for adolescent girls. Res Q Exerc Sport. 2008 Dec;79:458–467. doi: 10.1080/02701367.2008.10599512. [DOI] [PMC free article] [PubMed] [Google Scholar]
- 37.Steffen LM, Dai S, Fulton JE, et al. Overweight in children and adolescents associated with TV viewing and parental weight: Project HeartBeat! Am J Prev Med. 2009 Jul;37:S50–S55. doi: 10.1016/j.amepre.2009.04.017. [DOI] [PMC free article] [PubMed] [Google Scholar]
- 38.Mark AE, Janssen I. Relationship between screen time and metabolic syndrome in adolescents. J Public Health (Oxf) 2008 Jun;30:153–160. doi: 10.1093/pubmed/fdn022. [DOI] [PubMed] [Google Scholar]
- 39.Sardinha LB, Andersen LB, Anderssen SA, et al. Objectively measured time spent sedentary is associated with insulin resistance independent of overall and central body fat in 9- to 10-year-old Portuguese children. Diabetes Care. 2008 Mar;31:569–575. doi: 10.2337/dc07-1286. [DOI] [PubMed] [Google Scholar]
- 40.Heitzler CD, Lytle LA, Erickson DJ, et al. Evaluating a Model of Youth Physical Activity. Am J Health Behav. 2010;34:593–606. doi: 10.5993/ajhb.34.5.9. [DOI] [PMC free article] [PubMed] [Google Scholar]