

Abstract
The prognostic value of mitotic rate in melanoma is increasingly recognized, particularly in thin melanoma where the presence or absence of a single mitosis/mm2 can change staging from T1a to T1b. Still, accurate mitotic rate calculation (mitoses/mm2) on hematoxylin and eosin (H&E)-stained sections can be challenging. Anti-monoclonal mitotic protein-2 (MPM-2) and anti-phosphohistone H3 (PHH3) are two antibodies reported to be more mitosis-specific than other markers of proliferation such as Ki-67. We used light microscopy and computer-assisted image analysis software to quantify MPM-2 and PHH3 staining in melanoma. We then compared mitotic rates by each method to conventional H&E-based mitotic rate for correlation with clinical outcomes. Our study included primary tissues from 190 non-consecutive cutaneous melanoma patients who were prospectively enrolled at New York University Langone Medical Center with information on age, gender, and primary tumor characteristics. Mitotic rate was quantified manually by light microscopy of corresponding H&E, MPM-2, and PHH3-stained sections. Computer-assisted image analysis was then used to quantify immunolabeled mitoses on the previously examined PHH3 and MPM-2 slides. We then analyzed the association between mitotic rate and both progression-free and melanoma-specific survival. Univariate analysis of PHH3 found significant correlation between increased PHH3 mitotic rate and decreased progression-free survival (P=0.04). Computer-assisted image analysis enhanced the correlation of PHH3 mitotic rate with progression-free survival (P=0.02). Regardless of detection method, neither MPM-2 nor PHH3 offered significant advantage over conventional H&E determination of mitotic rate.
Keywords: melanoma, computer-assisted image analysis, digital pathology, PHH3, MPM-2, prognosis
INTRODUCTION
Mitotic rate is traditionally evaluated by counting mitotic figures on hematoxylin and eosin (H&E)-stained tissue sections. This count has been used to predict aggressive behavior in several neoplasms.(1–3) In melanoma, mitotic rate has been found to have independent prognostic value in primary melanomas of all thicknesses.(4–9) This finding has led the American Joint Committee on Cancer (AJCC) to adopt mitotic rate in the current staging system for thin (≤1 mm) non-ulcerated melanomas.(5, 6) Staging systems for other neoplasms, such as for breast carcinoma, use mitotic rate for prognostic categories whose cutoffs may be separated by several mitoses seen across multiple high power fields.(2, 10) In contrast, stage T1a melanoma may differ from T1b melanoma by the presence or absence of a single mitosis/mm2.(6)
As important as accurate mitotic rate assessment is in melanoma, its calculation on routine histology can be challenging.(11, 12) Factors such as heavy pigmentation, high cellularity, pyknotic debris, and necrosis may obscure mitotic figures. Immunohistochemical markers have been investigated as surrogates for mitotic rate with conflicting results. One example is MIB-1, an antibody against the Ki-67 nuclear antigen. Ki-67 is a cell proliferation marker expressed during all phases of the cell cycle except G0 and early G1. Several studies report an association between increased Ki-67 staining and poor outcome in melanoma.(13, 14) Other studies argue that despite an association with poor outcome, Ki-67 is not an independent prognostic factor.(15) Since Ki-67 lacks definitive independent prognostic significance, it has not been incorporated into the melanoma staging system. Anti-mitotic protein monoclonal-2 (MPM-2) and anti-phosphohistone-H3 (PHH3) are two relatively new antibodies that differ from earlier surrogate markers of proliferation in that their respective epitopes are restricted to the M phase. Thus, they are potentially more specific and sensitive markers of mitosis. MPM-2 recognizes phosphoprotein epitopes on mitosis-specific molecules, including topoisomerase II alpha, microtubule-associated proteins, and Cdc2-inhibitory kinases.(16–18) PHH3 binds more specifically to epitopes of histone H3 that are selectively phosphorylated during mitosis.(19) Recent data suggest that PHH3 immunostaining significantly increases interobserver agreement in mitotic rate calculation in thin melanomas.(20) The aim of the present study was to compare the prognostic value of traditional H&E-based mitotic rate with mitotic rate calculated using computer-assisted image analysis and mitosis-specific immunostaining.
MATERIALS AND METHODS
Sources of tissue
The study cohort consisted of primary melanoma patients enrolled in the Interdisciplinary Melanoma Cooperative Group, a prospectively-collected, clinicopathological-biospecimen database for melanoma at New York University Langone Medical Center.(21) Informed consent was obtained from all patients at the time of enrollment. Non-consecutive patients were selected by first identifying those with available primary tissue for immunohistochemistry and a minimum follow-up of 2.5 years from the date of pathological diagnosis. Primary melanoma patients meeting these two criteria were then divided into two groups: recurrent vs. non-recurrent and matched for age at initial melanoma diagnosis, gender, primary tumor thickness (mm), ulceration, mitosis (absent vs. present), histotype, and anatomic site (Table 1). A total of 190 patients were included in this study whose primary tumors ranged from 0.4 mm to 30 mm in thickness.
Table 1.
Clinicopathologic characteristics of 190 melanoma patients.
| Variable | Recurrence Status | P value | ||
|---|---|---|---|---|
| Recurred (N=97) |
Not recurred (N=93) |
|||
| Gender | 0.82 | |||
| Female | 38% (72/190) | 36 | 36 | |
| Male | 62% (118/190) | 61 | 57 | |
| Primary tumor anatomic site | 0.91 | |||
| Head/Neck | 24% (45/190) | 24 | 21 | |
| Axial | 38% (73/190) | 36 | 37 | |
| Extremity | 38% (72/190) | 37 | 35 | |
| Primary tumor histologic subtype | 0.47 | |||
| Superficial spreading melanoma | 37% (70/190) | 36 | 34 | |
| Nodular melanoma | 59% (113/190) | 58 | 55 | |
| Acral lentiginous melanoma | 1% (1/190) | 1 | 0 | |
| Lentigo maligna melanoma | 2% (3/190) | 2 | 1 | |
| Other melanoma | 2% (3/190) | 0 | 3 | |
| Age at pathological diagnosis (years) | 0.93 | |||
| Mean; Median | 58;58 | |||
| <40 | 19% (37/190) | 18 | 19 | |
| 40–60 | 35% (66/190) | 34 | 32 | |
| >60 | 46% (87/190) | 45 | 42 | |
| Primary tumor thickness (mm) | 0.99 | |||
| Mean; Median | 3.0;1.9 | |||
| ≤1.00 | 12% (22/190) | 11 | 11 | |
| 1.01–2.00 | 44% (84/190) | 43 | 41 | |
| 2.01–4.00 | 26% (50/190) | 25 | 25 | |
| >4.00 | 18% (34/190) | 18 | 16 | |
| Primary tumor ulceration status | 0.94 | |||
| Absent | 63% (120/190) | 61 | 59 | |
| Present | 37% (70/190) | 36 | 34 | |
| Primary tumor H&E mitotic rate (mitoses/mm2) | 0.1 | |||
| 0 | 25% (48/190) | 20 | 28 | |
| ≥1 | 75% (142/190) | 77 | 65 | |
| T-stage (2009 American Joint Committee on Cancer) | 1 | |||
| T1a | 6% (12/190) | 6 | 6 | |
| T1b | 5% (10/190) | 5 | 5 | |
| T2a | 33% (62/190) | 32 | 30 | |
| T2b | 12% (22/190) | 11 | 11 | |
| T3a | 16% (30/190) | 15 | 15 | |
| T3b | 11% (20/190) | 10 | 10 | |
| T4a | 4% (8/190) | 4 | 4 | |
| T4b | 14% (26/190) | 14 | 12 | |
Immunohistochemistry
Immunohistochemistry was performed on formalin fixed, paraffin embedded tissues using rabbit anti-human phosphorylated (Serine 28) histone H3 (PHH3, Abcam, Cambridge, MA, USA) and mouse anti-human mitotic protein monoclonal 2 (MPM-2, Millipore, Billerica, MA, USA). Sections were deparaffinized in xylene (3 changes), rehydrated through graded alcohols (3 changes 100% ethanol, 3 changes 95% ethanol) and rinsed in distilled water. Heat-induced epitope retrieval was performed in 10mM citrate buffer pH 6.0 for 20 minutes in a 1200-Watt microwave oven at 100% power. Sections were allowed to cool for 30 minutes and then rinsed in distilled water. Antibody incubations and detection were carried out at 37°C on a NEXes instrument (Ventana Medical Systems, Tucson, AZ, USA) using Ventana’s reagent buffer and detection kits unless otherwise noted. PHH3 was diluted 1:60 and MPM-2 1:600 in PBS, and allowed to incubate overnight at room temperature. Primary antibodies were detected with Ventana’s biotinylated goat anti-mouse or goat anti-rabbit followed by streptavidin-alkaline phosphatase conjugate. The complex was visualized with Naphthol-AS-MX phosphatase and Fast Red complex (Ventana Medical Systems, Tucson, AZ, USA). Slides were washed in distilled water, counterstained with hematoxylin, dehydrated and mounted with permanent media. Appropriate positive and negative controls were included with the study sections.
Mitotic rate calculation
We compared the primary tumor mitotic rate calculation obtained by conventional light microscopic assessment vs. computer-assisted image analysis (Aperio, Vista, CA, USA). Light microscopic assessment was performed on H&E-stained tissue sections and on corresponding sections stained with anti-MPM-2 and anti-PHH3 immunostains. Aperio detection algorithms are optimized for use with immunolabeled cells, therefore computer-assisted analysis of mitotic rate was performed on antibody-stained sections only.
Conventional mitotic rate was calculated simultaneously by two pathologists (FD and CSH) with different levels of experience (7 years practicing and 4 years in-training, respectively). 5µm-thick tissue sections were stained with H&E, anti-MPM-2, or anti-PHH3. In accordance with current AJCC recommendations, the area of tumor with greatest mitotic activity was identified (the “hotspot”).(6) After counting the number of mitotic figures in this field, the count was extended to adjacent fields until an area of 1 mm2 was assessed. Each microscope used was calibrated to determine the number of 40X fields equivalent to 1.0 mm2.
Computer-assisted analysis was performed on immunohistochemically stained-slides digitally scanned at 20X using a ScanScope digital pathology system (Aperio, Vista, CA, USA). The digital slides were visualized using the ImageScope viewer (Aperio). For each digital slide, the area of tumor with the greatest mitotic activity was manually identified. Using the cursor, a region of interest surrounding the hotspot was outlined, with exclusion of non-tumoral areas. This region of interest was progressively enlarged until at least 1.0 mm2 of tumor was outlined. On digital slides with less than 1.0 mm2 of total tumor area, the entire area of the tumor was selected. The Aperio nuclear quantification algorithm was then executed to calculate the number of immunolabeled cells within the region of interest. Default settings for the nuclear analysis algorithm (Aperio “Nuclear v9”) were used. Optical density settings for Fast Red chromogen were provided by the algorithm manufacturer. The algorithm reported positive cell counts, stratified by intensity of staining (weak, intermediate, strong). Strongly staining cells with appropriate morphology were considered positive (Figure 1). For sections containing less than 1.0 mm2 of tumor, the computer-assisted mitotic rate was recorded as the absolute number of positive cells. For digital slides with tumor area exceeding 1.0 mm2, the mitotic rate was recorded as the number of positive cells/1.0 mm2.
Figure 1. Examples of computer-assisted image analysis.

a) A PHH3 immunostain is depicted after selecting an area for analysis. b) The same PHH3 immunostain after analysis and generation of a mark-up image showing positive PHH3 labeling as red and nonspecific staining as orange or yellow. c) An MPM-2 immunostain after selecting an area for analysis. d) The same MPM-2 immunostain after analysis and generation of mark-up image showing positive MPM-2 labeling as red and nonspecific staining as orange or yellow. Note in d) the less specific labeling of mitotic figures with MPM-2 relative to PHH3.
Statistical methods
Descriptive statistics were used to summarize patient characteristics. The association between conventional light microscopic evaluation and computer-assisted PHH-3 and MPM-2 analysis was measured using the Pearson correlation coefficient. The association between progression-free survival and mitotic rate (either visually assessed or computer-generated) was evaluated using the Cox regression model. Kaplan-Meier curves and log rank tests were used to assess differential survival profiles of risk groups. Statistical significance of tests was claimed when P values were less than 0.05. Statistical analyses were conducted using SAS (version 9.2) and the statistical software R.
RESULTS
One hundred ninety patients (72 female, 118 male) were included in the study (Table 1). The cases were distributed across AJCC stages IA–IIC (IA: N=12, IB: N=72, IIA: N=52, IIB: N=28, and IIC: N=26). The median progression-free survival was 40 months (3.3 years). Median follow-up was 56 months (4.7 years) for the whole cohort and 66.5 months (5.5 years) for survivors. The distribution of 2009 AJCC T stages was as follows: T1a 6% (12/190), T1b 5% (10/190), T2a 33% (62/190), T2b 12% (22/190), T3a 16% (30/190), T3b 11% (20/190), T4a 4% (8/190), and T4b 14% (26/190). Average Breslow thickness was 3.02 mm (range 0.4 mm to 30 mm). Multiple primary lesions were present in 5% (10/190) of patients in the cohort. Of these, the thickest primary was selected as the index primary in 8/10 cases. The invasive primary lesion was selected as the index lesion for the remaining 2/10 patients, each of whom presented with a solitary invasive lesion and multiple lesions of melanoma in situ.
Since patients were selected for recurrence, the majority of primary tumor cases selected (168/190) (88%) were >1 mm in thickness. Thin melanomas had a low rate of recurrence such that they only comprised a minority of the cases in this study (22/190) (12%). Selection was also reflected in the ratio of histologic subtypes: 113/190 (59%) were of the nodular melanoma subtype and 70/190 (37%) were of the superficial spreading melanoma subtype. Thicker melanomas had a higher rate of recurrence and were mostly of the nodular melanoma subtype, consistent with the aggressive biology of nodular melanoma.(22) Due to selection of equal numbers of recurring and non-recurring cases in each category, the clinicopathological variables analyzed (age at initial melanoma diagnosis, gender, primary tumor thickness, ulceration, presence or absence of mitosis, histologic type, and site) were not significantly associated with recurrence on Fisher’s exact test (Table 1). A separate Chi-squared analysis, however, confirmed that the presence of either ulceration or thickness > 4 mm showed the expected significant association with increased mitotic rate by conventional H&E, computer-assisted PHH3, and manual PHH3 methods (Table 2).
Table 2.
Primary tumor mitotic rates calculated by three different methods are significantly associated with thickness and ulceration.
| Digitally calculated PHH3 mitotic rate (mitoses/mm2) |
Visually calculated PHH3 mitotic rate (mitoses/mm2) |
Conventional (H&E) mitotic rate (mitoses/mm2) |
|||||||
|---|---|---|---|---|---|---|---|---|---|
| Variable | N | Median | P value | N | Median | P value | N | Median | P value |
| Primary tumor thickness (mm) | |||||||||
| ≤4.00 | 143 | 5.8 | 0.09 | 147 | 3 | 0.0005 | 152 | 1 | <0.0001 |
| >4.00 | 31 | 9.4 | 32 | 9 | 31 | 5 | |||
| Primary tumor ulceration | |||||||||
| Absent | 110 | 3.4 | 0.0055 | 114 | 2 | <0.0001 | 115 | 1 | <0.0001 |
| Present | 64 | 9 | 65 | 7 | 68 | 3 | |||
Of the 380 immunohistochemically stained-sections, 46/190 (24%) MPM-2 and 18/190 (9%) PHH3-stained sections exhibited less than optimal staining, as defined by the following criteria: 1) MPM-2 and/or PHH3 labeling in non-basal keratinocytes, 2) sections with heavy background melanin pigment. These sections were excluded from statistical analysis. In 11/190 (6%) cases, residual tumor was absent from both of the deeper sections used for immunostaining. These cases were also excluded from statistical analysis. Compared to the corresponding H&E-stained sections, both antibodies led to higher manual mitotic counts by conventional light microscopy and computer-assisted analysis (Figure 2). Although absolute mitotic counts by computer-analysis were higher, mitotic rate by computer-assisted analysis of PHH3 and MPM-2 very significantly correlated with manual mitotic rate by light microscopic evaluation of PHH3 and MPM-2 (+0.501 for MPM-2, P<0.0001; +0.587 for PHH3, P<0.0001). Both PHH3 and MPM-2 facilitated rapid localization of the mitotic “hotspot”.
Figure 2. Mean mitotic counts by each method.
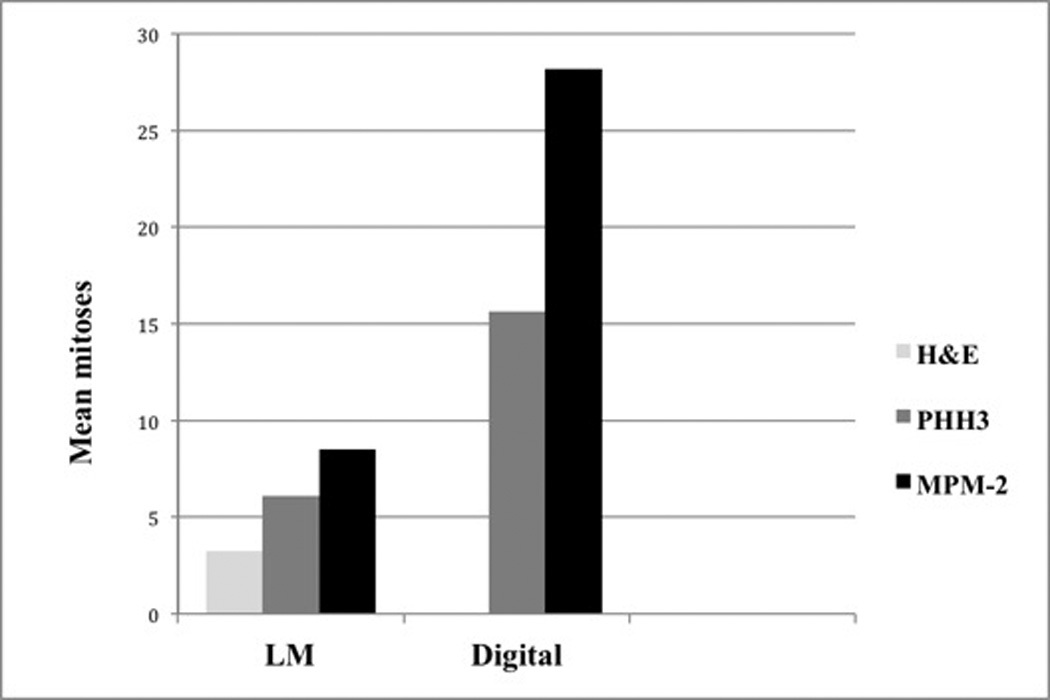
Manual light microscopy (LM) of H&E, PHH3, and MPM-2 vs. computer-assisted analysis (digital) of corresponding scanned PHH3 and MPM-2 immunostains.
Mitotic Rate and Progression-Free Survival
Univariate Cox analysis of all cases showed a significant correlation between progression-free survival and mitotic rate by traditional H&E, manual PHH3, and computer-assisted PHH3 methods (P=0.004, 0.04 and 0.02, respectively). Separating the cohort into cases ≤1.0 mm thick and cases >1.0 mm thick, found no significant correlation between mitotic rate and progression-free survival in the thinner cases by univariate Cox analysis. In thicker melanomas (>1.00 mm), univariate Cox analysis found significant correlation between increased mitotic rate and decreased progression-free survival by H&E and by computer-assisted PHH3 methods (P=0.01, and 0.04, respectively). Relative to the subset of melanomas >1.0 mm, there was a trend toward better progression-free survival when melanomas of all thicknesses were considered together, both by univariate and multivariate analysis.
Multivariate Cox analysis of all cases (including age at initial melanoma diagnosis, primary tumor thickness, ulceration status, mitotic rate, anatomic site) found that only H&E mitotic rate was significant for progression-free survival (P= 0.02). Multivariate Cox analysis of melanomas >1.00 mm found only H&E mitotic rate to be significant (P= 0.035).
Kaplan-Meier analysis of manual mitotic rates showed that high mitotic rate, whether by H&E or by PHH3 (Figures 3 and 4) was significantly associated with decreased estimated 5-year progression-free survival in thicker melanomas (>1.00 mm). As a group, those cases with manual H&E mitotic rates above the median (2 mitoses/mm2) had significantly worse 5-year progression-free survival compared to those with manual H&E mitotic rate below the median (P=0.0002). Similarly, cases with manual PHH3 mitotic rate above the median (4 mitoses/mm2) had significantly worse 5-year progression-free survival compared to those with manual PHH3 mitotic rates below the median (P=0.020). No significant correlation between progression free survival and MPM-2 mitotic rate was seen by manual or computer-assisted methods.
Figure 3. Conventional mitotic rate and five-year progression-free survival.
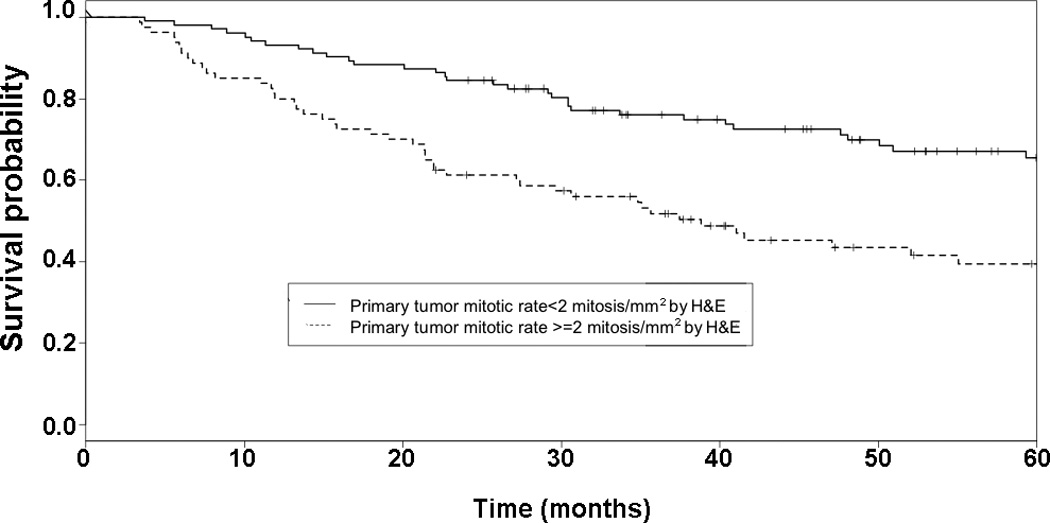
Kaplan-Meier curve and log rank test on five-year recurrence in all melanomas. Group 1 includes those melanomas with mitotic rate less than the median value for H&E staining (2 mitoses/mm2). Group 2 includes those melanomas with mitotic rate no less than the median value for H&E staining. A significant difference in the five-year estimated progression-free survival function is seen between cases with lower and higher H&E mitotic rate (0.654 and 0.372, respectively, P=0.00009).
Figure 4. Visually-calculated PHH3 mitotic rate and progression-free survival.
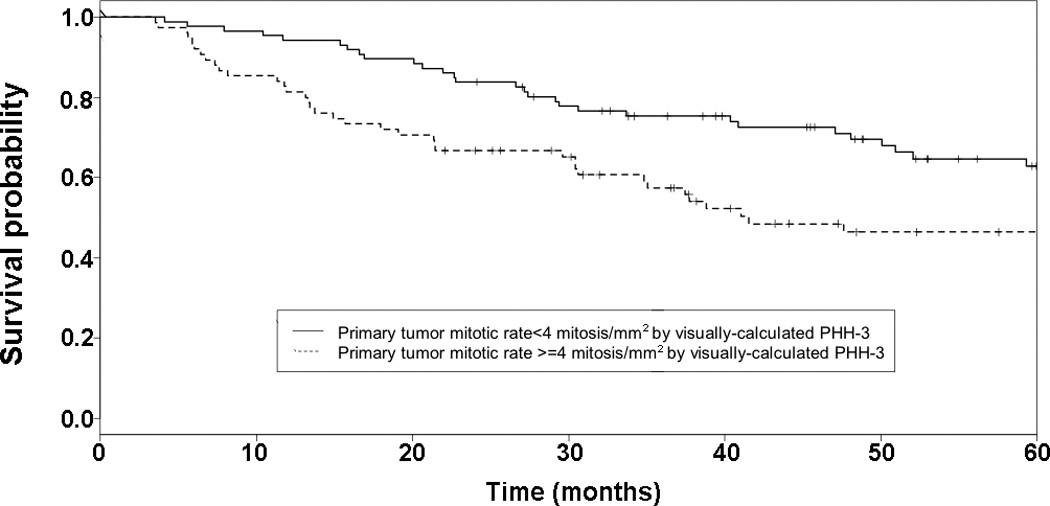
Kaplan-Meier curve and log rank test on recurrence in all melanomas. Group 1 includes those melanomas with mitotic rate less than the median value for PHH3 labeling (4 mitoses/mm2). Group 2 includes those melanomas with mitotic rate no less than the median value for PHH3 labeling. A significant difference is seen in the five-year estimated progression-free survival function seen between cases with lower and higher PHH3 labeling (0.608 and 0.464, respectively, P=0.013).
Mitotic Rate and Melanoma-Specific Survival
Univariate Cox analysis of all cases showed a significant correlation between melanoma-specific survival and mitotic rate by H&E only (P=0.02). Multivariate Cox analysis found that none of the mitotic rate detection methods (manual or computer-assisted image analysis, H&E or immunostain) significantly correlated with melanoma-specific survival. Similar to progression-free survival, there was a trend toward better melanoma-specific survival relative to the subset of melanomas >1.0 mm when melanomas of all thickness were considered together, both by univariate and multivariate analysis.
DISCUSSION
Computer-assisted image analysis has existed in some form since as early as 1987, but software for analysis of histologic features has only recently become available.(23, 24) In this study, we tested whether the use of two mitosis-specific antibodies could “flag” mitotically active cells such that immunopositivity could be detected using commercially available computer image analysis software. In cutaneous melanoma, this is the first time conventional light microscopy has been compared with computer-assisted analysis for detection of immunolabeled mitoses. Data from the breast carcinoma literature suggest that both manual and computer-assisted quantification of H&E and PHH3 immunostained mitoses correlate well, but comparable data for melanoma has not been published.(25, 26) The previous study of computer-assisted detection of PHH3 labeled mitoses in breast carcinoma relied on immunofluorescence and confocal microscopy.(25) We avoided these methods in favor of routine immunohistochemical stains, easily performed in most diagnostic laboratories. The use of immunohistochemistry instead of immunofluorescence also permitted evaluation of immunolabeled mitotic figures with consideration to the size and location of the targeted cells. Tumor areas were easily distinguishable by this method, allowing us to restrict computer-assisted and manual analysis of PHH-3 stained mitotic cells to tumoral tissue.
The majority of the cases in the study (88%; 168/190) were intermediate or thick primaries. Surprisingly, 25% (49/190) of the cases had an H&E mitotic rate of <1/mm2. Although the number of cases with mitotic rate <1/mm2 is relatively high, we note that mitosis was scored as mitotic rate per 10 high-power fields prior to the 2009 new staging system. In the process of re-reviewing all of the cases in the cohort again to comply with the new staging definition (mitosis/mm2), the mitotic rate reduced substantially. While this might not fully explain the relative high frequency of low mitotic rate in our cohort general, the second review of all the cases gives us confidence in the accuracy of the H&E mitotic rate counts.
Technical aspects of immunostaining are likely to limit the use of PHH3 and MPM-2 in routine practice. Despite optimization of our staining protocols in pre-study pilots, a percentage of cases continued to have unsatisfactory staining with both antibodies. Endogenous alkaline phosphatases are a known cause of unsatisfactory staining with the Fast Red chromogen; however, our commercial kit included levamisol as an inhibitor of endogenous alkaline phosphatase. We do not have data on time to formalin fixation for the tissues in our study, and cannot exclude the effects of variable fixation on the performance of PHH3 and MPM-2 stains. It is also possible that some of the unsatisfactory staining we observed may be due to factors intrinsic to the specimens themselves. No observable correlation was seen between unsatisfactorily stained cases and particular staining runs or instruments.
The cost of performing the immunostains, in terms of time and money, is another limitation to clinical use of mitosis-specific antibodies. Although there was a subjective decrease in the time needed to calculate the mitotic rate from immunostained sections, this observation does not take into account that the pathologist, when assessing the H&E stained slides for mitotic rate in routine practice, will have had to evaluate the H&E slide(s) in order to diagnose and report the melanoma. When the pathologist begins mitotic rate calculation, they are not beginning “from scratch” to determine the mitotic rate. This may lead to an overestimation of the time it takes to determine mitotic rate on H&E slides. Since an H&E stained slide must be generated regardless of whether immunostaining is used, the benefit of immunostaining does not seem to justify the additional time, labor, and materials.
Univariate analysis of PHH3 found significant correlation between increased PHH3 mitotic rate and decreased progression-free survival (P=0.04). Computer-assisted image analysis enhanced the correlation of PHH3 mitotic rate with progression-free survival (P=0.04 to P=0.02). Regardless of detection method, neither MPM-2 nor PHH3 offered significant advantage over conventional H&E determination of mitotic rate. Considered separately, however, we did find additional benefits to use of PHH3 and computer-assisted image analysis.
In our opinion, PHH3 immunostaining also allows more objective determination of mitotic count since apoptotic cell debris is more easily distinguished from mitoses. This objectivity is reflected in the enhanced interobserver agreement that has been reported with PHH3 staining in thin cutaneous melanoma(20) and uveal melanoma.(27) Moreover, PHH3 staining permits recognition of mitotic cells that lack the easily recognizable morphology of metaphase or anaphase. Our data showed that, relative to H&E, manual quantification of PHH3 increased average mitotic rate by 86%. This is concordant with previous reports that PHH3 increases mitotic counts by approximately 200%.(20, 27–31) In our study, PHH3 mitotic rates were more similar to H&E than MPM-2 mitotic rates. The clinical relevance of these increased mitotic counts reported using MPM-2 and PHH3 immunohistochemical stains is unknown, but AJCC 2009 mitotic rate cut-offs would not apply to mitotic rate determined from immunostains, either with or without computer-assisted image analysis. Indeed, mitotic figures are identifiable even in nevi when immunohistochemical detection is used.(30)
PHH3 staining was mostly restricted to cells in mitosis, although staining was seen in some cells in interphase (particularly melanophages). Macrophage staining has been described in studies of PHH3 in breast carcinoma and in melanocytic lesions.(16, 25) In anticipation of this confounding factor, we designed our study to use the red chromogen Fast Red, rather than diaminobenzidine (DAB), a common brown chromogen. Since the Aperio software was optimized with diaminobenzidine as the default chromogen, this required replacement of default optical density values with those provided for Fast Red. Future studies might assess the utility of melanin bleaching methods combined with immunolabeling, but these techniques are time-consuming and appear to have variable effects on antibody labeling.(32) Despite use of Fast Red as an alternative chromogen, some nonspecific background staining of melanin and debris persisted. This high background was more pronounced with MPM-2, but was also present in some PHH3-labeled sections. Ikenberg and colleagues recently reported improved PHH3 specificity by dual immunostaining with Melan-A/PHH-3 to avoid counting non-melanocytic cells in mitosis.(33) Dual immunostaining with a melanoma-specific antibody such as Melan-A could have improved the specificity of our results. However, the nuclear analysis algorithm (Aperio “Nuclear v9”) used for the computer-assisted image analysis component of the study was not capable of detecting multiple chromogens.
Previously, Ladstein et al reported no significant correlation between manual quantification of PHH3 staining and clinical outcome in melanoma.(29) Our study differed in our use of the (Ser28) variant of the PHH3 antibody, whereas Ladstein et al employed the (Ser10) variant of PHH3. Published results with both variants (clones) appear similar, but no study has evaluated differences between the two. Another difference was our evaluation of PHH3 on whole slide images, in comparison to the tissue microarrays used by the previous study.(29) Although tissue microarrays permit evaluation of immunostaining on a large number of samples, it is impossible to definitively locate the mitotic hotspot. Since mitotic activity may vary significantly throughout a tumor, it is also not possible to know whether the area of tumor selected for creation of the tissue microarray core reflects the area of maximum proliferative activity. A study of nevi by Glatz et al found that PHH3 staining in the upper half of the dermis to be three times that in the lower half of the dermis.(30) It is reasonable that melanoma could show similar spatial heterogeneity in mitotic activity as well, complicating immunohistochemical studies of tissue microarrays.(13) As this manuscript was being prepared, Ladstein et al reported in a follow-up study that PHH-3 did correlate with better survival in nodular melanoma when studied on whole tissue sections.(34) Our use of computer-assisted image analysis is a novel addition to these and other PHH-3 data.
The Aperio ScanScope digital image viewer used in this study was useful even without the companion image-analysis software. In discussing mitotic rate, it is often overlooked that the precise measurement of an area equal to 1 mm2 is as equally important as the precise detection of mitotic figures. Calculation of mitotic rate by conventional light microscopy requires that the area of each high power field be calibrated for the individual microscope used.(6, 35) The Aperio digital image viewer enabled precise area measurements without microscope calibration and permitted precise measurements of irregularly shaped areas of interest that include the tumor and exclude non-contributory intervening stroma. The influence of tissue cellularity on mitotic rate calculation was also reduced since selection of an area of “pure” tumor for mitotic rate calculation could be achieved on-screen with a selection tool more easily than with the rigid circular high power field of a microscope. In tumors with moderate mitotic activity but low cellularity, this could mitigate the confounding effect of overall tumor cellularity.(11) Another consideration in use of the Aperio computer-assisted image analysis software was the use of the nuclear analysis algorithm to detect immunolabeled mitotically active cells. Since there is no nuclear envelope present during much of the M phase, staining is neither nuclear nor cytoplasmic. The nuclear algorithm software is designed to detect nuclei based on features such as size, shape, border sharpness, and contour.
Our study is the second study of MPM-2 in melanoma since the antibody was described in 1983(36). MPM-2 appears more sensitive for detection of mitotic figures than both PHH3 and H&E, with a 159% increase in average manual mitotic count relative to H&E. The previous study of MPM-2 in melanoma reported a 48% increase in mitotic rate.(16) The high sensitivity and lower specificity of MPM-2 may be due to the fact that monoclonal antibodies against MPM-2 recognize more than fifty phosphoepitopes, including microtubule-associated proteins, components of the anaphase-promoting complex, phosphatases, and protein kinases including protein kinase CK2.(18) Unlike PHH3, MPM-2 did not correlate with outcomes in melanoma when used as a surrogate for traditional mitotic rate, regardless of detection method.
Similar to previous studies, we find that mitosis detected by H&E significantly correlates with the likelihood of recurrence on multivariate analysis.(4, 5, 7–9) Mitotic rate by H&E may in fact carry more prognostic information than the presence or absence of ulceration, although the two are closely linked.(4, 7) Extracting the prognostic significance of mitotic rate may require a more complex approach than the current binary cut-off included in AJCC guidelines and will certainly require standardization. Although it seems that location of the “hotspot” was improved by immunostaining with either PHH3 or MPM-2, the prognostic value of mitotic rate is founded on studies of H&E slide assessment. Whether the ease of locating the “hotspot” by immunohistochemistry has any significant relevance to prognosis in melanoma will require further study.
Challenges to standard reporting of mitotic rate include the time needed to accurately calculate field diameter, the time needed to locate the mitoses themselves, and interobserver variability. Our experience suggests that digital slide viewing software will facilitate faster and more accurate area calculation than microscopy alone. Neither of the antibodies in our study is sufficiently specific to merit routine clinical use. We do recommend that conventional mitotic rate based on H&E be included in diagnostic reports, since it continues to correlate strongly with clinical outcomes such as progression-free survival.
Acknowledgments
CONFLICTS OF INTEREST AND SOURCE OF FUNDING:
The authors have no conflicts of interest to disclose and gratefully acknowledge support from the NYU Clinical and Translational Science Institute (funded in part by 1 UL1 RR029893 from the National Center for Research Resources of the NIH), the NYU Cancer Institute Cancer Center Support Grant (NIH/NCI 5 P30 CA016087), and the Marc Jacobs Campaign to support the Interdisciplinary Melanoma Cooperative Group.
Footnotes
Publisher's Disclaimer: This is a PDF file of an unedited manuscript that has been accepted for publication. As a service to our customers we are providing this early version of the manuscript. The manuscript will undergo copyediting, typesetting, and review of the resulting proof before it is published in its final citable form. Please note that during the production process errors may be discovered which could affect the content, and all legal disclaimers that apply to the journal pertain.
REFERENCES
- 1.Badalamenti G, Rodolico V, Fulfaro F, et al. Gastrointestinal stromal tumors (GISTs): focus on histopathological diagnosis and biomolecular features. Ann Oncol. 2007;18(Suppl 6):vi136–vi140. doi: 10.1093/annonc/mdm243. [DOI] [PubMed] [Google Scholar]
- 2.Baak JP, van Diest PJ, Voorhorst FJ, et al. Prospective multicenter validation of the independent prognostic value of the mitotic activity index in lymph node-negative breast cancer patients younger than 55 years. J Clin Oncol. 2005;23(25):5993–6001. doi: 10.1200/JCO.2005.05.511. [DOI] [PubMed] [Google Scholar]
- 3.Layfield LJ, Liu K, Dodge R, Barsky SH. Uterine smooth muscle tumors: utility of classification by proliferation, ploidy, and prognostic markers versus traditional histopathology. Arch Pathol Lab Med. 2000;124(2):221–227. doi: 10.5858/2000-124-0221-USMT. [DOI] [PubMed] [Google Scholar]
- 4.Azzola MF, Shaw HM, Thompson JF, et al. Tumor mitotic rate is a more powerful prognostic indicator than ulceration in patients with primary cutaneous melanoma: an analysis of 3661 patients from a single center. Cancer. 2003;97(6):1488–1498. doi: 10.1002/cncr.11196. [DOI] [PubMed] [Google Scholar]
- 5.Thompson JF, Soong SJ, Balch CM, et al. Prognostic significance of mitotic rate in localized primary cutaneous melanoma: an analysis of patients in the multi-institutional American Joint Committee on Cancer melanoma staging database. J Clin Oncol. 2011;29(16):2199–2205. doi: 10.1200/JCO.2010.31.5812. [DOI] [PMC free article] [PubMed] [Google Scholar]
- 6.Balch CM, Gershenwald JE, Soong SJ, et al. Final version of 2009 AJCC melanoma staging and classification. J Clin Oncol. 2009;27(36):6199–6206. doi: 10.1200/JCO.2009.23.4799. [DOI] [PMC free article] [PubMed] [Google Scholar]
- 7.Barnhill RL, Katzen J, Spatz A, Fine J, Berwick M. The importance of mitotic rate as a prognostic factor for localized cutaneous melanoma. J Cutan Pathol. 2005;32(4):268–273. doi: 10.1111/j.0303-6987.2005.00310.x. [DOI] [PubMed] [Google Scholar]
- 8.Francken AB, Shaw HM, Thompson JF, et al. The prognostic importance of tumor mitotic rate confirmed in 1317 patients with primary cutaneous melanoma and long follow-up. Ann Surg Oncol. 2004;11(4):426–433. doi: 10.1245/ASO.2004.07.014. [DOI] [PubMed] [Google Scholar]
- 9.Clark WH, Jr, Elder DE, Guerry Dt, et al. Model predicting survival in stage I melanoma based on tumor progression. J Natl Cancer Inst. 1989;81(24):1893–1904. doi: 10.1093/jnci/81.24.1893. [DOI] [PubMed] [Google Scholar]
- 10.Lende TH, Janssen EA, Gudlaugsson E, et al. In patients younger than age 55 years with lymph node-negative breast cancer, proliferation by mitotic activity index is prognostically superior to adjuvant! J Clin Oncol. 2011;29(7):852–858. doi: 10.1200/JCO.2009.25.0407. [DOI] [PubMed] [Google Scholar]
- 11.Thunnissen FB, Ambergen AW, Koss M, et al. Mitotic counting in surgical pathology: sampling bias, heterogeneity and statistical uncertainty. Histopathology. 2001;39(1):1–8. doi: 10.1046/j.1365-2559.2001.01187.x. [DOI] [PubMed] [Google Scholar]
- 12.Attis MG, Vollmer RT. Mitotic rate in melanoma: a reexamination. Am J Clin Pathol. 2007;127(3):380–384. doi: 10.1309/LB7RTC61B7LC6HJ6. [DOI] [PubMed] [Google Scholar]
- 13.Ramsay JA, From L, Iscoe NA, Kahn HJ. MIB-1 proliferative activity is a significant prognostic factor in primary thick cutaneous melanomas. J Invest Dermatol. 1995;105(1):22–26. doi: 10.1111/1523-1747.ep12312431. [DOI] [PubMed] [Google Scholar]
- 14.Gimotty PA, Van Belle P, Elder DE, et al. Biologic and prognostic significance of dermal Ki67 expression, mitoses, and tumorigenicity in thin invasive cutaneous melanoma. J Clin Oncol. 2005;23(31):8048–8056. doi: 10.1200/JCO.2005.02.0735. [DOI] [PubMed] [Google Scholar]
- 15.Hazan C, Melzer K, Panageas KS, et al. Evaluation of the proliferation marker MIB-1 in the prognosis of cutaneous malignant melanoma. Cancer. 2002;95(3):634–640. doi: 10.1002/cncr.10685. [DOI] [PubMed] [Google Scholar]
- 16.Tapia C, Kutzner H, Mentzel T, et al. Two mitosis-specific antibodies, MPM-2 and phospho-histone H3 (Ser28), allow rapid and precise determination of mitotic activity. Am J Surg Pathol. 2006;30(1):83–89. doi: 10.1097/01.pas.0000183572.94140.43. [DOI] [PubMed] [Google Scholar]
- 17.Escargueil AE, Larsen AK. Mitosis-specific MPM-2 phosphorylation of DNA topoisomerase IIalpha is regulated directly by protein phosphatase 2A. Biochem J. 2007;403(2):235–242. doi: 10.1042/BJ20061460. [DOI] [PMC free article] [PubMed] [Google Scholar]
- 18.Escargueil AE, Plisov SY, Filhol O, Cochet C, Larsen AK. Mitotic phosphorylation of DNA topoisomerase II alpha by protein kinase CK2 creates the MPM-2 phosphoepitope on Ser-1469. J Biol Chem. 2000;275(44):34710–34718. doi: 10.1074/jbc.M005179200. [DOI] [PubMed] [Google Scholar]
- 19.Goto H, Tomono Y, Ajiro K, et al. Identification of a novel phosphorylation site on histone H3 coupled with mitotic chromosome condensation. J Biol Chem. 1999;274(36):25543–25549. doi: 10.1074/jbc.274.36.25543. [DOI] [PubMed] [Google Scholar]
- 20.Schimming TT, Grabellus F, Roner M, et al. pHH3 Immunostaining Improves Interobserver Agreement of Mitotic Index in Thin Melanomas. Am J Dermatopathol. 2011 doi: 10.1097/DAD.0b013e31823135a3. [DOI] [PubMed] [Google Scholar]
- 21.Wich LG, Hamilton HK, Shapiro RL, et al. Developing a multidisciplinary prospective melanoma biospecimen repository to advance translational research. Am J Transl Res. 2009;1(1):35–43. [PMC free article] [PubMed] [Google Scholar]
- 22.Greenwald HS, Friedman EB, Osman I. Superficial spreading and nodular melanoma are distinct biological entities: a challenge to the linear progression model. Melanoma Res. 2012;22(1):1–8. doi: 10.1097/CMR.0b013e32834e6aa0. [DOI] [PMC free article] [PubMed] [Google Scholar]
- 23.Cascinelli N, Ferrario M, Tonelli T, Leo E. A possible new tool for clinical diagnosis of melanoma: the computer. J Am Acad Dermatol. 1987;16(2 Pt 1):361–367. doi: 10.1016/s0190-9622(87)70050-4. [DOI] [PubMed] [Google Scholar]
- 24.Soenksen D. Advances in digital pathology drive continued momentum and globalization. MLO Med Lab Obs. 2009;41(3):31. [PubMed] [Google Scholar]
- 25.Bossard C, Jarry A, Colombeix C, et al. Phosphohistone H3 labelling for histoprognostic grading of breast adenocarcinomas and computer-assisted determination of mitotic index. J Clin Pathol. 2006;59(7):706–710. doi: 10.1136/jcp.2005.030452. [DOI] [PMC free article] [PubMed] [Google Scholar]
- 26.Malon C, Brachtel E, Cosatto E, et al. Mitotic figure recognition: Agreement among pathologists and computerized detector. Anal Cell Pathol (Amst) 2011 doi: 10.3233/ACP-2011-0029. [DOI] [PMC free article] [PubMed] [Google Scholar]
- 27.Angi M, Damato B, Kalirai H, et al. Immunohistochemical assessment of mitotic count in uveal melanoma. Acta Ophthalmol. 2011;89(2):e155–e160. doi: 10.1111/j.1755-3768.2009.01769.x. [DOI] [PubMed] [Google Scholar]
- 28.Casper DJ, Ross KI, Messina JL, et al. Use of anti-phosphohistone H3 immunohistochemistry to determine mitotic rate in thin melanoma. Am J Dermatopathol. 2010;32(7):650–654. doi: 10.1097/DAD.0b013e3181cf7cc1. [DOI] [PubMed] [Google Scholar]
- 29.Ladstein RG, Bachmann IM, Straume O, Akslen LA. Ki-67 expression is superior to mitotic count and novel proliferation markers PHH3, MCM4 and mitosin as a prognostic factor in thick cutaneous melanoma. BMC Cancer. 2010;10:140. doi: 10.1186/1471-2407-10-140. [DOI] [PMC free article] [PubMed] [Google Scholar]
- 30.Glatz K, Hartmann C, Antic M, Kutzner H. Frequent mitotic activity in banal melanocytic nevi uncovered by immunohistochemical analysis. Am J Dermatopathol. 2010;32(7):643–649. doi: 10.1097/DAD.0b013e3181d7ce6f. [DOI] [PubMed] [Google Scholar]
- 31.Nasr MR, El-Zammar O. Comparison of pHH3, Ki-67, and survivin immunoreactivity in benign and malignant melanocytic lesions. Am J Dermatopathol. 2008;30(2):117–122. doi: 10.1097/DAD.0b013e3181624054. [DOI] [PubMed] [Google Scholar]
- 32.Orchard GE, Calonje E. The effect of melanin bleaching on immunohistochemical staining in heavily pigmented melanocytic neoplasms. Am J Dermatopathol. 1998;20(4):357–361. doi: 10.1097/00000372-199808000-00006. [DOI] [PubMed] [Google Scholar]
- 33.Ikenberg K, Pfaltz M, Rakozy C, Kempf W. Immunohistochemical dual staining as an adjunct in assessment of mitotic activity in melanoma. J Cutan Pathol. 2012;39(3):324–330. doi: 10.1111/j.1600-0560.2011.01858.x. [DOI] [PubMed] [Google Scholar]
- 34.Ladstein RG, Bachmann IM, Straume O, Akslen LA. Prognostic Importance of the Mitotic Marker Phosphohistone H3 in Cutaneous Nodular Melanoma. J Invest Dermatol. 2012 doi: 10.1038/jid.2011.464. [DOI] [PubMed] [Google Scholar]
- 35.Roach BA, Burton AL, Mays MP, et al. Does mitotic rate predict sentinel lymph node metastasis or survival in patients with intermediate and thick melanoma? Am J Surg. 2010;200(6):759–763. doi: 10.1016/j.amjsurg.2010.07.037. discussion 63–4. [DOI] [PubMed] [Google Scholar]
- 36.Davis FM, Tsao TY, Fowler SK, Rao PN. Monoclonal antibodies to mitotic cells. Proc Natl Acad Sci U S A. 1983;80(10):2926–2930. doi: 10.1073/pnas.80.10.2926. [DOI] [PMC free article] [PubMed] [Google Scholar]