Summary
Resistance to antimalarials targeting the folate pathway is widespread. GTP-cyclohydrolase (gch1), the first enzyme in this pathway, exhibits extensive copy number variation (CNV) in parasite isolates from areas with a history of longstanding antifolate use. Increased CN of gch1 is associated with a greater number of point mutations in enzymes targeted by the antifolates, pyrimethamine and sulfadoxine. While these observations suggest that increases in gch1 CN are an adaptation to drug pressure, changes in CN have not been experimentally demonstrated to directly alter drug susceptibility. To determine if changes in gch1 expression alone modify pyrimethamine sensitivity, we manipulated gch1 CN in several parasite lines to test the effect on drug sensitivity. We report that increases in gch1 CN alter pyrimethamine resistance in most parasites lines. However we find evidence of a detrimental effect of very high levels of gch1 overexpression in parasite lines with high endogenous levels of gch1 expression, revealing the importance of maintaining balance in the folate pathway and implicating changes in gch1 expression in preserving proper metabolic flux. This work expands our understanding of parasite adaptation to drug pressure and provides a possible mechanism for how specific mutations become fixed within parasite populations.
Keywords: malaria, drug resistance, dhfr, Plasmodium falciparum, Folate, Copy Number Variation
Introduction
The rapid emergence of resistance to antimicrobials poses an increasingly difficult problem for the treatment of all infectious diseases. In the case of malaria, the spread of chloroquine resistance led to a dramatic increase in malaria related morbidity and mortality, and the subsequent widespread use of alternative antimalarial compounds such as the antifolate compounds, pyrimethamine and sulfadoxine (Wellems, 2002; Laufer & Plowe, 2004). Increased use was followed by increased resistance rates and the subsequent discontinuation of antifolates as first line treatments for malaria (Sibley et al., 2001). Now in the face of potential resistance to artemesinin based combination therapies, studies of the development of resistance and how resistant alleles are sustained in a population are needed.
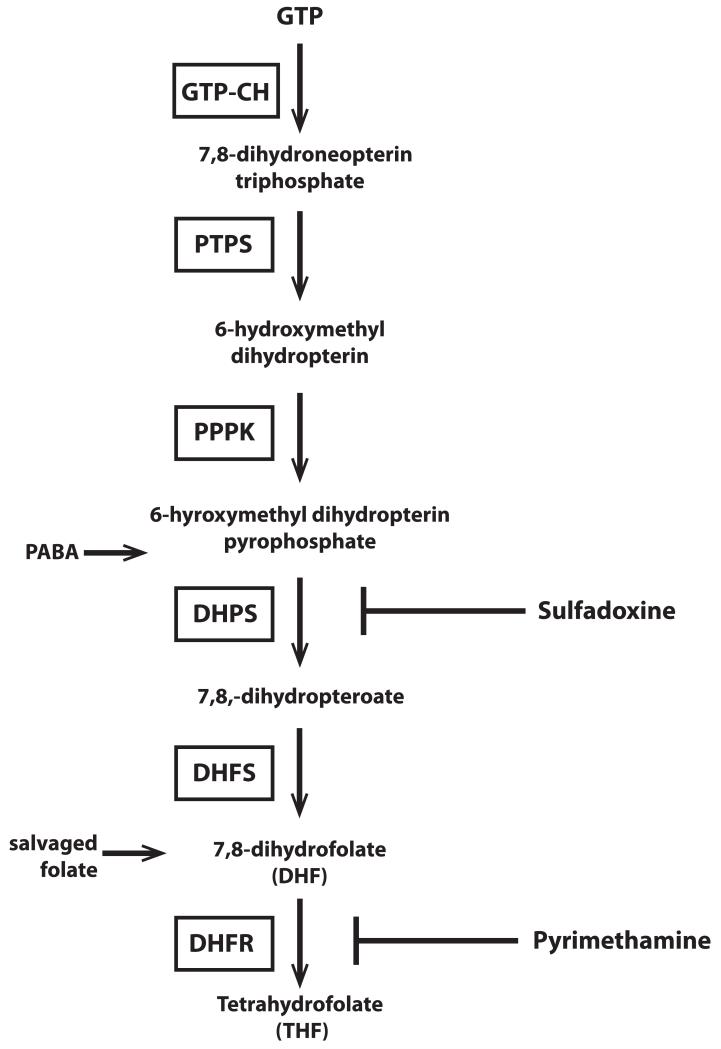
Sulfadoxine and pyrimethamine, combined as the antimalarial Fansidar, target two enzymes in the folate pathway, dihydropteroate synthase (DHPS) and dihydrofolate reductase (DHFR), and are competitive inhibitors of the enzymes’ natural substrates (7,8-dihydrofolate and PABA, shown in Fig. 1). Accumulation of point mutations within the target enzymes provides parasites with increased levels of resistance (Peterson et al., 1988; Triglia & Cowman, 1994). Many studies have documented the strong association between resistance to antifolates and point mutations in the target genes, however, the role of secondary and compensatory mechanisms that contribute to the spread and stability of resistant parasites within a population is less well understood.
Figure 1. The de novo folate biosynthesis pathway of P. falciparum.
GTP-CH is the first enzyme in the folate biosynthesis pathway and has been found to exhibit extensive copy number variation. Enzymes in the folate pathway are boxed and substrates are in plain text. Abbreviations: GTP-cyclohydrolase (GTP-CH), pyruvolytetrahydropterin synthase (PTPS), hydroxymethyldihydropterin pyrophosphokinase (PPPK), dihydropteroate synthase (DHPS), dihydrofolate synthase (DHFS), dihydrofolate reductase (DHFR). Inhibitors of folate biosynthesis are shown at the right of the pathway: sulfadoxine (SDX), pyrimethamine (PYR). para-aminobenzoic acid (PABA) enters as a substrate for DHPS. Salvaged folate can also enter the pathway upstream of DHFR.
Improved techniques that accurately assess copy number variation (CNV) have highlighted the role that gene amplification plays in the development of resistance to various antimalarials and altering invasion phenotypes (Anderson et al., 2009, Eastman et al., 2011, Triglia et al., 2005, Van Tyne et al., 2011) and CNV is now seen as a major contributor to genetic and phenotypic variation in P. falciparum (Estivill & Armengol, 2007). Multiple studies have observed CNV of GTP cyclohydrolase (gch1) (PF3D7_1224000), a gene which encodes the enzyme that catalyzes the first step in the folate biosynthesis pathway (Fig. 1) (Kidgell et al., 2006; Nair et al., 2008; Jiang et al., 2008; Ribacke et al., 2007). The relationship between gch1 CNV and resistance associated point mutations was explored in detail by comparing the parasite population genetics of two countries with contrasting histories of antifolate drug pressure (Nair et al., 2008). In Thailand, where antifolates were used as a first line treatment from 1970-1980, dhps and dhfr mutations are highly prevalent and 72% of Thai parasites were found to carry more than one copy of gch1. In contrast, in Laos where antifolates were rarely used until 2006, low frequencies of dhps and dhfr mutations were identified and almost all parasites studied (98%) carried only one copy of gch1. Additionally, parasites harboring the dhfr 164L mutation, which confers a high level of pyrimethamine resistance, had a statistically significant higher gch1 copy number than parasites carrying the wildtype dhfr 164I allele.
The stability of gch1 amplification, even with reduced drug pressure, contrasts with other amplified regions, such as P. falciparum multidrug resistance protein 1 (Pfmdr1), where an increase in copy number is disfavored due to the fitness cost associated with gene amplification (Preechapornkul et al., 2009; Nair et al., 2008). This persistence of increased gch1 CN along with the positive association of the dhfr 164L allele lends additional support to the idea that gch1 may compensate for a fixed mutation in the genome, be it the dhfr 164L mutation or some mutation at another unidentified genetic locus. While these studies linked gch1 CNV to local patterns of antifolate selection pressure and provided population-level evidence that increased gch1 CN are a result of positive selection, no study has demonstrated the direct adaptive role of gch1 CN on drug sensitivity.
It has been hypothesized that overexpression of gch1 increases the metabolic flux through the de novo folate pathway thereby compensating for mutated, less efficient DHPS and DHFR enzymes (Kidgell et al., 2006; Nair et al., 2008). To directly test the hypothesis that gch1 CNV contributes to pyrimethamine drug resistance we overexpressed gch1 in different genetic backgrounds and assessed resistance phenotypes. Our results demonstrate that increases in gch1 CN and expression alter resistance phenotypes differently in diverse parasite genetic backgrounds. We found that in parasites that express low levels of endogenous gch1, increases in gch1 expression result in a significant increase in antifolate resistance. However in parasite lines that have high endogenous expression levels of gch1, further increases were not beneficial and could even be detrimental to parasite growth. These studies highlight how gch1 expression, dhps and dhfr mutations all contribute to the establishment of a drug resistant parasite population by creating a balanced flux through the folate pathway enabling drug resistance while maintaining parasite fitness.
Results
Establishment of baseline levels of gch1 copy number and levels of expression
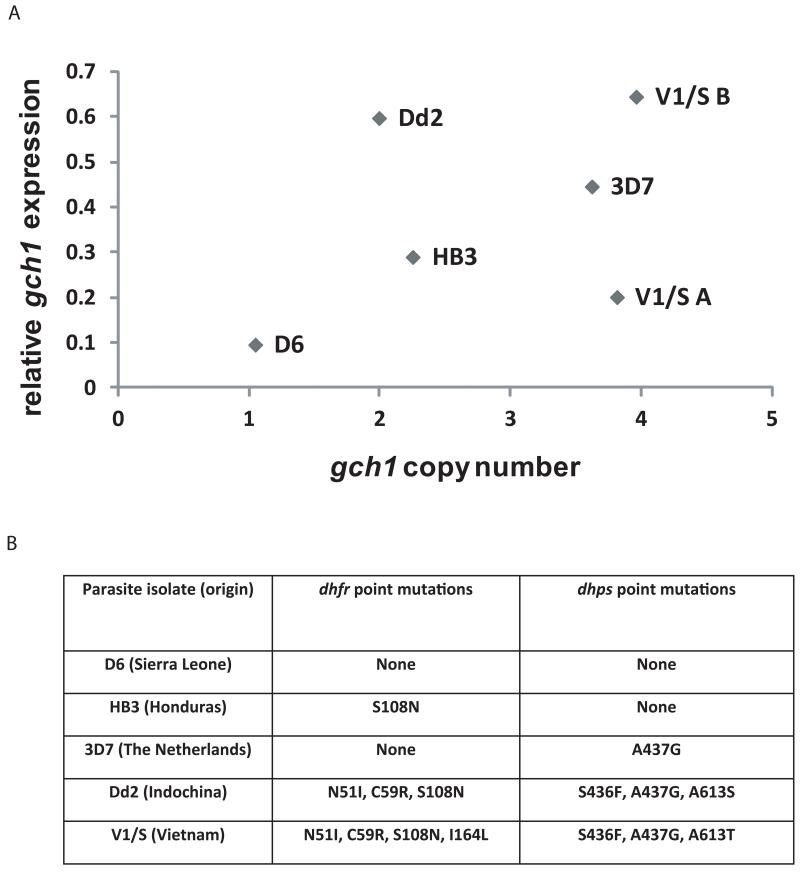
Alterations in gene copy number are often associated with changes in levels of gene expression (Gonzales et al., 2008; Nair et al., 2008). To obtain baselines for gch1 levels for the parasite isolates used in this study, late stage parasites were collected and DNA and RNA were harvested. gch1 copy numbers and expression levels were analyzed by quantitative PCR (Q-PCR). In general, the more genomic copies of gch1, the higher the expression levels observed (Fig. 2). However, in this analysis of 5 isolates there was not a strict linear relationship between copy number and expression indicating that expression is not necessarily simply a reflection of gene dosage. With the exception of 3D7, parasites with mutations in dhfr have increased copy number and expression of gch1 compared to our wild type line D6, an observation that corroborates previous studies reporting associations between dhfr mutations and amplification of the gch1 locus (Kidgell et al., 2006; Nair et al., 2008).
Figure 2. Baseline levels of gch1 copy number and levels of expression for isolates with differing dhfr and dhps haplotypes.
(A) gch1 copy number and expression levels were measured by Q-PCR and Q-RTPCR and plotted against each other. (B) The table shows the antifolate drug resistance profiles of the different isolates along with the accompanying mutations in dhfr and dhps. V1/S A and V1/S B are isogenic lines cultured in different laboratories. Point mutations listed are taken from (Peterson et al., 1988).
Direct manipulation of gch1 CN and expression levels in cultured parasites
To mimic gch1 CNV seen in the field, we set out to alter gch1 expression in cultured parasites and examine its effect on pyrimethamine drug resistance using a regulatable transgene expression system (Epp et al., 2008). By altering the concentration of blasticidin used for selection, this system allowed us to modulate copy number and expression of gch1 in various genetic backgrounds. Since blasticidin pressure can have off-target effects including altered membrane permeability (Hill et al., 2007), control parasites were transfected with a plasmid expressing Renilla luciferase, which does not interfere with folate metabolism. Changes in pyrimethamine sensitivity as a result of gch1 overexpression were then determined. Chloroquine sensitivity assays were also performed on all transfected lines as an additional control to ensure that our genetic manipulations specifically affected antifolate resistance and were not leading to a generalized multi-drug resistant phenotype. As expected chloroquine sensitivity did not change with gch1 overexpression in any of the lines tested (Supplementary Fig 1).
gch1 overexpression in wild type parasites
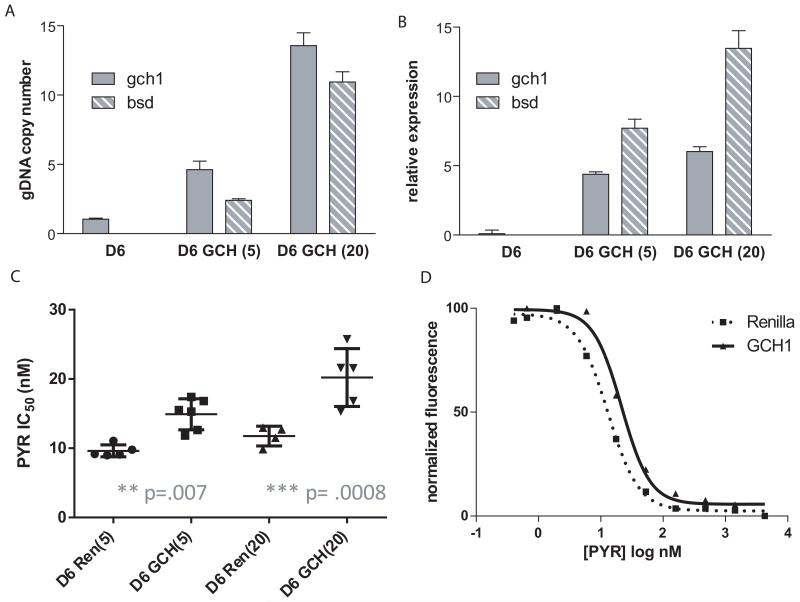
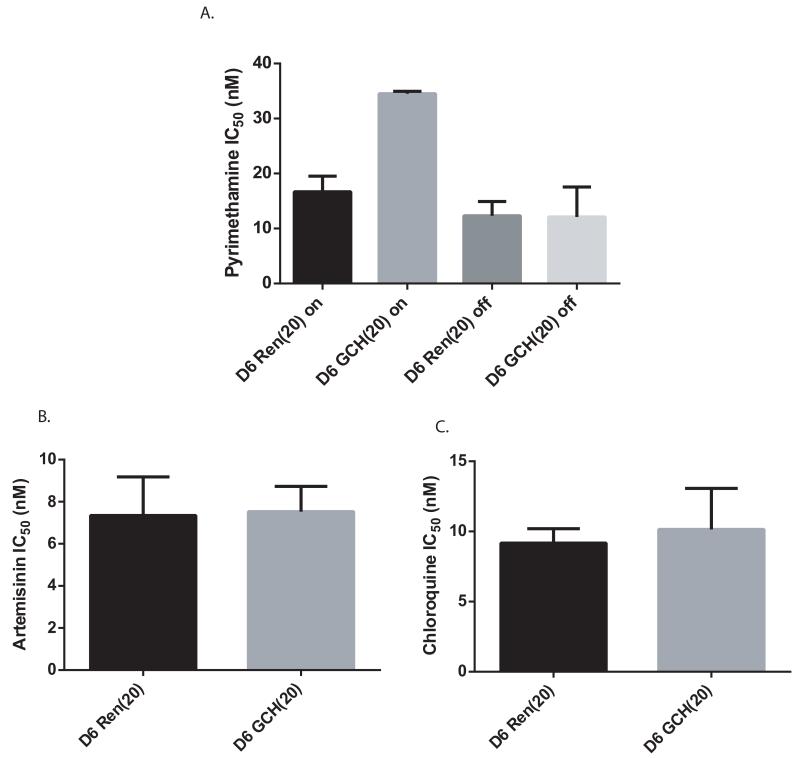
As mentioned, gch1 overexpression appears to be strongly associated with dhfr genotype. We were therefore interested in how parasites with different dhfr alleles respond to increasing gch1 expression. D6 is a West African parasite isolate that has only one genomic copy of gch1 and relatively low endogenous RNA levels (Fig. 2). In addition, D6 has no mutations in dhps and dhfr, making this parasite highly sensitive to antifolates. The gch1 expressing plasmid was stably transfected into D6 and selected under 5 and 20 μg ml−1 blasticidin, thus creating parasite lines carrying increasing plasmid copy numbers. Q-PCR analysis of gDNA confirmed that there was a step-wise increase in copy numbers for both gch1 and blasticidin-s-deaminase (bsd) (Fig. 3A). RNA expression levels of gch1 showed an initial 48-fold increase (compared to untransfected parasites) when parasites were grown under 5 ug ml−1 blasticidin pressure and an additional rise to 66-fold increased expression with higher blasticidin concentrations (Fig. 3B). D6 parasites overexpressing gch1 became more pyrimethamine resistant as illustrated by the right shift in the dose response curve and the higher IC50 value compared to the control lines (Fig. 3C, D). This demonstrates for the first time that increasing gch1 expression levels alone alters pyrimethamine IC50 values in cultured parasites. To determine if the effect of increased gch1 expression was specific to pyrimethamine, we also performed assays with proguanil, another DHFR inhibitor, and found similar decreases in drug sensitivity (Supplementary Fig. 2). In both cases, though the changes in IC50s were small compared to the fold increase in gch1 expression, the higher IC50 associated with increased gch1 expression was highly reproducible, statistically significant and the assays were performed with independent transfections and dose titrations. In contrast, assays with artemisinin and chloroquine showed no shifts in IC50 values (Fig. 4C, D), confirming that the effect is specific to the folate pathway. As an additional control, we removed blasticidin pressure prior to repeating our drug assay. In the absence of continued blasticidin selection, parasites rapidly shed episomal plasmids, thus losing the source of increased gch1 expression. After one week grown in the absence of blasticidin, the parasite’s IC50 reverted back to the level of our control Renilla line (Fig. 4A), thus demonstrating that our genetic manipulations only affected the folate pathway and that the parasites did not harbor any additional off target mutations that might contribute to a generalized increased drug resistance phenotype. These data strongly suggest that the IC50 shift was only attributable to changes in gch1.
Figure 3. gch1 amplification in D6 increases pyrimethamine resistance.
Bar graphs show gch1 and bsd copy number (A) and expression levels (B) in untransfected parasites (D6), parasites grown under 5 μg ml−1 blasticidin, D6 GCH(5), and 20 ug ml−1 blasticidin, D6 GCH(20). (C) Pyrimethamine IC50 values were calculated for each gch1 line and compared to parasites transfected with a Renilla expressing control plasmid grown under the same amount of blasticidin. Both D6 GCH(5) and D6 GCH(20) show a statistically significant increase in pyrimethamine IC50 values (unpaired t-test, p=.007 and .0008, respectively, n=4 or greater). (D) The dose response curves for parasite lines grown under 20 μg ml−1 blasticidin is graphically depicted and reveals a shift to the right in gch1 overexpressing parasites. This curve is representative of multiple experiments.
Figure 4. Continuous gch1 overexpression is required for increased pyrimethamine resistance and does not affect sensitivity to artemisinin or chloroquine.
(A) IC50 values are shown for parasites grown under continuous blasticidin pressure (on) and those removed from blasticidin pressure for one week prior to performing the drug assay (off). Similar IC50 values are observed for Ren(20)on and GCH(20)off, supporting the conclusion that overexpression of gch1 is the factor leading to increased drug resistance seen in D6 GCH(20)on when compared to D6 Ren(20)on. Chloroquine and artemisinin IC50s do not change with gch1 overexpression (B,C).
gch1 overexpression in parasites with low level pyrimethamine resistance
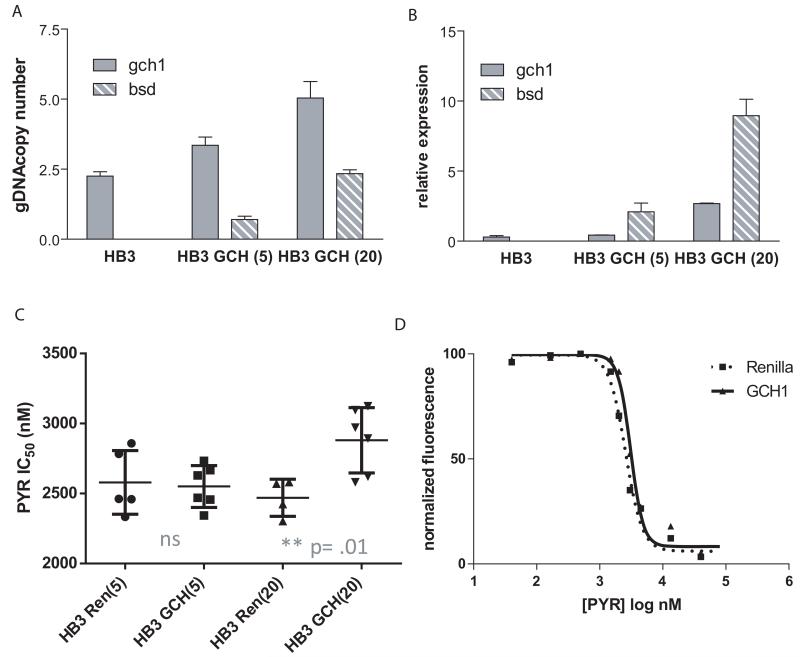
We next examined the Honduran parasite line, HB3. HB3 has a greater gch1 CN and higher expression than D6 and carries one mutation in dhfr (S108N, Fig. 2) which confers low level resistance to pyrimethamine and is generally thought to be the first mutation acquired in dhfr in response to exposure to DHFR inhibitors. Like D6, transfected HB3 parasites increased gch1 copy number and expression levels in response to increased blasticidin pressure (Fig. 5A, B). However, there was less of an increase in gch1 transcript levels in HB3 than in D6 (9-fold in HB3 GCH(20)). Overexpression of gch1 in HB3 parasites under high but not low blasticidin pressure caused a subtle but statistically significant decrease in pyrimethamine susceptibility compared to the Renilla control (Fig. 5C, D) reflective of a modest increase in gch1 expression. Our inability to amplify gch1 CN and expression to the same degree in HB3 as we did in D6 appears to be a limitation of our system. Overexpression of Renilla was similarly limited to less than 10-fold in HB3 (Supplementary Fig. 3), suggesting that the limited increases in gch1 expression levels were secondary to the parasite’s response to blasticidin rather than a direct effect of increased gch1.
Figure 5. gch1 amplification in HB3 modestly increases pyrimethamine resistance.
Bar graphs show gch1 and bsd copy number (A) and expression levels (B) in untransfected parasites (HB3), parasites grown under 5 μg ml−1 blasticidin, HB3 GCH(5), and 20 μg ml−1 blasticidin, HB3 GCH(20). (C) Pyrimethamine IC50 values were calculated for each gch1 line and compared to parasites transfected with a Renilla expressing control plasmid grown under the same concentration of blasticidin. Statistical analysis revealed a significant increase in pyrimethamine IC50 in HB3 GCH(20) but not in HB3 GCH(5) (unpaired t-test, p=.01, n=4 or greater). (D) The dose response curve for parasite lines grown under 20 μg ml−1 blasticidin is graphically depicted and reveals a slight shift to the right in gch1 overexpressing parasites which becomes less pronounced at higher drug concentrations. This curve is representative of multiple experiments.
gch1 overexpression in parasites with low level sulfadoxine resistance
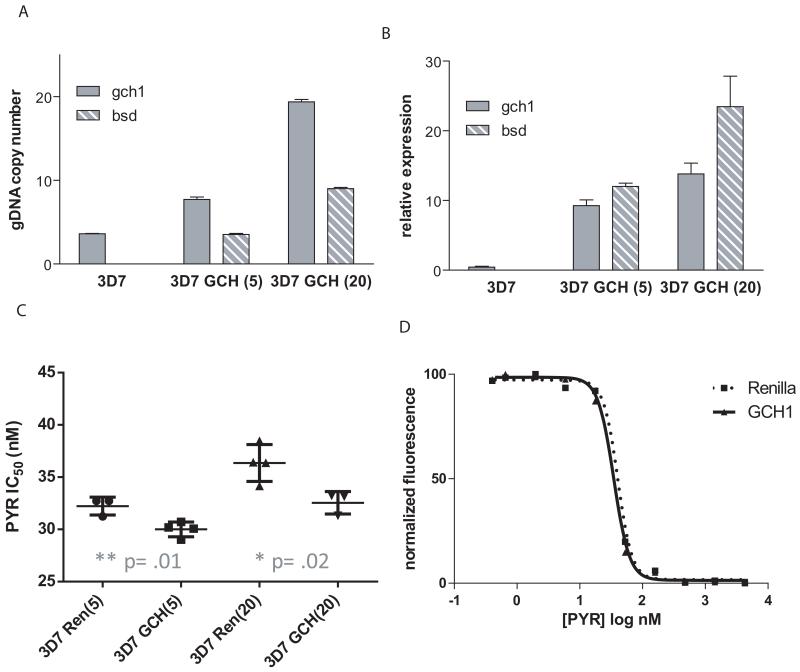
To examine the role of dhps mutations, we next looked at changes in 3D7 drug sensitivity resulting from gch1 overexpression. 3D7, however, has an unusual set of mutations within the folate pathway. In general, mutations in dhfr are thought to precede mutations in dhps, and high baseline gch1 expression is more often associated with resistant dhfr and dhps haplotypes, as previously discussed. 3D7 harbors one mutation in dhps, providing it with a low level of resistance to sulfadoxine, a wildtype dhfr, and a high baseline gch1 CN and expression (Fig. 2). However, we do not expect sulfadoxine resistance to change with gch1 overexpression as this drug competes with PABA, which is not an intermediate of the folate pathway. While selection of transfected lines resulted in up to a 30-fold increase in gch1 expression levels (Fig. 6A, B), unlike the shift observed in D6, there was no increase in pyrimethamine resistance in these parasites, but rather a slight but statistically significant increased sensitivity to pyrimethamine with gch1 overexpression (Fig. 6C, D).
Figure 6. gch1 amplification in 3D7 fails to increase pyrimethamine resistance.
Bar graphs show gch1 and bsd copy number (A) and expression levels (B) in untransfected parasites (3D7), parasites grown under 5 μg ml−1 blasticidin, 3D7 GCH(5), and 20 μg ml−1 blasticidin, 3D7 GCH(20). (C) Pyrimethamine IC50 values were calculated for each gch1 line and compared to parasites transfected with a Renilla expressing control plasmid grown under the same concentration of blasticidin. Statistical analysis revealed a slight but statistically significant increase in pyrimethamine sensitivity for both 3D7 GCH(5) and 3D7 GCH(20) (unpaired t-test, p=.01and .02, respectively, n=4 or greater). (D) The dose response curve for parasite lines grown under 20 μg ml−1 blasticidin is graphically depicted and reveals a slight shift towards sensitivity (left shift) in gch1 overexpressing parasites. This curve is representative of multiple experiments.
Highly resistant dhfr alleles and gch1 overexpression
In parasites isolated from various geographical regions, increasing numbers of mutations in dhfr are associated with higher levels of antifolate resistance (Fig. 2). For example, the hyper-resistant parasites Dd2 and V1/S have been shown to have three and four dhfr mutations respectively, three mutations in dhps as well as high levels of gch1 expression (Fig. 2). Unfortunately, our overexpression system was not compatible with parasite lines Dd2 and V1/S. Transfected lines showed no significant increase in gch1 expression (Supplementary Fig. 4). This trend was observed in our Renilla controls as well, indicating that failure to overexpress our construct was due to the parasites’ response to blasticidin and not a response to gch1 overexpression as was seen to a limited extent in HB3 (Supplementary Fig. 3).
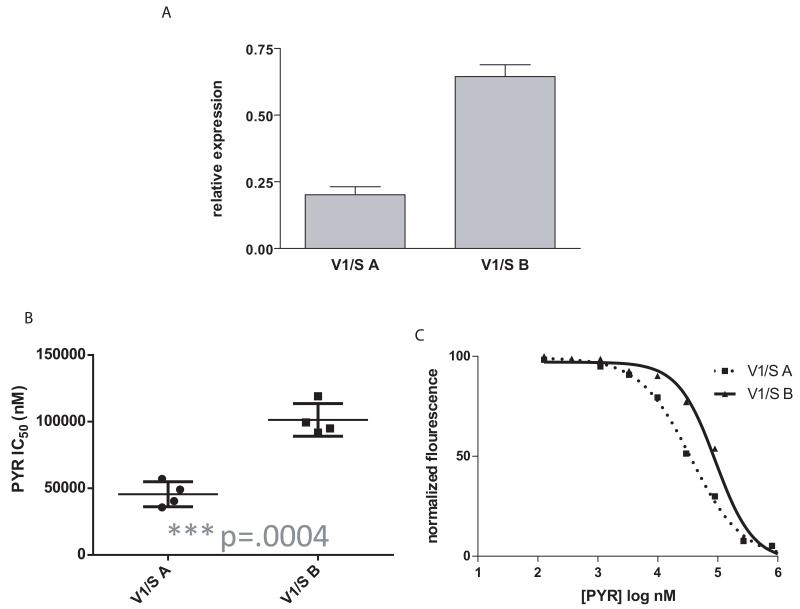
Microarray studies have shown that expression levels can differ between clones of the same genetic background (Rovira-Graells et al., 2012). We observed such variation in both Dd2 and V1/S when we examined clonal lines that had been maintained in different laboratories. Therefore, although we were unable to manipulate gch1 CN, we were able to utilize spontaneous alterations in gch1 expression to investigate changes in pyrimethamine sensitivity. We analyzed two V1/S parasite lines and determined that while they had similar gch1 CN (Fig. 2A), they displayed substantially different gch1 expression levels (Fig. 7A). We confirmed that these lines were derived from the same original clone using Southern analysis of genomic DNA. A probe to the conserved region of the hypervariable var gene family yielded identical hybridization patterns, thus confirming that the parasites are isogenic. In addition, both lines carried the same four dhfr mutations (Supplementary Fig. 5). These parasite lines therefore enabled us to examine parasites with the same genetic background and dhfr haplotype yet with significantly different gch1 expression levels. They also allowed us to examine changes in gch1 expression in the setting of a quad mutant dhfr. Drug sensitivity assays confirmed that they have drastically dissimilar pyrimethamine IC50 values (Fig.7B, C); the higher gch1 expressing clone, V1/S B displayed an IC50 that was nearly twice that of its sibling clone V1/S A, further implicating gch1 overexpression as a modulator of pyrimethamine resistance.
Figure 7. Two V1/S clones have distinct gch1 expression profiles as well as pyrimethamine IC50 values.
Q-RTPCR reveals a difference in gch1 expression levels (A) which follow a similar pattern to pyrimethamine IC50 values (B) (unpaired t-test, p=.0004, n=4). Dose response curves show the difference in pyrimethamine resistance between the two lines. This curve is representative of multiple experiments.
Direct manipulation of both dhfr haplotype and gch1 expression
To further explore the effects of dhfr alleles and gch1 expression on pyrimethamine resistance, we introduced a quad mutant dhfr (N51I, C59R, S108N, I164L) into D6 and 3D7 parasites in combination with increased gch1 expression. We created parasites with a plasmid expressing the quad mutant dhfr allele maintained as an episome rather than by allelic exchange. This method is relatively rapid and avoids the significant population “bottle neck” resulting from selection for genomic integration, and the resulting “pseudo-diploid” lines are therefore less likely to have acquired other compensatory mutations that would have the potential to alleviate the fitness cost associated with the mutant dhfr. In the presence of increasing amounts of pyrimethamine, the mutant DHFR will become dominant due to the inhibitory effect of the drug on the wildtype enzyme. D6 DHFR (4M) and 3D7 DHFR (4M) are parasite lines that harbor an endogenous wild type dhfr, and an episomally expressed quad mutant dhfr along with episomally expressed gch1 or Renilla. Our transgenic lines were created using blasticidin and neomycin as selectable markers and thus the drug sensitivity assays were the first time they were exposed to pyrimethamine and forced to rely on the quad mutant DHFR.
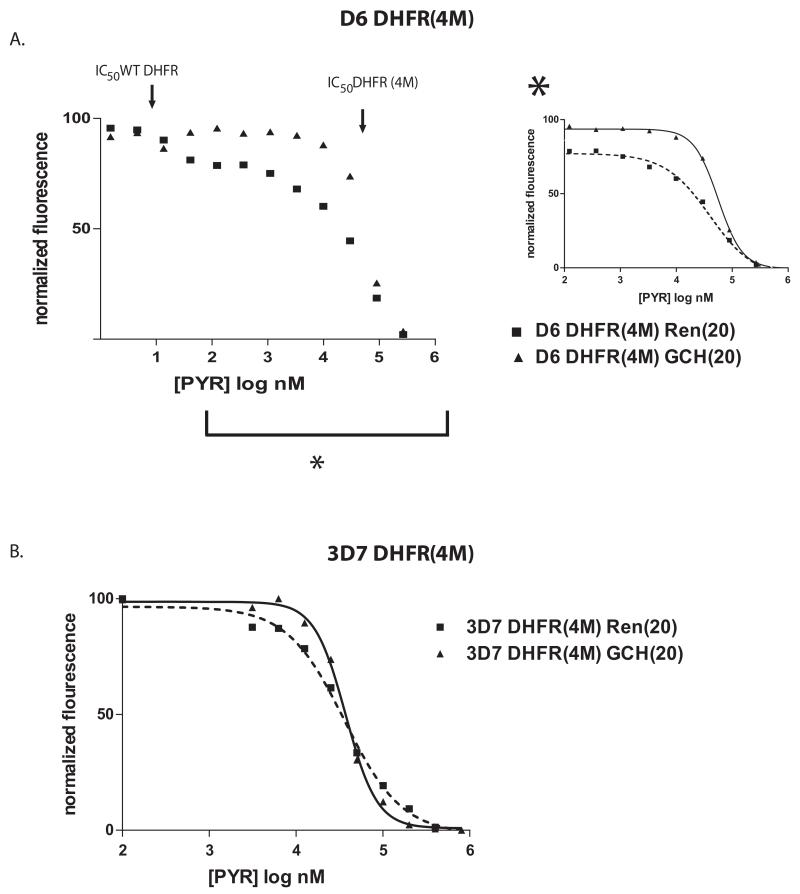
The dose response curves to pyrimethamine revealed complex interactions between different DHFR alleles and levels of GCH1 expression. As expected, gch1 overexpression in D6 resulted in an increase in resistance, however as drug pressure was increased the advantage of gch1 overexpression diminished to the point where the two curves meet (Figure 8A). It is also notable that there was a decline in survival in D6 DHFR(4M) Renilla (20) when compared to D6 DHFR(4M) GCH (20) at doses of pyrimethamine below the IC50 of the quad mutant DHFR. This suggests a growth disadvantage when D6 parasites are forced to depend on the quad mutant dhfr in the absence of increased gch1 expression. For 3D7, in the presence of the quad mutant dhfr, increased gch1 expression resulted in a significant increase in pyrimethamine resistance at pyrimethamine concentrations below the IC50 (Figure 8B). However at concentrations above the IC50, 3D7 DHFR(4M) GCH(20) parasites became significantly more sensitive to pyrimethamine than the control line as was seen in the previous 3D7 experiments expressing only increased gch1.
Figure 8. Manipulation of dhfr haplotype with increased gch1.
Dose response curves comparing D6 (A) and 3D7 (B) parasite lines expressing the quad mutant dhfr with or without gch1 overexpression. The curves are representative of multiple experiments and show a complex relationship between gch1 overexpression and DHFR haplotype. For D6, a bimodal curve was observed in parasites expressing both a wildtype and quad mutant DHFR, each of two distinct slopes roughly correlated with the IC50s of the wildtype and quad mutant DHFRs (shown with arrows above the curve). The curve within the inset to the right (marked with an asterisk) shows the region of the graph depicting the response of parasites reliant on the quad mutant DHFR. Note that the benefit of increased gch1 expression decreases at higher doses of pyrimethamine. Similarly, the 3D7 DHFR (4M) data shows a detrimental effect of gch1 overexpression at high doses of pyrimethamine.
Discussion
Our data provide the first direct evidence of the adaptive role of gch1 and is consistent with gch1 amplification serving as a compensatory genetic alteration in parasites with resistance mutations in dhfr or dhps. Antifolate resistance in P. falciparum has been noted to occur in a stepwise fashion, with each point mutation in the target genes contributing to a greater level of resistance. We have presented direct evidence that in addition to point mutations, CNV with subsequent increased expression of the enzyme responsible for the first step in the folate pathway alters parasite susceptibility to pyrimethamine. The diversity of responses observed in different genetic backgrounds reveals the interesting and complex biology surrounding the many factors contributing to antifolate resistance in this important human pathogen.
Increased gch1 levels have a variable effect on pyrimethamine IC50 values
Across different dhfr haplotypes in three different parasite lines, D6, HB3, and V1/S, increased gch1 expression resulted in a shift in IC50 to a more pyrimethamine resistant phenotype. This is consistent with the model that increased flux through the folate pathway leads to more intermediate products that compete with pyrimethamine for binding to their target enzymes and thus a more resistant parasite. 3D7 was the outlier with a mild, though significant shift to increased sensitivity with increased gch1 expression. This may reflect the unusual makeup of the folate pathway of 3D7, which displays very high levels of endogenous gch1 expression and thus any benefit from increased activity at this step in the pathway is potentially saturated. 3D7 also harbors a mutation in dhps (Fig. 2), conferring low level resistance to sulfadoxine and potentially altering flux through the pathway (Fig. 1).
There is a balance of flux through the folate pathway that when disturbed can be detrimental to parasite survival
As mentioned above, increases in gch1 expression did not result in increased pyrimethamine resistance in 3D7. Further, increased gch1 expression was even detrimental to parasite growth in our 3D7 DHFR(4M)GCH(20) parasites when challenged with high levels of pyrimethamine (Fig. 8B). This demonstrates that there is a limit to the benefit of increased GTP-CH activity. In wildtype parasites, it is assumed that the first step catalyzed by GTP-CH is rate limiting as has been experimentally validated in other organisms (Hossain et al., 2004). However, when parasites acquire mutations in the enzymes downstream of GTP-CH, or in the presence of inhibitors like pyrimethamine, these enzymatic steps are slowed and could become rate limiting. Increased input into the folate pathway with amplified gch1 and resultant accumulation in metabolic intermediates can contribute to antifolate resistance by competing with drugs for binding to enzymes. However it is also possible that excess accumulation of pathway intermediates could be deleterious, especially in the setting of a marked decrease in efficiency downstream of GTP-CH.
Higher levels of certain metabolites may either be directly toxic or may inhibit other essential enzymes, with both possibilities resulting in decreased parasite viability. This second scenario is termed the “domino effect” and describes a situation in which one drug (e.g. pyrimethamine) inhibits a known enzyme (e.g. DHFR) and causes accumulation of a substrate (e.g. DHF) which will then inhibit another enzyme. This phenomenon has been observed in E. coli where DHFR inhibition by trimethoprim results in a buildup of DHF, which in turn inhibits folylpoly-γ- glutamate synthetase, another enzyme in folate metabolism (Kwon et al., 2008). It is conceivable that these deleterious effects will be magnified when upstream reactions generate excess metabolites as is the case with gch1 overexpression. In other words, parasite survival in the presence of pyrimethamine can be seen as a balance between acquiring the necessary folate for survival and minimizing the harmful effects of metabolite buildup that might accumulate as a result of gch1 overexpression.
Plasticity of copy number
In other organisms gene duplications and amplifications are known to be unstable and more frequent, compared to point mutations, and this is likely also the case for P. falciparum. It is well described that CNV occurs in the field as well as in vitro under selection conditions, usually with amplification breakpoints in monomeric tracts of A or T base pairs (Anderson et al., 2009). For gch1, amplifications have only been found in field isolates and have not been observed in parasites maintained in vitro under low doses of pyrimethamine. In contrast, dhfr amplification has only been found in parasites grown in vitro, while in circulating parasites point mutations rather than CNV are detected, indicating a difference in selective pressure under culture and field conditions. It is also worth noting that most field studies that have identified CNV in parasite populations have not directly examined expression levels. In both the laboratory isolates studied here and in our genetically manipulated lines there was not a linear relationship between gch1 copy number and mRNA expression. This additional complexity should be taken into account in future studies of CNV variation and parasite phenotypes.
Implications for antifolate development
While changes in IC50 like those reported here are modest, they are likely to be sufficient to facilitate the establishment of resistant alleles of downstream target enzymes within a population of circulating parasites. By compensating for less efficient DHFR (and possibly DHPS) enzymes and thereby maintaining a required balance within the folate pathway, increased gch1 CN could contribute to fixation of dhfr and dhps mutations within a geographical region, as has been observed in Thailand. Thus, gch1 CNV likely contributes to antifolate resistance through subtle changes in parasite fitness rather than directly through drug treatment failure. However, the observation that the compensatory benefit of gch1 overexpression has a limit and can even be deleterious in the presence of the quad mutant dhfr suggests that this could provide an avenue for intervention. Considering that new inhibitors of the quad mutant DHFR are in development, it is important to consider all adaptations the parasite makes to establish and maintain drug resistance, and even to consider targeting GTP-CH itself.
Experimental Procedures
Plasmodium falciparum culture and transfection
P. falciparum lines were cultured at 5% hematocrit in RPMI 1640 medium, 0.5% Albumax II (Invitrogen), 0.25% sodium bicarbonate, and 0.1 mg/ml gentamicin. Parasites were incubated at 37°C in an atmosphere of 5% oxygen, 5% carbon dioxide, and 90% nitrogen. V1/S and D6 parasite lines were obtained from MR4. Parasites were transfected by using “DNA loaded” red blood cells as previously described (Deitsch et al., 2001). For stable transfections, parasites were cultured in media containing either 500 μg ml−1 neomycin or the designated concentration of blasticidin.
Plasmid construction
The HBIRH plasmids expressing blasticidin-s-deaminase (bsd) and Renilla luciferase were constructed as described previously (Epp et al., 2008). The plasmid contains a bidirectional promoter that drives both the selectable marker bsd and the gene of interest, Renilla or gch1. The more blasticidin added to the culture the higher copy numbers and expression levels, thus allowing for manipulation of copy number. The promoter driving gch1 expression from the plasmid is transcriptionally active late in the cell cycle (Epp et al., 2008), corresponding to the peak expression of endogenous gch1 (Nirmalan et al., 2002). Construction of a plasmid expressing GTP-CH, was made by PCR amplification of the coding region of gch1 (PF3D7_1224000) with primers to introduce NotI and SacI cloning sites. Construction of the mutant DHFR plasmid was made by PCR amplification of dhfr –ts (PF3D7_0417200) with primers to introduce restriction sites NotI and SacI using V1/S gDNA as template. All primers used for plasmid construction are shown in Supplementary Table 1.
Determination of gch1 copy number and expression by quantitative PCR
For all parasites grown under blasticidin pressure, the drug was removed 24-48 hours prior to synchronization to eliminate the effect of blasticidin on sorbitol permeability (Hill et al., 2007). Parasites were synchronized using percoll-sorbitol gradients and purified schizonts were placed back in culture and allowed to mature to the late trophozoite stage. DNA was isolated by phenol:chloroform extraction and RNA isolation was performed using the TRIZOL LS Reagent (Invitrogen) as described previously(Epp et al., 2008) cDNA was synthesized from 2 μg total RNA in a reaction volume of 50 μl. For each cDNA synthesis reaction, a control reaction without reverse transcriptase was made with identical amounts of template and primers. Q-PCR was carried out as follows. All reactions were performed at a final primer concentration of 0.5 μM using Bio-Rad ITAQ SYBR SUPERMIX® in 20 μl reactions on an ABI Prism® 7900HT real-time PCR machine. A validation experiment was performed, as described in the Applied Biosystems User manual, to ensure equal amplification efficiencies of the housekeeping and target gene primer sets. The ΔCT for each individual primer pair was determined by subtracting the CT value of the target gene from the CT value of the control gene, seryl-tRNA synthetase (PF3D7_0717700) (Applied Biosystems, User Bulletin 2). ΔCTs were then converted to relative copy numbers or expression with the formula 2ΔCt. All runs were done in triplicate and results are representative of at least two experiments. Multiple concentrations of template gDNA and cDNA were used in each run and the calculated copy number and expression levels were averaged. Raw ct values are included in Supplementary file 1.
Drug sensitivity assays and IC50 analysis
Drug sensitivity assays were performed on cultured parasites using SYBR Green I as described previously (Smilkstein et al., 2004). Prior to the assay, parasite cultures were synchronized using an alanine-HEPES solution (Braun-Breton et al., 1988) to obtain a synchronous culture of ring stage parasites. 100 μl aliquots of parasite culture were distributed into clear 96 well plates to achieve a starting parasitemia of 0.2-0.5% and 2% hematocrit. Stock solutions were prepared at 20 mg ml−1 in DMSO for pyrimethamine and 1 mg ml−1 in water for chloroquine. Final concentrations for each assay were varied between isolates and ranged from 804 uMto 0.8 nM for pyrimethamine and 1.7 uM to 1.7 nM for chloroquine. Drug dilutions were in complete media and 100 μl of the prepared drug dilution was added for a total volume of 200 μl per well. Edge wells were filled with media only to prevent any scatter in data resulting from disproportionate dehydration near the edge of the plate. Plates were placed in an airtight chamber, flushed with 5% oxygen, 5% carbon dioxide, and 90% nitrogen, and allowed to grow for 72 hours. At the end of the growth period, contents of wells were resuspended and 150 μl of the culture was transferred to a 96 well black plate designed for fluorescent readings. Plates were then placed in the −80°C freezer overnight. After allowing the plates to thaw completely, 100 μl of SYBR Green diluted in lysis buffer (0.2 μl SYBR Green/ml lysis buffer) (Smilkstein et al., 2004) was added to each well and allowed to shake in the dark at room temperature for 1 hour. Plates were then read using SpectraMax Gemini using an excitation wavelength of 490 nm and 530 nm detection. Data analysis was performed with Graphpad Prism software. Counts were plotted against the logarithm of the drug concentration, normalized, and then curve fitted by nonlinear regression (sigmoidal dose-response/variable slope equation) to yield IC50 values. One way ANOVA and unpaired t-tests were performed in Excel combining the data from repeat dose response experiments. All error bars in generated plots show standard deviation. Multiple independent transfections were performed in the D6 line and yielded consistent results.
Supplementary Material
Acknowledgements
The authors would like to thank Lisa Needham for assistance with drug assays and helpful discussion. Preliminary studies for this work were conducted by students attending the Biology of Parasitism course at the Marine Biological Station in Woods Hole MA in 2009. The Department of Microbiology and Immunology at Weill Medical College of Cornell University acknowledges the support of the William Randolph Hearst Foundation. This work was supported by the National Institutes of Health [AI 52390 to KWD; AI 99327 to KWD and LAK, AI76635 to LAK]. KWD is a Stavros S. Niarchos Scholar. LAK is a William Randolph Hearst Foundation Clinical Scholar in Microbiology and Infectious Diseases.
References
- Anderson TJ, Patel J, Ferdig MT. Gene copy number and malaria biology. Trends Parasitol. 2009;25:336–343. doi: 10.1016/j.pt.2009.04.005. [DOI] [PMC free article] [PubMed] [Google Scholar]
- Braun-Breton C, Rosenberry TL, da Silva LP. Induction of the proteolytic activity of a membrane protein in Plasmodium falciparum by phosphatidyl inositol-specific phospholipase C. Nature. 1988;332:457–459. doi: 10.1038/332457a0. [DOI] [PubMed] [Google Scholar]
- Deitsch K, Driskill C, Wellems T. Transformation of malaria parasites by the spontaneous uptake and expression of DNA from human erythrocytes. Nucleic Acids Res. 2001;29:850–853. doi: 10.1093/nar/29.3.850. [DOI] [PMC free article] [PubMed] [Google Scholar]
- Eastman RT, Dharia NV, Winzeler EA, Fidock DA. Piperaquine resistance is associated with a copy number variation on chromosome 5 in drug-pressured Plasmodium falciparum parasites. Antimicrob Agents Chemother. 2011;55:3908–3916. doi: 10.1128/AAC.01793-10. [DOI] [PMC free article] [PubMed] [Google Scholar]
- Epp C, Raskolnikov D, Deitsch K. A regulatable transgene expression system for cultured Plasmodium falciparum parasites. Malar J. 2008;7:86. doi: 10.1186/1475-2875-7-86. [DOI] [PMC free article] [PubMed] [Google Scholar]
- Estivill X, Armengol L. Copy number variants and common disorders: filling the gaps and exploring complexity in genome-wide association studies. PLoS Genet. 2007;3:1787–1799. doi: 10.1371/journal.pgen.0030190. [DOI] [PMC free article] [PubMed] [Google Scholar]
- Funderburk CD, Bowling KM, Xu D, Huang Z, O’Donnell JM. A typical N-terminal extensions confer novel regulatory properties on GTP cyclohydrolase isoforms in Drosophila melanogaster. J Biol Chem. 2006;281:33302–33312. doi: 10.1074/jbc.M602196200. [DOI] [PubMed] [Google Scholar]
- Gonzales JM, Patel JJ, Ponmee N, Jiang L, Tan A, Maher SP, Wuchty S, Rathod PK, Ferdig MT. Regulatory hotspots in the malaria parasite genome dictate transcriptional variation. PLoS Biol. 2008;6:e238. doi: 10.1371/journal.pbio.0060238. [DOI] [PMC free article] [PubMed] [Google Scholar]
- Higgins CE, Gross SS. The N-terminal peptide of mammalian GTP cyclohydrolase I is an autoinhibitory control element and contributes to binding the allosteric regulatory protein GFRP. J Biol Chem. 2011;286:11919–11928. doi: 10.1074/jbc.M110.196204. [DOI] [PMC free article] [PubMed] [Google Scholar]
- Hill DA, Pillai AD, Nawaz F, Hayton K, Doan L, Lisk G, Desai SA. A blasticidin S-resistant Plasmodium falciparum mutant with a defective plasmodial surface anion channel. Proc Natl Acad Sci U S A. 2007;104:1063–1068. doi: 10.1073/pnas.0610353104. [DOI] [PMC free article] [PubMed] [Google Scholar]
- Hossain T, Rosenberg I, Selhub J, Kishore G, Beachy R, Schubert K. Enhancement of folates in plants through metabolic engineering. Proc Natl Acad Sci U S A. 2004;101:5158–5163. doi: 10.1073/pnas.0401342101. [DOI] [PMC free article] [PubMed] [Google Scholar]
- Hyde JE. Exploring the folate pathway in Plasmodium falciparum. Acta Trop. 2005;94:191–206. doi: 10.1016/j.actatropica.2005.04.002. [DOI] [PMC free article] [PubMed] [Google Scholar]
- Jiang H, Yi M, Mu J, Zhang L, Ivens A, Klimczak LJ, Huyen Y, Stephens RM, Su XZ. Detection of genome-wide polymorphisms in the AT-rich Plasmodium falciparum genome using a high-density microarray. BMC Genomics. 2008;9:398. doi: 10.1186/1471-2164-9-398. [DOI] [PMC free article] [PubMed] [Google Scholar]
- Kidgell C, Volkman SK, Daily J, Borevitz JO, Plouffe D, Zhou Y, Johnson JR, Le Roch K, Sarr O, Ndir O, Mboup S, Batalov S, Wirth DF, Winzeler EA. A systematic map of genetic variation in Plasmodium falciparum. PLoS Pathog. 2006;2:e57. doi: 10.1371/journal.ppat.0020057. [DOI] [PMC free article] [PubMed] [Google Scholar]
- Kwon YK, Lu W, Melamud E, Khanam N, Bognar A, Rabinowitz JD. A domino effect in antifolate drug action in Escherichia coli. Nat Chem Biol. 2008;4:602–608. doi: 10.1038/nchembio.108. [DOI] [PMC free article] [PubMed] [Google Scholar]
- Laufer MK, Plowe CV. Withdrawing antimalarial drugs: impact on parasite resistance and implications for malaria treatment policies. Drug Resist Updat. 2004;7:279–288. doi: 10.1016/j.drup.2004.08.003. [DOI] [PubMed] [Google Scholar]
- Maita N, Hatakeyama K, Okada K, Hakoshima T. Structural basis of biopterin-induced inhibition of GTP cyclohydrolase I by GFRP, its feedback regulatory protein. J Biol Chem. 2004;279:51534–51540. doi: 10.1074/jbc.M409440200. [DOI] [PubMed] [Google Scholar]
- Maita N, Okada K, Hatakeyama K, Hakoshima T. Crystal structure of the stimulatory complex of GTP cyclohydrolase I and its feedback regulatory protein GFRP. Proc Natl Acad Sci U S A. 2002;99:1212–1217. doi: 10.1073/pnas.022646999. [DOI] [PMC free article] [PubMed] [Google Scholar]
- Nair S, Miller B, Barends M, Jaidee A, Patel J, Mayxay M, Newton P, Nosten F, Ferdig M, Anderson T. Adaptive copy number evolution in malaria parasites. PLoS Genet. 2008;4:e1000243. doi: 10.1371/journal.pgen.1000243. [DOI] [PMC free article] [PubMed] [Google Scholar]
- Nirmalan N, Wang P, Sims PF, Hyde JE. Transcriptional analysis of genes encoding enzymes of the folate pathway in the human malaria parasite Plasmodium falciparum. Mol Microbiol. 2002;46:179–190. doi: 10.1046/j.1365-2958.2002.03148.x. [DOI] [PubMed] [Google Scholar]
- Nzila A, Ward SA, Marsh K, Sims PF, Hyde JE. Comparative folate metabolism in humans and malaria parasites (part I): pointers for malaria treatment from cancer chemotherapy. Trends Parasitol. 2005a;21:292–298. doi: 10.1016/j.pt.2005.04.002. [DOI] [PMC free article] [PubMed] [Google Scholar]
- Nzila A, Ward SA, Marsh K, Sims PF, Hyde JE. Comparative folate metabolism in humans and malaria parasites (part II): activities as yet untargeted or specific to Plasmodium. Trends Parasitol. 2005b;21:334–339. doi: 10.1016/j.pt.2005.05.008. [DOI] [PMC free article] [PubMed] [Google Scholar]
- Peterson DS, Walliker D, Wellems TE. Evidence that a point mutation in dihydrofolate reductase-thymidylate synthase confers resistance to pyrimethamine in falciparum malaria. Proc Natl Acad Sci U S A. 1988;85:9114–9118. doi: 10.1073/pnas.85.23.9114. [DOI] [PMC free article] [PubMed] [Google Scholar]
- Preechapornkul P, Imwong M, Chotivanich K, Pongtavornpinyo W, Dondorp AM, Day NP, White NJ, Pukrittayakamee S. Plasmodium falciparum pfmdr1 amplification, mefloquine resistance, and parasite fitness. Antimicrob Agents Chemother. 2009;53:1509–1515. doi: 10.1128/AAC.00241-08. [DOI] [PMC free article] [PubMed] [Google Scholar]
- Price RN, Uhlemann AC, Brockman A, McGready R, Ashley E, Phaipun L, Patel R, Laing K, Looareesuwan S, White NJ, Nosten F, Krishna S. Mefloquine resistance in Plasmodium falciparum and increased pfmdr1 gene copy number. Lancet. 2004;364:438–447. doi: 10.1016/S0140-6736(04)16767-6. [DOI] [PMC free article] [PubMed] [Google Scholar]
- Ribacke U, Mok BW, Wirta V, Normark J, Lundeberg J, Kironde F, Egwang TG, Nilsson P, Wahlgren M. Genome wide gene amplifications and deletions in Plasmodium falciparum. Mol Biochem Parasitol. 2007;155:33–44. doi: 10.1016/j.molbiopara.2007.05.005. [DOI] [PubMed] [Google Scholar]
- Rovira-Graells N, Gupta AP, Planet E, Crowley VM, Mok S, Ribas de Pouplana L, Preiser PR, Bozdech Z, Cortés A. Transcriptional variation in the malaria parasite Plasmodium falciparum. Genome Res. 2012 doi: 10.1101/gr.129692.111. [DOI] [PMC free article] [PubMed] [Google Scholar]
- Sandefur CI, Wooden JM, Quaye IK, Sirawaraporn W, Sibley CH. Pyrimethamine-resistant dihydrofolate reductase enzymes of Plasmodium falciparum are not enzymatically compromised in vitro. Mol Biochem Parasitol. 2007;154:1–5. doi: 10.1016/j.molbiopara.2007.03.009. [DOI] [PMC free article] [PubMed] [Google Scholar]
- Sibley CH, Hyde JE, Sims PF, Plowe CV, Kublin JG, Mberu EK, Cowman AF, Winstanley PA, Watkins WM, Nzila AM. Pyrimethamine-sulfadoxine resistance in Plasmodium falciparum: what next? Trends Parasitol. 2001;17:582–588. doi: 10.1016/s1471-4922(01)02085-2. [DOI] [PubMed] [Google Scholar]
- Sirawaraporn W, Sathitkul T, Sirawaraporn R, Yuthavong Y, Santi DV. Antifolate-resistant mutants of Plasmodium falciparum dihydrofolate reductase. Proc Natl Acad Sci U S A. 1997;94:1124–1129. doi: 10.1073/pnas.94.4.1124. [DOI] [PMC free article] [PubMed] [Google Scholar]
- Smilkstein M, Sriwilaijaroen N, Kelly JX, Wilairat P, Riscoe M. Simple and inexpensive fluorescence-based technique for high-throughput antimalarial drug screening. Antimicrob Agents Chemother. 2004;48:1803–1806. doi: 10.1128/AAC.48.5.1803-1806.2004. [DOI] [PMC free article] [PubMed] [Google Scholar]
- Triglia T, Cowman AF. Primary structure and expression of the dihydropteroate synthetase gene of Plasmodium falciparum. Proc Natl Acad Sci U S A. 1994;91:7149–7153. doi: 10.1073/pnas.91.15.7149. [DOI] [PMC free article] [PubMed] [Google Scholar]
- Triglia T, Duraisingh MT, Good RT, Cowman AF. Reticulocyte-binding protein homologue 1 is required for sialic acid-dependent invasion into human erythrocytes by Plasmodium falciparum. Mol Microbiol. 2005;55:162–174. doi: 10.1111/j.1365-2958.2004.04388.x. [DOI] [PubMed] [Google Scholar]
- Van Tyne D, Park DJ, Schaffner SF, Neafsey DE, Angelino E, Cortese JF, G K, et al. Identification and functional validation of the novel antimalarial resistance locus PF10_0355 in Plasmodium falciparum. PLoS Genet. 2011;7:e1001383. doi: 10.1371/journal.pgen.1001383. [DOI] [PMC free article] [PubMed] [Google Scholar]
- Wellems TE. Plasmodium chloroquine resistance and the search for a replacement antimalarial drug. Science. 2002;298:124–126. doi: 10.1126/science.1078167. [DOI] [PubMed] [Google Scholar]
- Wilson CM, Serrano AE, Wasley A, Bogenschutz MP, Shankar AH, Wirth DF. Amplification of a gene related to mammalian mdr genes in drug-resistant Plasmodium falciparum. Science. 1989;244:1184–1186. doi: 10.1126/science.2658061. [DOI] [PubMed] [Google Scholar]
Associated Data
This section collects any data citations, data availability statements, or supplementary materials included in this article.


