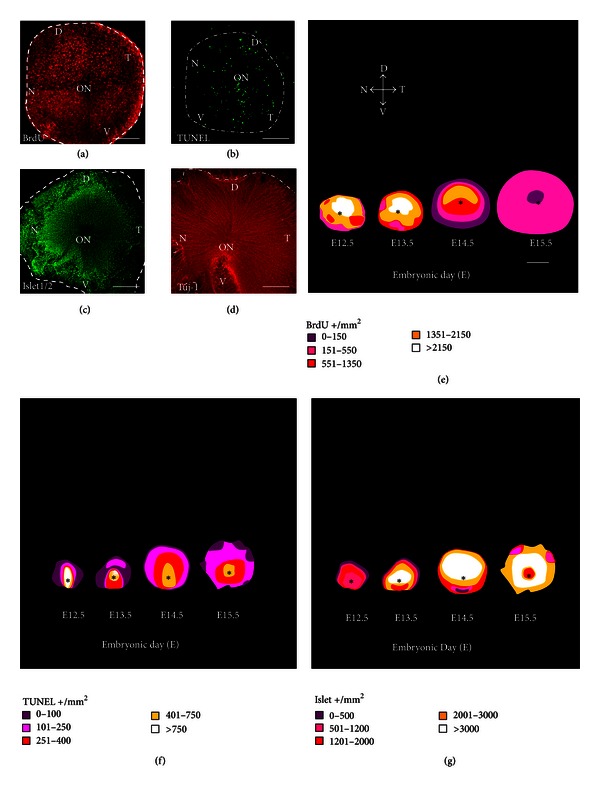
Figure 2.

Overlapping cell processes in the embryonic mouse retina. Representative labeling of cell proliferation (a), death (b), and differentiation (c), (d) in retinal whole mounts from E13.5 mouse embryos. Positive cells were scored in 3–10 retinas from different embryos and represented on isodensity maps of the different processes (e)–(g). The main morphological features are labeled as follows: ON and *: optic nerve; D: dorsal; V: ventral; T: temporal; N: nasal. Scale bars represent 150 μm (a)–(d) and 300 μm (e)–(g).
