Abstract
Objectives
Three-dimensional (3D) umbilical cord blood volume flow measurement with the intention of providing a straightforward, consistent, and accurate method that overcomes the limitations associated with traditional pulsed-wave Doppler flow measurement and provides a means by which to recognize and manage at-risk pregnancies.
Methods
The first study involved 3D ultrasound volume flow measurements in seven healthy ewes whose pregnancies ranged from 18 to 19 weeks’ gestation (7 singletons). Sonographic umbilical arterial and venous flow measurements from each fetus were compared to the corresponding average measured arterial/venous flow to assess feasibility of measurement in a static vessel. A second complementary study involved 3D ultrasound volume flow measurements in seven healthy women whose pregnancies ranged from 17.9 to 36.3 weeks’ gestation (6 singletons, 1 twin). Umbilical venous flow measurements were compared to similar flow measurements reported in the literature. Pregnancy outcomes were abstracted from the medical records of the recruited patients.
Results
In the fetal sheep model, arterial/venous flow comparisons yielded errors of 10% or less for eight out of the nine measurements. In the clinical study, venous flow measurements showed agreement with the literature over a range of gestational ages. Two of the seven patients in the clinical study demonstrated lower flow than anticipated for gestational age; one was subsequently diagnosed with intrauterine growth restriction and the other with preeclampsia.
Conclusions
Accurate measurements of umbilical blood volume flow can be performed with relative ease in both the sheep model and in humans using the proposed 3D ultrasound flow measurement technique. Results encourage further development of the method as a means for diagnosis and identification of at-risk pregnancies.
Keywords: Doppler, volume flow, color flow, umbilical, intrauterine growth restriction
Introduction
Prenatal identification of pathological conditions that affect fetal circulation facilitates changes to obstetric management that can favor a positive perinatal outcome. As with intrauterine growth restriction (IUGR), failure of the fetus to achieve full growth potential is associated with an increased risk of perinatal morbidity and mortality. Despite a large body of literature,1–3 there continues to be uncertainty with regards to the optimal timing of delivery for IUGR gestations, particularly for more severely affected fetuses. A 3-dimensional (3D)/4-dimensional (4D) sonographic method for the measurement of volumetric flow is proposed to aid in the management and timing of delivery of such at-risk pregnancies. The proposed method serves as an alternative to traditional pulsed-wave Doppler flow measurement techniques and is independent of the assumptions required with those traditional methods. From a clinical perspective, the proposed flow measurement technique is expected to yield reliable and consistent estimates of absolute flow across patients, users, and systems.
Current management of IUGR relies on serial assessments of fetal growth, amniotic fluid volumes, fetal well being (which may be end stage evaluations of fetal deterioration), and determination of blood flow patterns through Doppler velocimetry. The lack of specificity in these assessments yields pregnancies with constitutionally small fetuses undergoing increased surveillance. In addition, there is a failure to recognize pregnancies that are at risk due to decreased blood volume flow when the fetal size is within the normal range.
The association between decreased blood volume flow and the growth restricted fetus is well recognized;4–9 however, the inability to obtain fetal blood flow measurements in a straightforward and reliable manner limits the use of such a metric in the identification or management of IUGR pregnancy. Current flow measurement techniques can only identify the end results of decreased flow, which severely limits their use for defining any potential window for therapeutic interventions.
Initial attempts to assess blood volume flow using pulsed-wave Doppler ultrasound were cumbersome10,11 and significant improvements to this traditional method have been made. Despite improvements, there remain a number of technical limitations for flow measurement: dependence on accurate measurement of vessel diameter, assumptions regarding shape and contour of vessel, unpredictability of flow profiles due to tortuous/spiral morphology of umbilical cord vessels, and requirement for a specific angle of insonation. Some of these limitations, such as angle correction, can be managed with a time investment, but many of the limitations are inherent to the technique, which leads to inaccurate volume flow measurements and therefore limited use in the clinical setting.
In order to prove the hypothesis that umbilical blood flow is an appropriate indicator of placental function, a blood flow measurement technique that enables straightforward, consistent, and accurate assessment of placental flow is first required. Such a method is expected to provide clinically useful information to facilitate earlier recognition of at-risk pregnancy and consequently earlier intervention to improve care and optimize timing of delivery. The purpose of this paper is to provide such a method.
A 3-dimensional (3D)/4-dimensional (4D) sonographic method for the measurement of volumetric flow has been previously described that overcomes the limitations associated with pulsed-wave Doppler techniques.12,13 In the method, the probe is positioned so that a constant depth surface (c-surface) fully intersects the umbilical cord’s vessels in the lateral-elevational imaging plane. Volume flow is computed through the c-surface by integration of Doppler-measured velocity vectors14 and partial volume effects are corrected for by using power Doppler data.12,13,15 Accuracy of the method has been demonstrated over a range of flow rates and flow situations both in vivo and in vitro.
The current study was undertaken to demonstrate and validate the 3-dimensional (3D)/4-dimensional (4D) sonographic method for the measurement of umbilical cord blood volume flow in both a fetal sheep model and human subjects with the intention of providing a means by which to recognize and manage at-risk pregnancies.
Materials and Methods
Fetal Sheep Model
Animal experiments were performed under a protocol approved by the University of Michigan’s Committee on the Use and Care of Animals (UCUCA). A total of seven healthy ewes, each with a singleton pregnancy, were included in the study. Gestational age ranged from 18–19 weeks. Note that the volume flow study was performed secondary to an investigational study of an artificial placenta.16 General anesthesia was induced using 12 mg/kg of intravenous sodium thiopental. After endotracheal intubation, anesthesia was maintained by inhalation of isoflurane. Hemodynamic monitoring included carotid arterial and jugular central venous lines. The fetus was removed from the ewe and physiologically monitored. The umbilical cord was placed onto a surgical dressing while care was taken to avoid excessive strain on the cord. Isolation of the cord helped reduce vessel movement due to respiration or other bulk motion.
A GE LOGIQ 9 ultrasound system (GE Healthcare, Milwaukee, WI, USA) equipped with a 4.5–16.0 MHz probe (4D16L) was used to acquire 4D (near real-time 3D) color Doppler image volumes. The umbilical cord was visualized in cross-section in the lateral-elevational imaging plane. The position and tilt angle of the probe was adjusted until a c-surface fully intersected the umbilical cord’s two arteries and two veins. The vessel’s cross section in the imaging plane need not be circular since the only requirement is that the entire cross section appears in the c-surface. The c-surface was positioned as close as possible to the focal depth which was typically in the range of 1.0–2.5 cm.
Clinical Obstetrics Environment
A total of seven healthy women whose pregnancies ranged from 17.9 to 36.3 weeks’ gestation were recruited from the University of Michigan Medical Center’s outpatient obstetrics clinic (6 singleton pregnancies, 1 twin pregnancy). Patients were undergoing routine ultrasound examination. Each patient provided fully informed written consent to an IRB-approved protocol involving transcutaneous measurement of fetal blood flow with ultrasound. Fetal weight was estimated based on measurements recorded at the same time as the umbilical volume flow measurements. Pregnancy outcomes were abstracted from the medical records of the recruited patients.
A GE LOGIQ 9 ultrasound system equipped with a 2.0–5.0 MHz probe (4D3CL) was used to acquire 4D (near real-time 3D) color Doppler image volumes. The position and tilt angle of the probe was adjusted by visualizing a free loop of the umbilical cord in the lateral-elevational imaging plane. The orientation of the probe was maintained in the position where the c-surface fully intersected the umbilical cord’s two arteries and single vein with adequate margins. The c-surface was positioned as close as possible to the focal depth, which was at 6.5 cm for most cases, but ranged from 5.0–8.0 cm depending on the position of the cord.
Data Analysis
For both the fetal sheep and clinical obstetric studies, multi-volume data sets consisting of 50 volumes were acquired sequentially at a rate of one volume every 10 seconds (respiratory gating was not used). The 50 volumes were randomly spaced in time to ensure appropriate sampling of flow throughout the cardiac cycle. The selected volume of interest was held fixed throughout the 50-volume acquisition for each data set. In the clinical study, time permitted for two patients (4 & 6) to have a second 50-volume data set recorded at a different position along the cord for comparison with the first data set.
The GE LOGIQ 9 is equipped with the current Digital Imaging and Communications in Medicine standard software (DICOM, Medical Imaging & Technology Alliance, Arlington, VA, USA), which allowed the user to store 4D duplex mode data and the associated scanner acquisition settings for prospective analysis. The authors had full access to data sets stored in the proprietary digital DICOM file format.
Data were exported to an off-line computer and analyzed using algorithms implemented in Matlab 7 (The MathWorks Inc., Natnick, MA, USA). In Matlab, a constant depth cross-sectional surface that encompassed the umbilical cord’s vessels was extracted from the focus (or from near the focus) of the acquired 3D volume. Volumetric flow was computed by surface integration of Doppler-measured velocity vectors (SIVV) in the c-surface defined above.14 Power Doppler data were used to correct for partial volume effects by weighting flow estimates in reference to pixels containing 100% blood.12,13,15
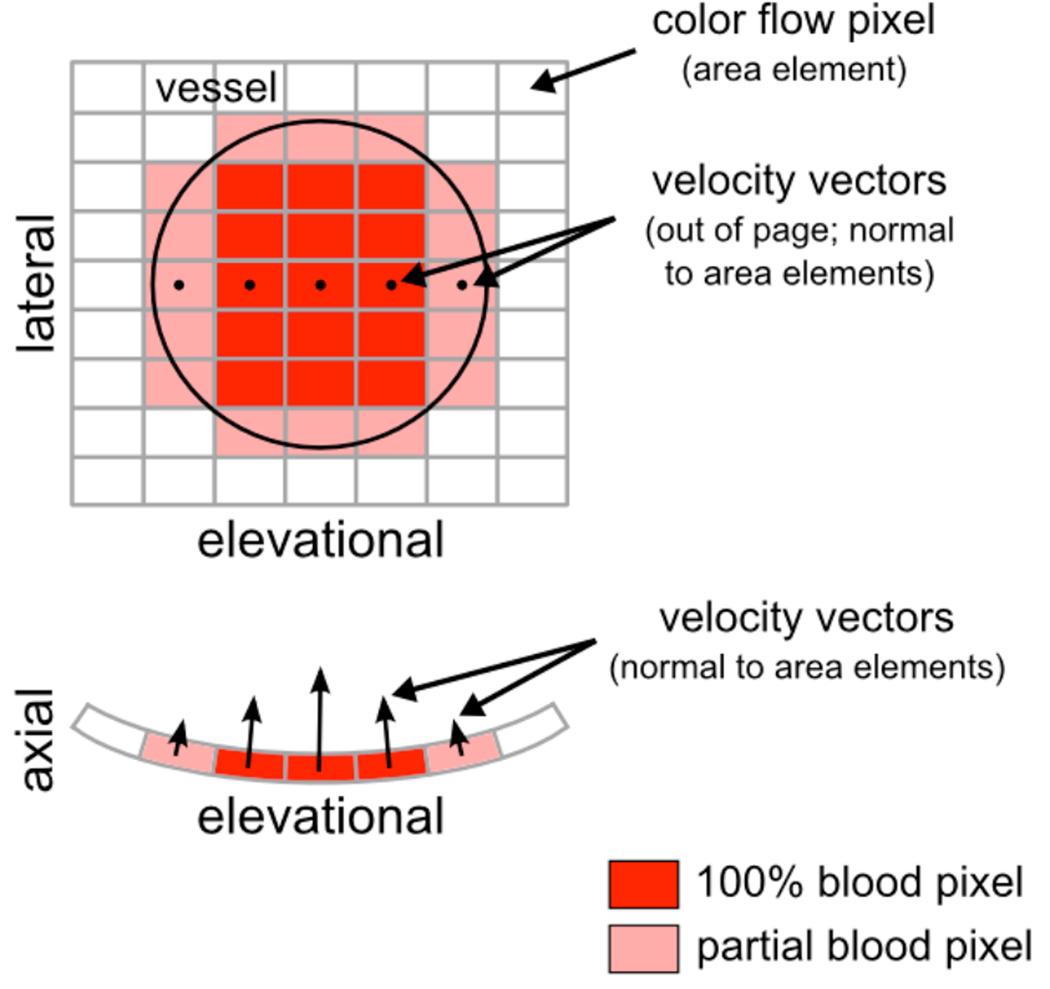
Figure 1 illustrates the principles of power-weighted SIVV for the simplified case of a single vessel positioned through the lateral-elevational imaging plane, or c-surface. Three types of color flow pixels exist: those inside the vessel (dark red), those partially inside the vessel (light red), and those outside the vessel (white). Each color flow pixel in Figure 1 is associated with an area element, but pixels that intersect the vessel also have a corresponding velocity vector. Volume flow for an individual color flow pixel can be computed using the equation Q = v × A, where v is velocity and A is area. Summation of these individual volume flow estimates over all pixels in the c-surface yields the total volume flow through the vessel. Note that the straightforward multiplication given by Q = v × A applies only when the velocity vector is normal, or perpendicular, to the area element. This requirement is satisfied inherently by the scanning geometry of the transducer and is illustrated in Figure 1 by the curved surface of the axial-elevational imaging plane.
Figure 1.
Power-weighted surface integration of Doppler-measured velocity vectors (SIVV). A single vessel is positioned in the center of the c-surface as illustrated by the black outline in the lateral-elevational imaging plane. Each velocity vector is normal to its respective area element. The curvature of the scanning geometry is shown by the surface of the axial-elevational imaging plane. Velocity vectors for one row of pixels only are shown in both the lateral-elevational and axial-elevational imaging planes; however, note that every pixel that intersects the vessel will have an associated velocity vector.
The volume flow for color flow pixels positioned fully inside the vessel (dark red pixels in Figure 1) can be computed as described above. However, volume flow for color flow pixels that only partially intersect the vessel (light red pixels in Figure 1) must be weighted to reflect the fraction of blood, or vessel, intersected by the area element. Power Doppler, the signal of which is assumed directly proportional to the number of scattering red blood cells, provides this weighting factor. In the fetus, proportionality is supported by the absence of rouleaux;17 therefore, the power Doppler signal is highest for pixels fully inside the vessel and tapers off as the area element crosses the vessel boundary. The weighting factor is applied to the volume flow estimate as follows: Q = (v × A) × w, where 0 ≤ w ≤ 1. For example, w = 0.2 indicates a pixel containing 20% blood, w = 0.8 indicates a pixel containing 80% blood, and w = 1.0 indicates a pixel containing 100% blood, i.e., a pixel fully inside the vessel. The fraction of blood, w, in a partial volumed pixel is computed in reference to the power in pixels containing 100% blood.
Velocity and power data from each individual volume in a 50-volume data set were used to compute a single power-weighted SIVV volume flow estimate. The overall flow estimate for the entire 50-volume data set was then computed by averaging each of the 50 individual volume flow estimates. This approach for computing flow is particularly important and valuable when there is movement of the vessels of interest. During the clinical evaluation studies, movement of the fetus or mother could shift the cord within the scanning volume of interest. But, as long as the vessel of interest can be identified in the image volume and its cross section fully imaged in the c-surface, an estimate of volume flow can be made even if the vessel has moved (the SIVV method is Doppler angle and position independent). Volume flow estimates for individual 3D image volumes will vary due to noise contributions such as speckle; however, the average of the individual flow estimates should yield the correct result.
Results
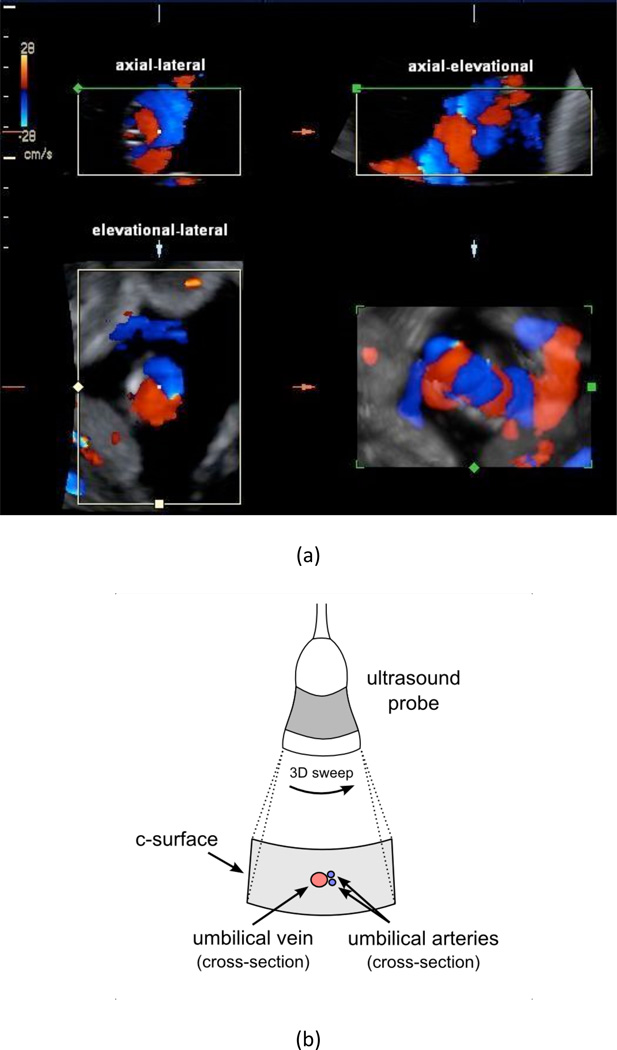
Figure 2 illustrates how the umbilical cord was positioned in the three orthogonal imaging planes for all studies performed. Figure 2a shows an example of a single volumetric scan presented in the standard four-panel view available on the GE LOGIQ 9 in 4D color-flow mode. Orienting the cross-section of the vessels in the c-surface as described in Figure 2 is the key for successful flow estimation. The umbilical cord was positioned in the center of the c-surface as shown in the lateral-elevational imaging plane of Figure 2a and illustrated in the schematic of Figure 2b. Note that in this sample image the two arteries are not completely identified, but the blooming was resolved using power Doppler for partial volume correction.
Figure 2.
(a) Four-panel view of a single 3D color flow acquisition of the umbilical cord of Patient 6a (P6a see Figure 6). The four views are as follows: upper-left is axial-lateral, upper-right is axial-elevational, bottom-left is elevational-lateral (i.e., the c-surface), and bottom-right is a rendered 3D reconstruction. The upper-left, upper-right, and bottom-left panels coincide at the center point that is marked in each view. Arteries are shown in blue and the vein is shown in red. The schematic in (b) illustrates the orientation of the probe and the corresponding c-surface in the elevational-lateral imaging plane. The vessel colors in (b) are opposite of convention in order to match the directionality in (a). The entire umbilical cord passes through the c-surface but only the cross-sections of the umbilical arteries and umbilical vein are illustrated in (b).
Fetal Sheep Model
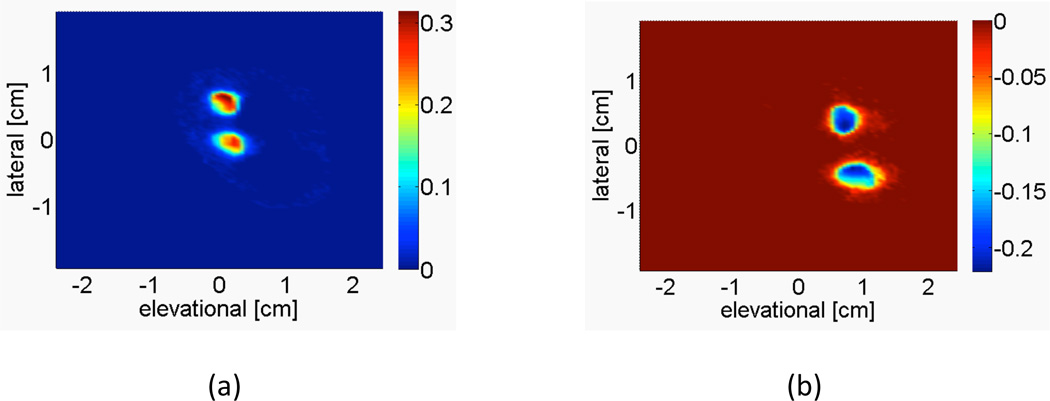
Figure 3 shows a representative image of the averaged power-weighted Doppler-measured velocities of the c-surface intersecting the two umbilical arteries and two umbilical veins in the fetal sheep model. The vessels are segmented by directional criteria to separate arterial and venous flow.
Figure 3.
Representative image from sheep subject 5 showing the power-weighted Doppler-measured velocities of the c-surface intersecting the (a) fetal umbilical arteries and (b) fetal umbilical veins, at a depth of 1.87 cm. Integrating over this c-surface yields the volume flow estimate. The color bar indicates the average power-weighted Doppler-measured velocity in m/s.
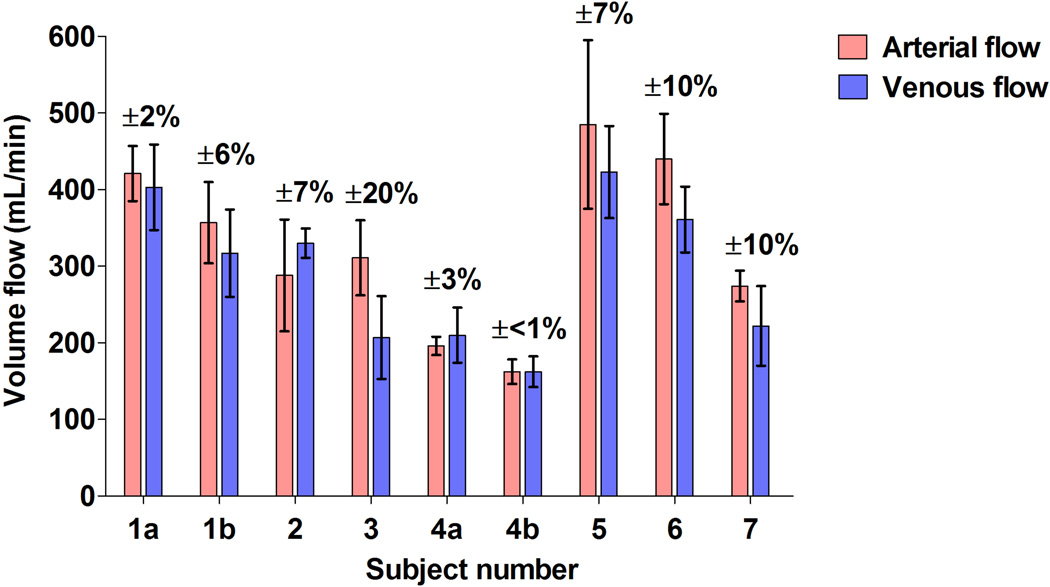
Figure 4 provides comparisons between the umbilical arterial and venous volume flow estimates for the seven ewes investigated. A natural means of comparison for verifying the results is provided by the fact that the average blood flow in the umbilical arteries and umbilical veins must be equal. An image mask was required for studies 1a, 3, and 5 in order to isolate umbilical vessels from surrounding color artifacts. The error bars indicate the standard deviation of the 50 individual volume flow estimates used to obtain the mean arterial or venous flow. Overall, the percent error relative to the average measured arterial/venous flow is 10% or less for eight out of the nine measurements. For the measurement with an error of 20% (Figure 4, Subject 3), inspection of the individual venous volume flow estimates reveals a drift to lower flow values over the acquisition time and thus reduces the overall venous flow.
Figure 4.
Comparisons between the umbilical arterial and venous volume flow estimates made by power-weighted surface integration of velocity vectors in seven pregnant ewes. The percent error is computed relative to the average measured arterial/venous flow and indicates the error variation about this mean. Error bars represent the standard deviation of the 50 individual volume flow estimates. (a,b) refer to repeated acquisitions in the same subject.
Clinical Obstetrics Environment
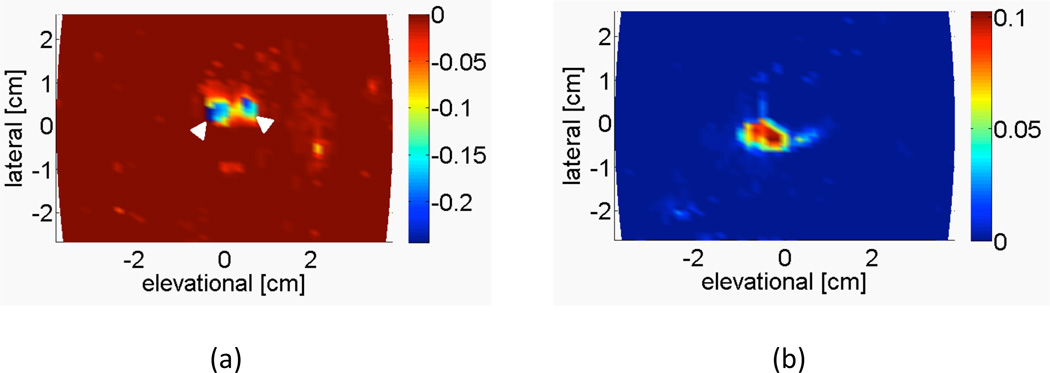
Figure 5 shows an example of the averaged power-weighted Doppler-measured velocities from the c-surface intersecting the two umbilical arteries and umbilical vein. Again, the vessels are segmented by directional criteria.
Figure 5.
Representative image from Patient 6a showing the power-weighted Doppler-measured velocities of the c-surface intersecting the (a) two umbilical arteries (white arrowheads) and (b) single umbilical vein, at a depth of 6.63 cm. Integrating over this c-surface yields the volume flow estimate. The color bar indicates the average power-weighted Doppler-measured velocity in m/s.
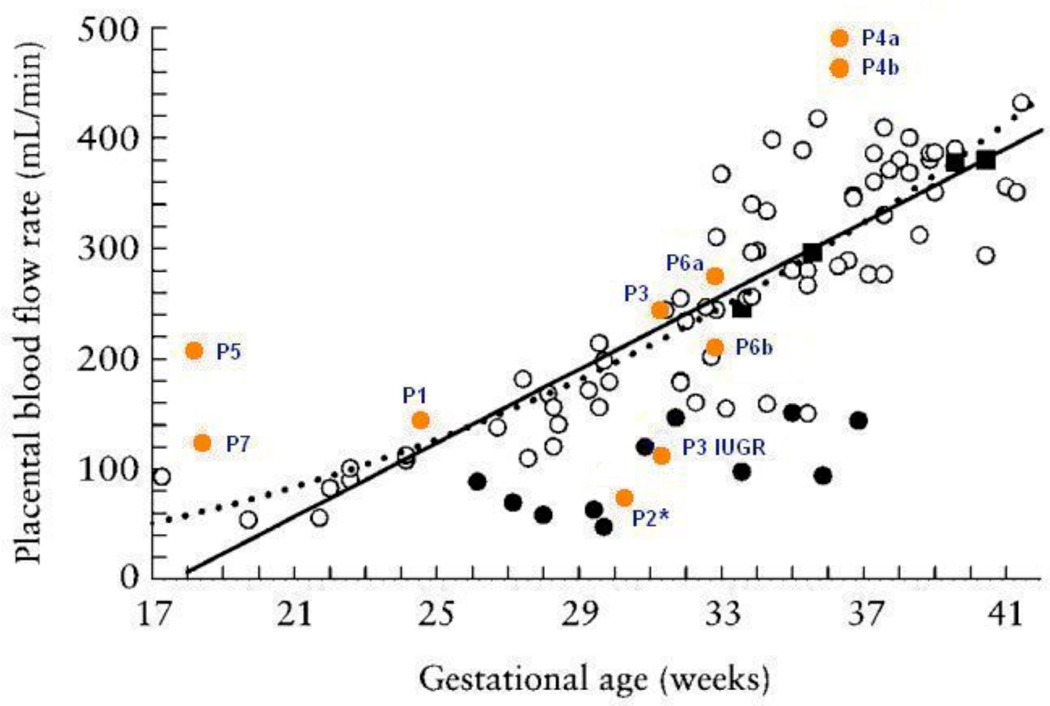
Umbilical venous blood volume flow estimates as a function of gestational age were compared to results reported in the literature by Tchirikov et al.9, who measured flow using traditional 2D spectral Doppler. Figure 6 shows the venous flow estimates from the seven patients of this study superimposed onto the venous flow estimates from Figure 3 of the Tchirikov et al.9 study. Results from this study are labeled with the patient number and are shown as closed orange circles. It should be noted that the c-surface for computing volume flow was positioned 0.5 cm deep to the focus for Patients 1, 2, and 7 in order to have a proper view of the vessels.
Figure 6.
Venous flow estimates from the seven patients of this study (made by power-weighted surface integration of velocity vectors) superimposed onto venous flow estimates from Figure 3 of the Tchirikov et al.9 study. The patient results from this study are shown as closed orange circles. Subjects are identified with the letter ‘P’ followed by the corresponding patient number and (a,b) refer to measurements taken at two different positions along the same subject’s cord. ‘P3 IUGR’ refers to a case that was diagnosed as IUGR subsequent to the volume flow ultrasound scan. ‘P2*’ refers to a case that developed preeclampsia subsequent to the volume flow ultrasound scan. The results from Tchirikov et al.9 show open black circles for normal gestations, closed black circles for IUGR compromised gestations, and closed black squares where normal flow was detected but the outcome score was the lowest possible value in the pathological group. Solid and dotted lines represent a linear and power function regression of controls, respectively, as they appear in the Tchirikov et al.9 study.
Patients 4 and 6 had measurements taken at two different positions along the cord and their corresponding estimates show reasonable reproducibility. Overall, while there is some variation in the flow estimates at low (e.g., Patient 5) and high (e.g., Patient 4) gestational ages, the results are encouraging at intermediate gestational ages. There was one case that was diagnosed as IUGR (Patient 3 had twins; one normal, one IUGR) that was unknown at the time of the study, but whose estimated flow was consistent with the IUGR subjects of Figure 6 (‘P3 IUGR’). The flow of the normal fetus of Patient 3 (‘P3’) was consistent with the normal gestation grouping of the Tchirikov et al.9 study. Patient 2 was observed to have a normal gestation at the time of volume flow ultrasound but showed an unusually low flow of 71 mL/min for 30.2 weeks gestation. Approximately two weeks later the patient developed preeclampsia and the fetus was delivered early at 32.6 weeks. The neonatal weight was at the 11th percentile.
Discussion
Measurement of umbilical cord blood volume flow in both a fetal sheep model and human subjects has been demonstrated using the volume flow measurement technique described by Kripfgans et al.12 and Richards et al.13; however, the updated method presented in this paper includes an added modification that enables flow computation on individual volumes, which ensures the technique is suitable for clinical obstetric screenings. The presented volume flow measurement technique is attractive because it overcomes virtually all the limitations associated with traditional pulsed-wave Doppler methods and ultimately provides a reliable and consistent means to assess placental blood flow and manage at-risk pregnancies.
The umbilical cord is particularly well suited for volume flow measurement due to characteristic features of the imaging environment. First, the umbilical cord is floating in amniotic fluid, which is relatively free of background scattering materials when compared to the soft tissue background that typically surrounds blood vessels in other sites of the body. Therefore, the need for background clutter discrimination and removal, which is required for Doppler flow imaging, is minimized when evaluating umbilical cord flow. Second, there is a natural means of comparison between blood flow in the umbilical arteries and the umbilical vein because on average the arterial and venous flows must be equal. This characteristic, which is uncommon in other in vivo locations, enables one to verify the results in a benign, non-invasive manner. Third, the measurement of umbilical flow has a compelling clinical application because it enables the detection and identification of fetuses at risk for IUGR.
In contrast, the umbilical cord presents new challenges for blood volume flow measurement. For example, in the range of gestational ages investigated in this study, each umbilical artery is expected to increase in diameter from 1.9 to 3.7 mm and the vein from 3.6 to 7.6 mm.18 In the presence of such small vessels, it is a challenge to position a group of ultrasound beams completely in either the arteries or the vein and therefore a 100% blood estimate may not always be available for partial volume correction. As an alternative, other areas at similar depth to the umbilical cord, such as the fetal heart, could provide a 100% blood estimate for partial volume correction.
Motion of the fetus that includes active kicking or hitting of the cord can also be problematic for flow measurements. A moving target can increase the apparent size of the umbilical vessels due to smearing (if the cord moves during a volume acquisition) or the umbilical vessels can be kicked outside the region of interest at which point a volume flow measurement is not possible. Motion of the fetus is particularly important to consider when a mechanical 3D probe is used for volume acquisition. In this study, approximately 8 minutes were required to obtain a sufficient number of samples for a statistically valid flow estimate. Although acquisition time for the multi-volume data set is rather long, the method of computing volume flow on individual volumes, as described in this paper, minimizes inappropriate averaging in the presence of motion. Furthermore, a 2D electronic ultrasound array can sweep 3D volumes more rapidly than a mechanical 3D probe and therefore acquisition would be even less dependent on the fetus’ cooperation. Previous studies13 have shown that even in pulsatile flow conditions relative errors as small as 5% can be achieved after only 15 volume samples have been acquired. Two-dimensional electronic ultrasound arrays could acquire such a small number of samples in seconds. In the presence of constant flow, such as the umbilical vein, even fewer samples and less time would be required for equivalent accuracies.
Despite these challenges, estimates of volume flow with the proposed technique12,13 are no longer dependent on the angle of insonation, the geometry of the blood vessels being sampled, or the flow profiles in the vessels. All of these properties are advantageous when imaging the umbilical cord because it can be difficult to angle correct tortuous and spiraling vessels, the umbilical vein often lacks a circular cross section, and tortuous vessels can induce asymmetric flow profiles. Literature emphasizes the importance of measuring umbilical cord blood flow,9,19–21 but unfortunately the measurement is not part of the standard fetal survey due to the unreliability and difficulty in making the measurement using traditional techniques.
The preliminary data presented in this paper indicates relatively good agreement between the arterial and venous measurements in the seven ewes. The percent error relative to the average measured arterial/venous flow is 10% or less for eight out of the nine measurements. In addition, the results from the clinical evaluation show good agreement with the results from the Tchirikov et al.9 study at intermediate gestational ages. Variation in the clinical measurements is largely due to the reduced vessel size and positional variation of the cord induced by fetal motion. The acquisition of the sheep data did not suffer from these two limitations because the higher-frequency transducer was physically attached to the umbilical cord. Out of the seven patients in the clinical study, a proven case of IUGR and a proven case of preeclampsia were demonstrated. While neither case was suspected at the time of patient recruitment, both cases showed lower flow than anticipated for gestational age as indicated on Figure 6.
Absolute truth measurements for arterial and venous flows could not be obtained with the sheep data because the volume flow study was performed secondary to an investigational study of an artificial placenta16 where the attachment of flow meters to vessels in the cord could compromise those studies. One of the limiting factors in the measurement of clinical umbilical flow is the lack of a gold standard for comparison since both electromagnetic and ultrasonic flow meters are invasive. This limitation exists for all patient studies including the present one; however, unlike the present study, all other patient studies measuring umbilical cord blood flow using Doppler ultrasound also suffer from the angle-, vessel geometry-, and flow profile-related limitations described above.
Accurate measurements of umbilical blood volume flow can be performed with relative ease using the proposed three-dimensional ultrasound flow measurement technique. This method is superior to traditional pulsed-wave Doppler flow measurement and can yield reliable and consistent flow estimates to facilitate the management and timing of delivery of at-risk pregnancies. Once implemented on clinical ultrasound scanners, the proposed method could operate in real-time similar to standard color flow imaging. Therefore, measurements of umbilical cord blood flow would be straightforward and performed as part of routine fetal surveys.
Although a limited number of patients were recruited in this study, the results indicate consistency with venous flow estimates reported in the literature and encourage further development of SIVV for umbilical flow measurement. Future work will involve studies that verify flow estimates in the sheep umbilical cord with absolute truth flow meter measurements, as well as studies in ongoing pregnancies to further correlate umbilical flow with pregnancy outcomes.
Acknowledgements
We thank Tchirikov et al (Ultrasound Obstet Gynecol 2002; 20:580–585) for use of their published results. This research was funded in part by National Institutes of Health grant R01 HL67921 and by a research grant from GE Healthcare.
Abbreviations
- 4D
4-dimensional
- IUGR
intrauterine growth restriction
- SIVV
surface integration of Doppler-measured velocity vectors
- 3D
3-dimensional
- 2D
2-dimensional
References
- 1.Grivell R, Dodd J, Robinson J. The prevention and treatment of intrauterine growth restriction. Best Pract Res Clin Obstet Gynaecol. 2009;23:795–807. doi: 10.1016/j.bpobgyn.2009.06.004. [DOI] [PubMed] [Google Scholar]
- 2.Mahsud-Dornan S, Dornan JC. IUGR: a contemporary review. Best Pract Res Clin Obstet Gynaecol. 2009;23:739–740. doi: 10.1016/j.bpobgyn.2009.08.003. [DOI] [PubMed] [Google Scholar]
- 3.Boers KE, Vijgen SMC, Bijlenga D, et al. Induction versus expectant monitoring for intrauterine growth restriction at term: randomised equivalence trial (DIGITAT) BMJ. 2010;341:c7087. doi: 10.1136/bmj.c7087. [DOI] [PMC free article] [PubMed] [Google Scholar]
- 4.Laurin J, Lingman G, Marsal K, Persson PH. Fetal blood flow in pregnancies complicated by intrauterine growth retardation. Obstet Gynecol. 1987;69:895–902. [PubMed] [Google Scholar]
- 5.Ferrazzi E, Rigano S, Bozzo M, et al. Umbilical vein blood flow in growth-restricted fetuses. Ultrasound Obstet Gynecol. 2000;16:432–438. doi: 10.1046/j.1469-0705.2000.00208.x. [DOI] [PubMed] [Google Scholar]
- 6.Rigano S, Bozzo M, Ferrazzi E, Bellotti M, Battaglia FC, Galan HL. Early and persistent reduction in umbilical vein blood flow in the growth-restricted fetus: a longitudinal study. Am J Obstet Gynecol. 2001;185:834–838. doi: 10.1067/mob.2001.117356. [DOI] [PubMed] [Google Scholar]
- 7.Boito S, Struijk PC, Ursem NT, Stijnen T, Wladimiroff JW. Umbilical venous volume flow in the normally developing and growth-restricted human fetus. Ultrasound Obstet Gynecol. 2002;19:344–349. doi: 10.1046/j.1469-0705.2002.00671.x. [DOI] [PubMed] [Google Scholar]
- 8.Di Naro E, Raio L, Ghezzi F, Franchi M, Romano F, Addario VD. Longitudinal umbilical vein blood flow changes in normal and growth-retarded fetuses. Acta Obstet Gynecol Scand. 2002;81:527–533. [PubMed] [Google Scholar]
- 9.Tchirikov M, Rybakowski C, Huneke B, Schoder V, Schroder HJ. Umbilical vein blood volume flow rate and umbilical artery pulsatility as 'venous-arterial index' in the prediction of neonatal compromise. Ultrasound Obstet Gynecol. 2002;20:580–585. doi: 10.1046/j.1469-0705.2002.00832.x. [DOI] [PubMed] [Google Scholar]
- 10.Eik-Nes SH, Brubakk AO, Ulstein MK. Measurement of human fetal blood flow. Br Med J. 1980;280:283–284. doi: 10.1136/bmj.280.6210.283. [DOI] [PMC free article] [PubMed] [Google Scholar]
- 11.Eik-Nes SH, Marsal K, Brubakk AO, Kristofferson K, Ultstein M. Ultrasound measurement of human fetal blood flow. J Biomed Eng. 1982;4:28–36. doi: 10.1016/0141-5425(82)90023-1. [DOI] [PubMed] [Google Scholar]
- 12.Kripfgans OD, Rubin JM, Hall AL, Gordon MB, Fowlkes JB. Measurement of volumetric flow. J Ultrasound Med. 2006;25:1305–1311. doi: 10.7863/jum.2006.25.10.1305. [DOI] [PubMed] [Google Scholar]
- 13.Richards MS, Kripfgans OD, Rubin JM, Hall AL, Fowlkes JB. Mean volume flow estimation in pulsatile flow conditions. Ultrasound Med Biol. 2009;35:1880–1891. doi: 10.1016/j.ultrasmedbio.2009.04.025. [DOI] [PMC free article] [PubMed] [Google Scholar]
- 14.Sun Y, Ask P, Janerot-Sjoberg B, Eidenvall L, Loyd D, Wranne B. Estimation of volume flow rate by surface integration of velocity vectors from color Doppler images. J Am Soc Echocardiogr. 1995;8:904–914. doi: 10.1016/s0894-7317(05)80015-x. [DOI] [PubMed] [Google Scholar]
- 15.Rubin JM, Adler RS, Fowlkes JB, et al. Fractional moving blood volume: estimation with power Doppler US. Radiology. 1995;197:183–190. doi: 10.1148/radiology.197.1.7568820. [DOI] [PubMed] [Google Scholar]
- 16.Reoma JL, Rojas A, Kim AC, et al. Development of an artificial placenta I: pumpless arterio-venous extracorporeal life support in a neonatal sheep model. J Pediatr Surg. 2009;44:53–59. doi: 10.1016/j.jpedsurg.2008.10.009. [DOI] [PubMed] [Google Scholar]
- 17.Welsh AW, Rubin JM, Fowlkes JB, Fisk NM. Standardization of power Doppler quantification of blood flow in the human fetus using the aorta and inferior vena cava. Ultrasound Obstet Gynecol. 2005;26:33–43. doi: 10.1002/uog.1924. [DOI] [PubMed] [Google Scholar]
- 18.Weissman A, Jakobi P, Bronshtein M, Goldstein I. Sonographic measurements of the umbilical cord and vessels during normal pregnancies. J Ultrasound Med. 1994;13:11–14. doi: 10.7863/jum.1994.13.1.11. [DOI] [PubMed] [Google Scholar]
- 19.Ferrazzi E. Measurement of venous blood flow in the human fetus: a dream comes true, but now for some standardization. Ultrasound Obstet Gynecol. 2001;18:1–4. doi: 10.1046/j.1469-0705.2001.00491.x. [DOI] [PubMed] [Google Scholar]
- 20.Figueras F, Fernandez S, Hernandez-Andrade E, Gratacos E. Umbilical venous blood flow measurement: accuracy and reproducibility. Ultrasound Obstet Gynecol. 2008;32:587–591. doi: 10.1002/uog.5306. [DOI] [PubMed] [Google Scholar]
- 21.Moran M, McAuliffe FM. Imaging and assessment of placental function. J Clin Ultrasound. 2011;39:390–398. doi: 10.1002/jcu.20846. [DOI] [PubMed] [Google Scholar]


