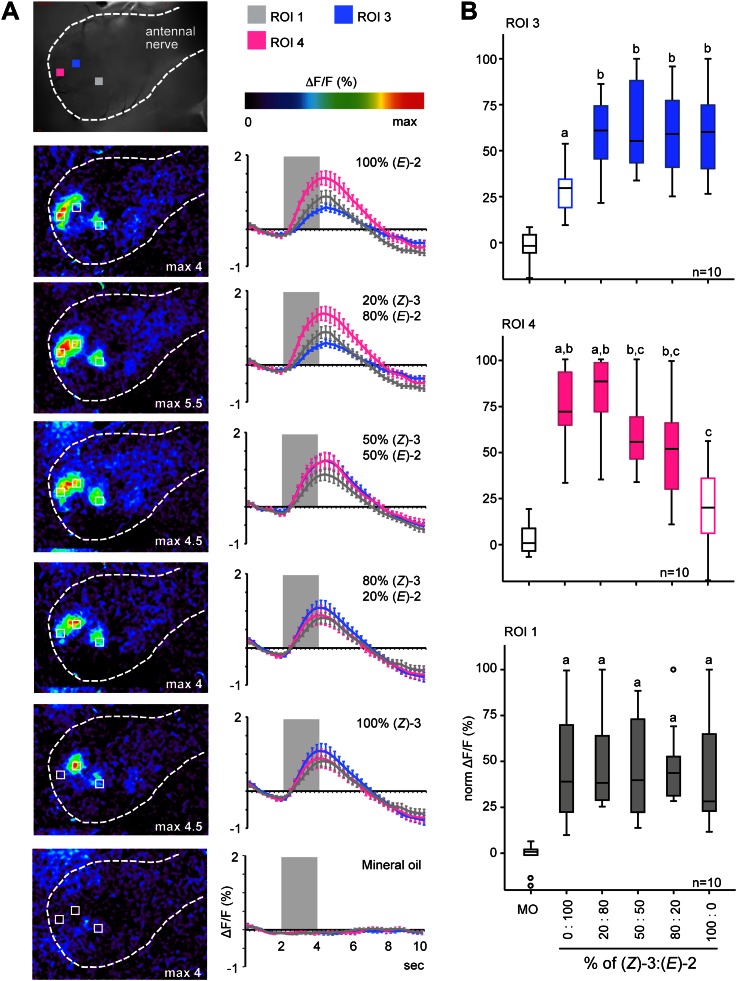
Figure 5. Female antennal lobe (AL) shows isomer-specific calcium responses to (Z)-3- and (E)-2-hexenyl acetate.
(A) Representative false color-coded images show calcium responses in the AL after odor stimulation with isomeric mixtures of a total dose of 250 ng. Images are individually scaled to the strongest activation (given by the max value in each image). Time traces show activity of ROI 1, 3 and 4 (n = 10) in response to odor stimulation (2 s; grey bar). Error bars represent standard error of mean. For raw data, see F5A_AllmannSpaethe2012_timetraceshexenylacetate.xlsx (Dryad: Allmann et al., 2012). (B) Change in fluorescence in ROI 1, 3 and 4 to the pure structural isomers and their mixtures, normalized to the highest activation in every animal. Filled boxes represent responses significantly different from the mineral oil (MO) control; different letters denote significantly different calcium responses (Kruskal–Wallis and Dunn’s multiple comparison test). For raw data, see F5BCE_AllmannSpaethe2012_imaginghexenylacetate.xlsx (Dryad: Allmann et al., 2012).

