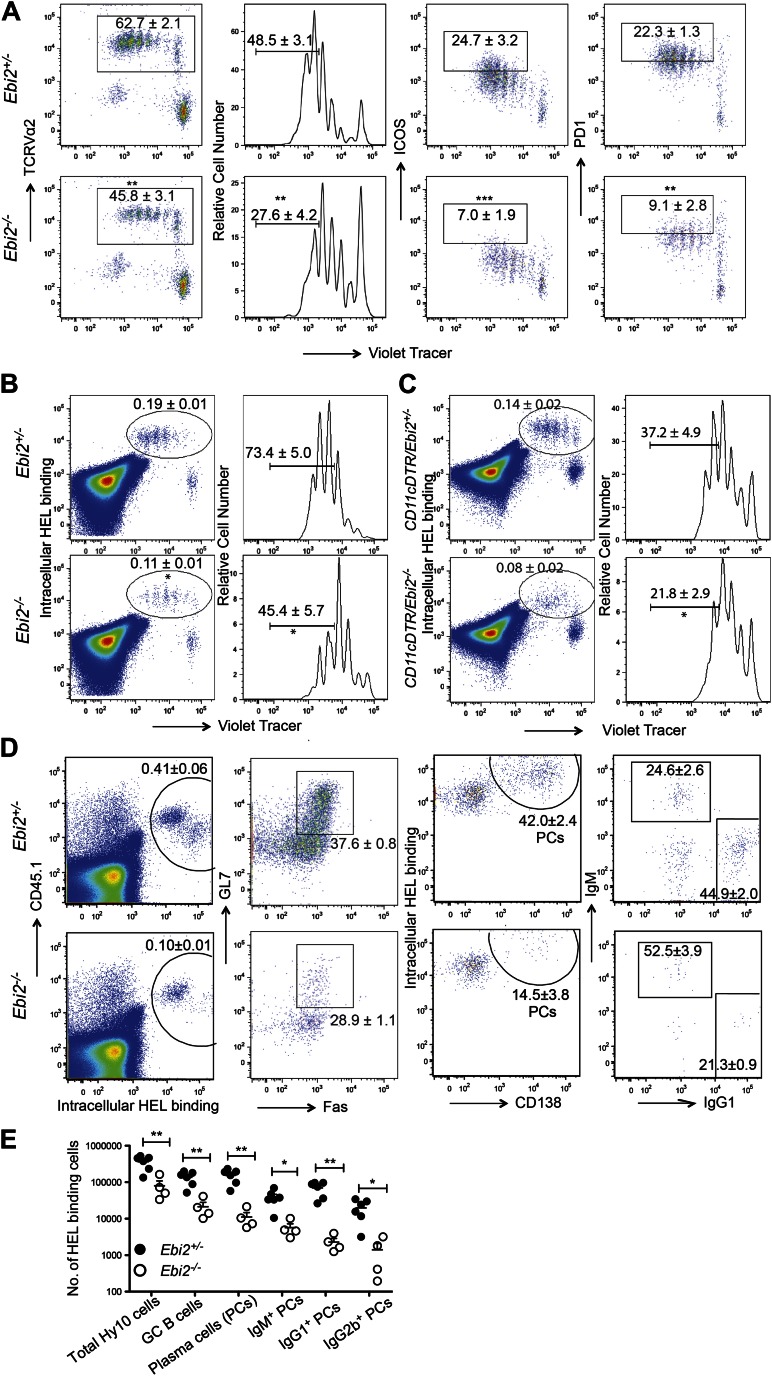
Figure 7. DC deficiency in Ebi2−/− mice is associated with a reduced ability to support CD4 T cell and B cell responses to particulate antigen.
(A) CD45.1+ OTII splenocytes were labeled with cell trace violet and adoptively transferred into Ebi2+/− and Ebi2−/− mice. 1 day after transfer, mice were immunized with SRBC-OVA conjugate. 3 days post immunization, OTII T cell proliferation and expression of ICOS and PD1 was examined by flow cytometry. Left panels are pre-gated on CD45.1+CD45.2− cells and right three panels are further gated on TCR Vα2+ OTII cells. Numbers on gates indicate mean (±SE) frequencies for seven mice combined from two experiments. (B) and (C) Cell trace violet labeled Hy10 splenocytes were transferred into Ebi2+/− or Ebi2−/− recipients (B) or 1:1 mixed CD11cDTR and Ebi2+/− or Ebi2−/− BM chimeras (C). 1 day after cell transfer, mice were immunized with SRBC-HEL2x and flow cytometric analysis of Hy10 B cell frequency and proliferation was conducted at day 3 after immunization. Hy10 B cells were identified as intracellular HEL-binding cells. For (C), mice were treated with DT at the day of Hy10 B cell transfer and again 2 days after cell transfer. Mean (±SE) cell frequency is shown next to each gate (n = 5–9 mice combined from two to three replicated experiments). (D) and (E) CD45.1+ Hy10 splenocytes were transferred into Ebi2+/− or Ebi2−/− recipients and mice were immunized with SRBC-HEL2x. 5 days after immunization, HEL-binding Hy10 B cells and HEL-specific plasma cells of different Ig isotypes were quantified by flow cytometric analysis. Frequencies of GC B cells and total plasma cells are shown in plots (middle two panels) pre-gated on Hy10 B cells (gate shown in left panels). Frequencies of IgG1+ plasma cell are shown in plots (right panels) pre-gated on Hy10 plasma cells. Numbers on plots in D indicate mean (±SE) cell frequencies in the indicated gates and graph in (E) provides a summary of total HEL-binding cell numbers of the indicated types. Data are representative of three replicated experiments with four to six mice in each experiment. Each dot represents an individual mouse. *p<0.05, **p<0.01, ***p<0.001, by Student’s T-test.


