Figure 5.
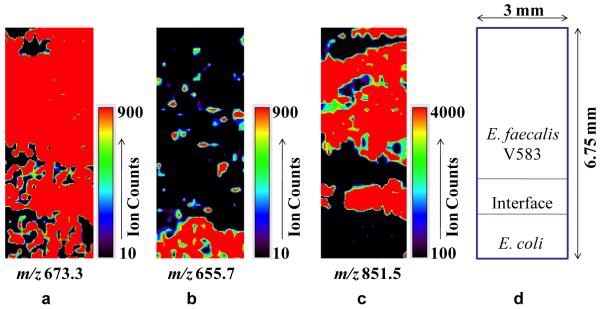
MALDI-MS images of cocultured biofilms of E. faecalis V583 and E. coli showing spatial distributions of three ions: (a) m/z 673.3, an endogenous peak observed in both species, (b) m/z 655.7, an E. coli specific peak, and (c) m/z 851.5 corresponding to the ARHPHPH peptide from E. faecalis. (d) is a cartoon showing the relative positions of each strain in the coculture and the absolute size of the images.

