Abstract
The full molecular consequences of oncogene activation during tumorigenesis are not well understood, but several studies have recently linked oncogene activation to epigenetic silencing of specific genes.1,2 Transcriptional repressor Id1 is overexpressed in many malignancies including melanoma, and Id1 targets include tumor suppressor genes TSP1, CDKN2A (p16) and CDKN1A (p21), which are frequently epigenetically silenced in cancer. We confirmed that both TSP1 and CDKN2A have abnormal promoter region DNa methylation in primary melanoma, but the mechanism by which this silencing occurs remains unknown. Here we explore the effects of stable lentiviral Id1 overexpression on the expression of these Id1 target genes in human melanoma cell lines. Overexpressed Id1 was functional and bound transcriptional activator E2A, but did not sequester E2A from gene promoters and repress gene expression. Therefore, these Id1 target genes were resistant to Id1-mediated gene silencing. Our results suggest that Id1 activation may need to occur at discrete stages in cooperation with additional gene dysregulation to repress and induce epigenetic silencing of tumor suppressor genes during melanoma progression.
Keywords: Id1, thrombospondin, melanoma, DNA methylation, oncogene
Introduction
The classic paradigm for cancer development and progression involves the accumulation of multiple genetic and epigenetic alterations that provide a selective growth advantage, promote invasion and support metastasis. One of the major challenges in fully understanding cancer biology is to delineate the genetic pathways and mechanisms involved in oncogene activation, tumor suppressor gene inactivation and DNA repair gene alteration.3 Studies have shown that oncogenes may directly mediate epigenetic silencing of tumor suppressor genes,4,5 and potential mechanisms by which this occurs are beginning to emerge.
Opavsky and colleagues found that oncogene activation influences methylation patterns, but selection for promoter hypermethylation is rare and random.6 Conversely, Gazin and colleagues suggest that oncogene activation targets methylation to specific genes in a coordinated and non-random manner.1 The distinctions between these two mechanisms may reflect differences among oncogenes and/or cell types and underscore the complexity of interactions between genetic and epigenetic pathways. Indeed, these two oncogene-mediated silencing mechanisms may not be mutually exclusive; they may operate in parallel within the cancer cell to silence tumor suppressor genes. However, the role that oncogene activation may play in epigenetically silencing tumor suppressor genes in melanoma is not known.
Among several well-characterized oncogenes in melanoma, inhibitor of DNA binding-1 (Id1) is a likely candidate for mediating epigenetic silencing since it represses tumor suppressor genes known to be frequently inactivated in melanoma. Id1 is a helix-loop-helix (HLH) indirect transcriptional repressor that binds basic HLH transcriptional activators including MyoD, E-proteins (E2A) and Ets proteins, and sequesters them from binding to target gene promoters, effectively reducing gene expression. Id1 overexpression is implicated in multiple malignancies, including melanoma, leukemia, intestinal adenomas7 and certain subtypes of breast cancer where its overexpression is associated with an aggressive phenotype and poor disease-free survival.8
Id1 overexpression is of particular interest in melanoma because Id1 transcriptionally represses CDKN2A (p16), a major melanoma susceptibility locus commonly inactivated by mutation and methylation.9,10 In a human melanocyte model, Id1 overexpression appeared to delay senescence by downregulating p16,11 although it is unclear whether Id overexpression is an obligate event for melanomagenesis and when repression of p16 might transition to epigenetic inactivation.
Id1 also represses CDKN1A (p21), another important cell cycle inhibitor, and thrombospondin-1 (TSP1), a potent angiogenesis inhibitor.12,13 Id1 overexpression is associated with reduced TSP1 expression and decreased survival in malignant melanoma.14 Moreover, preclinical melanoma models have shown that treatment with exogenous TSP1 alone (and with adjuvant radiation) suppressed primary tumor growth, inhibited metastasis and prolonged survival.15,16 While a clinical trial using TSP1 peptide ABT-510 to treat metastatic melanoma did not demonstrate definitive clinical benefit in patients, ABT-510 did decrease circulating VEGF-A and VEGF-C levels to suggest that escalating the dosage or using combinational therapy may provide some therapeutic benefit.17
The mechanistic relationship between overexpression of Id1 and methylation of p16 and TSP1 has not been explored in any cancer, including melanoma. Unlike PML-RARα, a direct transcriptional repressor that recruits DNA methyltransferases and histone methyltransferases to silence its target gene RARβ,4 an Id1-mediated mechanism must be indirect because Id1 does not directly bind DNA. However, chronic Id1 overexpression might permanently sequester transcriptional activators from target gene promoters, and such prolonged absence of activators could recruit epigenetic repressive complexes to methylate the gene promoter. Alternatively, an under-occupied promoter may become more vulnerable to encroachment from nearby silenced regions.
To study whether Id1 overexpression might initiate the establishment of abnormal methylation patterns or alter histone marks specifically at the TSP1, p16 and p21 promoters in melanoma, we stably overexpressed Id1 in melanoma cell lines using a lentiviral system. We assessed the effects of Id1 overexpression on cellular growth rate, cell cycle distribution, transcriptional repression and protein binding at target gene promoters.
Results
p16 and TSP1 are methylated in melanoma cell lines and primary melanoma
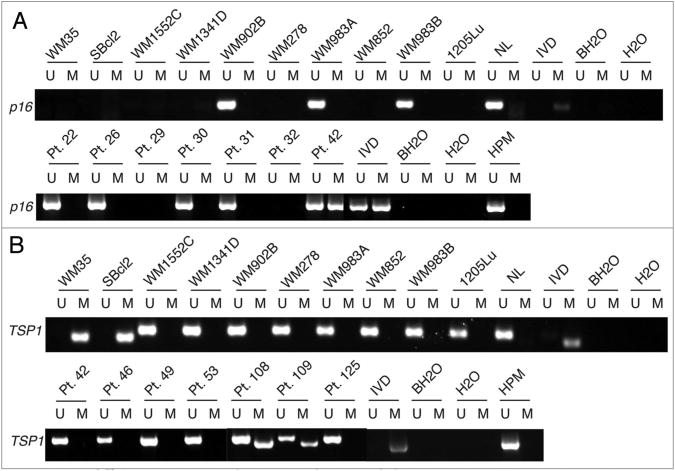
Methylation-specific PCR (MSP) was used to determine the DNA methylation status of CDKN2A (p16), CDKN1A (p21) and thrombospondin-1 (TSP1) promoter regions in ten human melanoma cells previously characterized for Id1 expression18 and in 37 human primary melanomas (Fig. 1A). We detected no p16 methylation in three lines with intact p16 and found homozygous deletions in the other seven cell lines. In primary melanoma, p16 methylation was present in 6% of cases (2/31 informative) and probable homozygous deletions were detected in 10% of cases (defined as a failure to amplify p16 while other genes were successfully amplified). This prevalence of p16 methylation is consistent with a study reporting this alteration in 10% of primary melanoma cases.19 We also found no p21 methylation in any of these cell lines as expected since p21 methylation appears to be unique to leukemia (data not shown).20
Figure 1.
p16 and TSP1 are methylated in melanoma cell lines and primary melanoma patient samples. (A) Msp results for p16 in melanoma cell lines (top) and representative patient samples (bottom). Normal lymphocytes (NL) or human primary melanocytes (HPM) were unmethylated controls and in vitro methylated DNA (IVD) was a methylated control. BH20 is bisulfite-treated no DNA control and H20 is no DNA control. (B) MSP results for TSP1 in melanoma cell lines (top) and representative patient samples (bottom).
TSP1 methylation has been previously described in several malignancies including colon carcinoma and neuroblastoma,21,22 but its methylation status has not been explored in melanoma. We found TSP1 methylation in 20% of melanoma cell lines and in 13% of primary melanomas (4/32 informative) (Fig. 1B). Significantly, TSP1 methylation occurred in the same cell lines with reported Id1 overexpression,18 suggesting a possible mechanistic link between Id1 overexpression and TSP1 methylation.
Id1 is highly overexpressed in the nucleus of Id1-infected melanoma cell lines
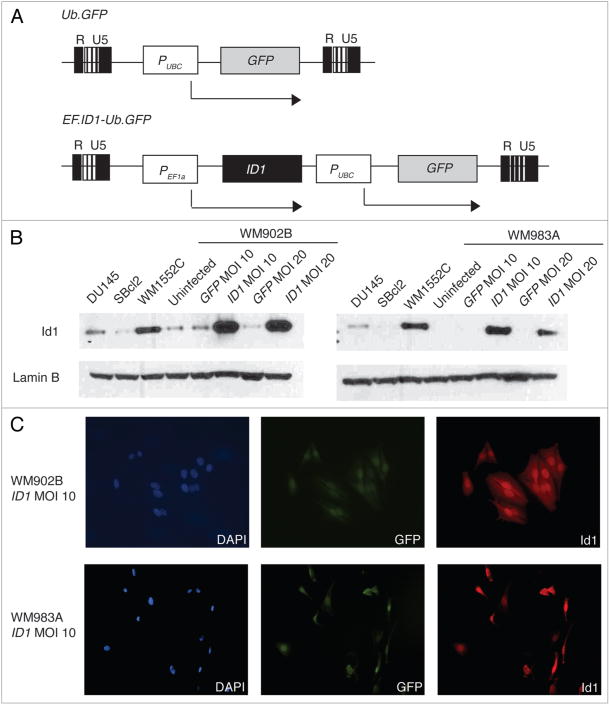
To examine whether there is in fact a causal relationship between Id1 overexpression and target gene silencing, we created stable Id1 overexpression in melanoma cell lines using a lentiviral system. The head-to-tail bicistronic lentiviral construct contains two strong, independent promoters for separate expression of both Id1 and GFP (Fig. 2A). Sequencing of the lentiviral construct confirmed that the Id1 coding sequence is wildtype. For this study, we selected early vertical-like melanoma cell lines WM902B and WM983A since they express low endogenous Id1 protein18 and high TSP1 RNA, the latter confirmed through real-time RT-PCR (data not shown). They also represent a critical stage during progression where Id1 activation in this melanoma phenotype might favor increased proliferation reflective of enhanced angiogenesis and metastasis. After 72 h of viral infection (74–88% efficiency) and sorting, we assessed RNA and protein levels of Id1 and its target genes. Western blots showed robust global Id1 overexpression in both infected melanoma cell lines (Fig. 2B). We immunostained the infected melanoma cell lines, demonstrating that Id1 was overexpressed predominantly in the nucleus and was present in each melanoma cell positive for GFP after sorting (Fig. 2C).
Figure 2.
Lentivirally-overexpressed Id1 localizes to the nucleus. (A) Maps of GFP mock lentiviral construct (top) show GFP controlled by the ubiquitin C (UBC) promoter and of ID1 lentiviral construct (bottom) show ID1 controlled by the elongation factor-1-alpha (EF1α) promoter. R U5 sites represent recombination sites used for viral integration into the cell line genome. single-headed arrows indicate the transcription start site for each gene. (B) Western blot of lentiviral Id1 overexpression in WM902B (right) and WM983A (left) at MOI 10 and 20 with DU145, WM1552C and SBcl2 Id1-positive controls. Uninfected and GFP mock WM902B and WM983A cells were ID1 construct-negative controls. Lamin B was a loading control. (C) Immunostaining of lentiviral Id1 overexpression in WM902B (top) and WM983A (bottom) at MOI 10. Nuclei were blue (left), GFp expression was green (middle) and Id1 overexpression was red (right). All images are at 20× magnification. Lamin B (not shown) was a staining efficiency control.
Id1 overexpression does not significantly alter cell growth rate
Since Id1 has been reported to regulate the G1/S cell cycle transition and Id1 overexpression delays senescence in melanocytes,11 we examined Id1-associated changes in growth rate and cell cycle distribution. Id1 overexpression correlated with a slight decrease in doubling time, but this difference was not statistically significant (2.13 ± 0.27 ID1 versus 2.22 ± 0.28 GFP mock MOI 10 in WM902B, p = 0.8284; 2.06 ± 0.30 ID1 versus 2.20 ± 0.10 GFP mock MOI 10 in WM983A, p = 0.6809, unpaired t test, Supp 1A and B). Similarly, there was no statistical difference in cell cycle distribution in Id1-overexpressing cells (ID1 versus GFP mock MOI 10 in WM902B, p = 0.9941; ID1 versus GFP mock MOI 10 in WM983A, p = 0.7841, chi-square test, Supp1C and D).
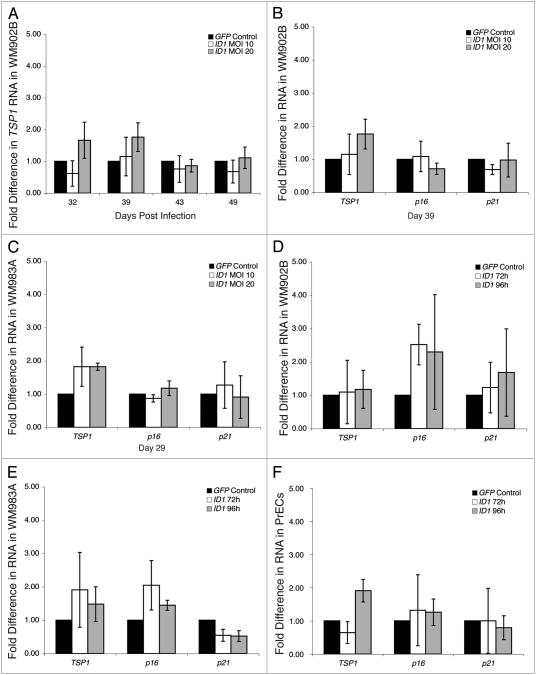
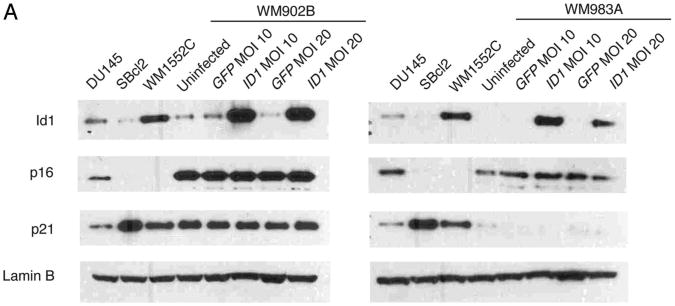
Previous reports have suggested that early growth profiles may not reflect the range of molecular changes related to Id1.10,11 Thus, we directly investigated the molecular effects of Id1 overexpression on TSP1, p16 and p21 transcription using real-time RT-PCR. However, in this context we found that TSP1 was not transcriptionally repressed by Id1 overexpression regardless of Id1 dosage, even when examined up to 170 d post-Id1 infection (Fig. 3A and data not shown). Since it is possible that Id1 overexpression affects only a subset of its target genes in melanoma cell lines, we also assessed p16 and p21 RNA levels in Id1-overexpressing cells. Like TSP1, we observed no transcriptional repression of p16 and p21 (Fig. 3B and C). Although the body of evidence suggests that downregulation of Id1 target genes is mediated exclusively through transcriptional repression, we examined TSP1, p16 and p21 by Western blot to ensure that they were not being post-translationally downregulated by Id1. As expected, TSP1, p16 and p21 protein levels were not reduced in Id1-overexpressing cells, and this result supports our real-time RT-PCR findings (Fig. 4A).
Figure 3.
Quantitative expression of TSP1, p16 and p21 in lentiviral Id1-overexpressing melanoma cell lines and prostate epithelial cells at MOI 5, 10 and 20. Real-time RT-PCR analysis was used to determine RNA levels of Id1 target genes in WM902B, WM983A and prECs. In each experimental group, RNA levels of Id1 target genes were normalized to GAPDH levels; normalized levels in Id1-overexpressing cells were shown relative to GFP mock cells as fold differences. Experiments were conducted in triplicate. (A) TSP1 RNA levels in WM902B during time course at MOI 10 and 20. (B) RNA levels of Id1 target genes in WM902B at day 39 at MOI 10 and 20. (C) RNA levels of Id1 target genes in WM983A at day 29 at MOI 10 and 20. (D) RNA levels of Id1 target genes in WM902B at 72 h and 96 h at MOI 5. (E) RNa levels of Id1 target genes in WM983A at 72 h and 96 h at MOI 5. (F) RNA levels of Id1 target genes in prEcs at 72 h and 96 h at MOI 5.
Figure 4A.
Id1 overexpression does not alter target gene protein levels. (A) Western blot of Id1, p16 and p21 in WM902B (right) and WM983A (left) at MOI 10 and 20 with DU145 Id1-positive and p16-positive control, SBcl2 Id1-positive and p16-negative control, and WM1552C Id1-positive and p16-negative control. Uninfected and GFP mock WM902B and WM983A cells were ID1 construct-negative controls. Lamin B was a loading control.
Id1 overexpression does not induce repression at early time points
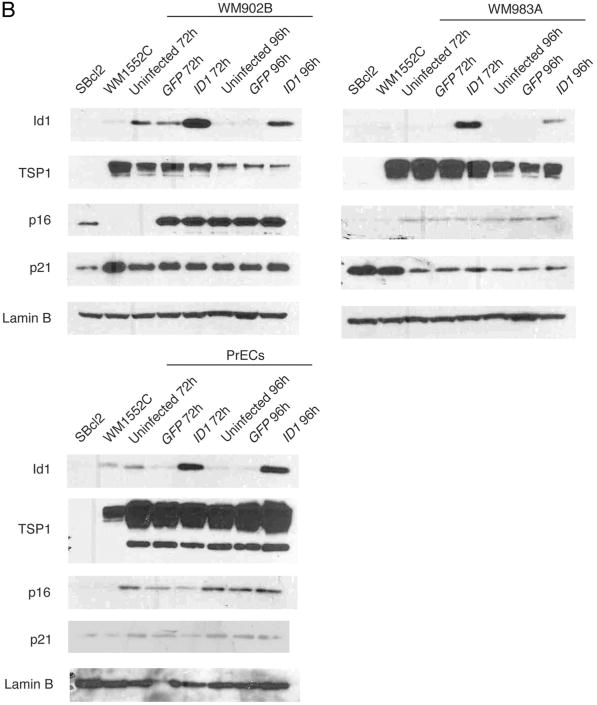
To exclude alternative explanations for the lack of Id1 target gene repression in this lentiviral model system, we examined the possibility that very high Id1 overexpression would be required to mediate repression and gene silencing, but because high Id1 protein levels might induce apoptosis in some cell types,23 these cells may be selected against during infection before sorting. In this case, early repression events would no longer be detected. A second possibility is that these melanoma cell lines have many dysregulated genes in key pathways that prevent or compensate for repression and silencing of Id1 target genes. To address these two possibilities in parallel, we overexpressed Id1 at MOI 5 in WM902B and WM983A and in early passage primary prostate epithelial cells (PrECs) and examined them at 72 h or 96 h postinfection. PrECs appear to be a relevant cell type for studying the effects of Id1 overexpression because TSP1 and p16 are expressed at relatively high levels, and Id1 is endogenously overexpressed in some prostate cancer cell lines including DU145 and primary prostate cancer.24 However, we found that even at these early time points and in PrECs, Id1 overexpression did not alter Id1 target gene RNA levels or protein levels in WM902B (Figs. 3D and 4B), WM983A (Figs. 3E and 4B) or PrECs (Figs. 3F and 4B).
Figure 4B.
Id1 overexpression does not alter target gene protein levels. (B) Western blot of Id1, p16 and p21 in WM902B (top left), WM983A (top right) and PrECs (bottom left) at MOI 5.
TSP1 is repressible and inducible in the Id1 overexpression model
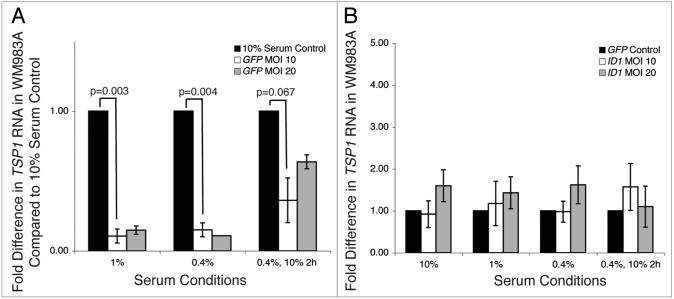
The real-time RT-PCR findings, supported by western data, suggest that these melanoma cell lines may not be responsive to transcriptional stimuli. It has been established that serum strongly and rapidly activates a serum response element in the TSP1 promoter, and thereby stimulates TSP1 transcription.25 To determine whether TSP1 transcription responds dynamically to stimuli in this system, we serum-starved WM983A for 36 h and then rescued them with 10% serum for 2 h. As expected, TSP1 transcription decreased with serum starvation and increased with serum refeeding (Fig. 5A). Therefore, TSP1 is capable of responding to transcriptional signals in these melanoma cell lines. To test whether TSP1 transcription responds to Id1 overexpression in the absence of the serum-activating signal, we serum depleted Id1-overexpressing WM983A, but found that serum depletion had no effect on Id1-mediated repression of TSP1 (Fig. 5B).
Figure 5.
Effects of serum depletion on TSP1 transcription in lentiviral Id1-overexpressing cell line WM983A. WM983A cells, normally maintained at 10% FBS, were serum-depleted at 1 or 0.4% for 36 h, or serum-depleted at 0.4% and then 10% serum-rescued for 2 h. Real-time RT-PCR analysis was used to determine TSP1 RNA levels in GFP mock cells (A) or Id1-overexpressing cells (B). In each experimental group, TSP1 levels were normalized to GAPDH levels and shown relative to control as fold differences. Experiments were conducted in triplicate. (A) TSP1 RNA levels in serum-depleted GFP mock cells, with normalized levels shown relative to 10% serum control. (B) TSP1 RNA levels in serum-depleted Id1-overexpressing cells, with normalized levels shown relative to GFP mock control.
Id1 binds but does not sufficiently sequester transcriptional activators
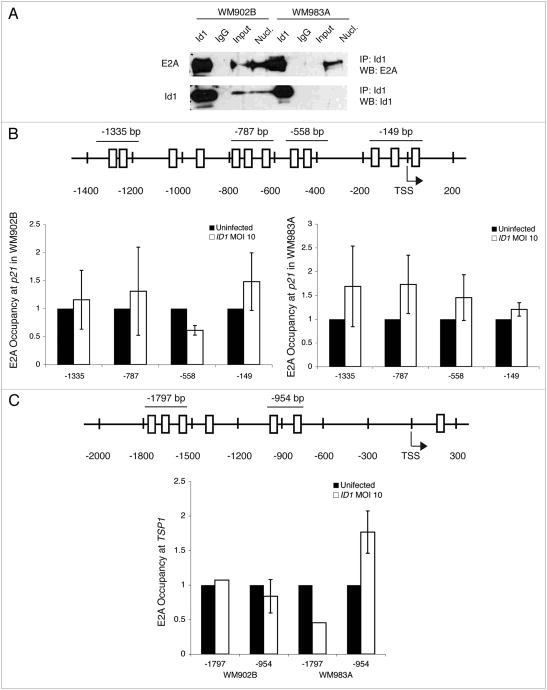
The Id1-overexpressing model system is transcriptionally responsive, but the possibility remains that overexpressed Id1 is not functional. To assess Id1 activity, we explored the well-characterized transcriptional relationship between E12/E47 (E2A) proteins and the p21 promoter. If Id1 is functional, we expect that it should bind E2A and this interaction would deplete E2A from the p21 promoter. To test the capacity of Id1 to physically interact with E2A, we used protein co-immunoprecipitation and found that overexpressed Id1 robustly co-immunoprecipitated with E2A in these melanoma cell lines (Fig. 6A). We next tested whether Id1 overexpression was sufficient to deplete E2A transcription factor binding at the p21 promoter using ChIP. We performed ChIP at four areas in the p21 promoter containing at least one E box element consensus site, including an area previously shown to mediate E2A-induced p21 transcription.26 We found that Id1 overexpression did not deplete E2A from any of the four sites at the p21 promoter (Fig. 6B). Although the functional relationship between E2A and TSP1 transcription has not been characterized as well as p21, E2A/TWIST heterodimers induce TSP1 in murine C3H10T1/2 multipotent mesenchymal cells.27 However, we observed no depletion of E2A in two regions, each containing at least one E-box element consensus site, upstream of the TSP1 transcription start site in Id1-overexpressing melanoma cell lines (Fig. 6C).
Figure 6.
Overexpressed Id1 can bind E2A protein, but is unable to deplete E2A at p21 and TSP1 promoters. (A) protein co-immunoprecipitation of overexpressed Id1 in WM902B and WM983A cells at MOI 10. protein extracts were immunoprecipitated with anti-Id1 antibody or anti-IgG antibody as a negative control. anti-E2A antibody was used to detect E2A in association with Id1, and anti-Id1 antibody was a positive control for immunoprecipitation. Nuclear extracts of WM902B and WM983A at MOI 10 (obtained using the pierce NE-PER Nuclear and Cytoplasmic Kit) were Id1-positive controls. For 5B and 5C, maps of ChIp sites show primers (thin lines), E-box elements predicted by consensus site CANNTG (open boxes) and transcription start site (TSS with single-headed arrow). Graphs of ChIp results in WM902B and WM983A show E2A levels detected by each primer set in Id1-overexpressing cells at MOI 10 normalized to uninfected cells. Experiments were conducted in duplicate and error bars indicate SEM, except for -954 bp site in TSP1 promoter. (B) Map of E2A sites (top) and graph of E2A occupancy at p21 promoter in WM902B (bottom left) and WM983A (bottom right). p21 sequence is ENST00000405375 in Ensembl Genome Browser. (C) Map of E2A sites (top) and graph of E2A occupancy at TSP1 promoter in WM902B and WM983A (bottom). TSP1 sequence is ENST00000260356 in Ensembl Genome Browser.
Relationship between Id1 expression and target gene expression varies in melanoma
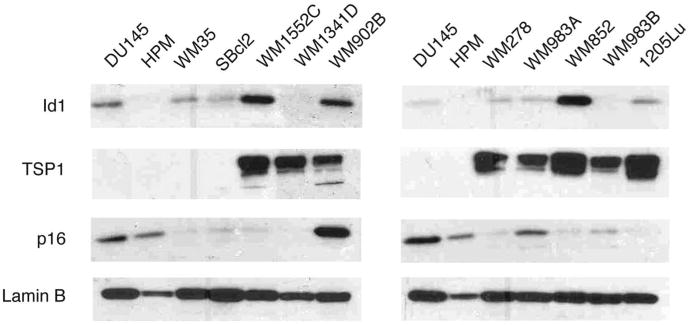
Our data raises questions about the molecular relationship between Id1 overexpression and repression of Id1 target genes in melanoma. To determine the relationship between endogenous global levels of Id1 and its target genes TSP1, p16 and p21 in melanoma cell lines, we performed Western blots (Fig. 7). Id1 was upregulated in most melanoma cell lines at levels comparable to DU145, although the level of expression varied. In the majority of cell lines, Id1 overexpression was consistent with reduced p16 expression or p16 deletion. However, TSP1 methylation was more closely associated with loss of TSP1 expression than the degree of Id1 overexpression, and p21 protein levels did not correlate with Id1 protein levels (data not shown). In this context, our results suggest that melanoma cell lines appear partially refractory to Id1-mediated repression, and additional dysregulation may be required to support the full oncogenic effects of Id1 activation.
Figure 7.
Western blot of endogenous Id1, TSP1 and p16 in melanoma cell lines. Western blot of endogenous Id1, TSP1 and p16 in melanoma cell lines WM35, SBcl2, WM1552C, WM1341D, WM902B (right), and WM278, WM983A, WM852, WM983B and 1205Lu (left) with DU145 Id1-positive control and human primary melanocytes (HPM) normal control. Lamin B was a loading control.
Discussion
Id1 overexpression delays senescence, enhances angiogenesis and supports metastasis in many malignancies, and it is thought to mediate these abnormal programs by transcriptionally repressing p16, p21 and TSP1. We explored the possibility that Id1 overexpression may initiate these abnormal programs by directly producing epigenetic silencing of target genes during melanomagenesis. In fact, we found that p16 and TSP1 were methylated in a subset of melanoma cell lines and/or primary melanomas, and in one case, these genes were methylated in the same tumor. In addition, Id1 overexpression generally correlated with reduced p16 protein or p16 deletion, and with reduced TSP1 protein to a lesser extent, in melanoma cell lines. These findings are consistent with the possibility that Id1 may repress p16 and TSP1 transcription, which could facilitate gene silencing in melanoma.
In our melanoma model system, however, Id1 overexpression alone was not able to transcriptionally repress p16, p21 or TSP1, or mediate epigenetic silencing of these genes (MSP data not shown). We demonstrated that Id1 heterodimerized with its E2A binding partner, but this interaction was not sufficient to antagonize E2A binding at the p21 and TSP1 promoters. There are a few plausible reasons to explain the inability of Id1 to mediate transcriptional repression in these melanoma cell lines.
First, it is possible that Id1 requires additional protein partners to effectively sequester E2A and block its binding at target gene promoters. A recent study found that human calcium/calmodulin-dependent serine protein kinase (hCASK) regulates p21 expression in association with Id1 by depleting E2A from its p21 promoter binding sites.28 Although the role of hCASK in melanoma is unknown, it is plausible that Id1 and hCASK, or another protein partner, must cooperate as a repression complex to alter gene expression, and overexpressing only one component is not sufficient to produce a functional complex.
Second, other oncogenes may need to be activated in addition to Id1 overexpression to influence p16, p21 and TSP1 expression. Swarbrick and colleagues have reported that Id1 overexpression alone did not promote tumorigenesis in a mouse model of breast cancer, while overexpressed Id1 in combination with activated Ras led to metastasis.29 It should also be noted that Tellez and colleagues have indicated that NRAS and BRAF mutations were not associated with aberrant methylation in melanoma cell lines.30 The melanoma cell lines in this study do not possess activated Ras, but most do have a V599E BRAF mutation, including WM902B and WM983A (Ryu B, personal communication), and so it is possible that dysregulation of multiple oncogenes is required to provide a selective advantage for transcriptional repression that could potentially help establish a heterochromatic state.
Third, Id1 overexpression may be relevant for only a particular subset of melanomas. Massague and colleagues have demonstrated that rare Id1-expressing cells in triple-negative breast cancer facilitated primary tumor initiation and metastatic re-initiation in the mouse lung.31 This study and others with a more specific Id1 antibody suggest that endogenous Id1 overexpression occurs in special subpopulations of specific subsets of tumor types.32 Indeed, Id1 overexpression may not be as common in prostate cancer as previously reported since prostate-specific Id1 overexpression did not mediate neoplastic changes in the mouse prostate,33 and we have shown here that Id1 overexpression in prostate epithelial cells did not promote molecular expression changes in Id1 target genes. This implies that Id1 activation may be important in only some types of melanoma, perhaps during a narrow developmental window. A comprehensive IHC study in melanoma with the more specific antibody would need to be conducted to identify these subtypes.
Finally, it is possible that Id-mediated repression and epigenetic silencing requires the right tumor microenvironment, particularly because Id1 is implicated in regulating angiogenesis and metastasis. Emerging evidence indicates that tumors induce Id1 expression in circulating endothelial precursor cells (EPCs), and EPCs support angiogenesis and metastatic progression in a mouse model of lung metastasis.34 These findings indicate that Id1 expression may be important for multiple cell types and selection for melanoma cells with Id1 activation may need to occur in the presence of other cell types that regulate the angiogenic switch and metastatic colonization.
Id1 remains an attractive therapeutic target in cancer because its expression mediates tumor angiogenesis and metastasis;31,34 subverting Id1 activation could prevent tumor progression, which is critical in melanoma since metastatic disease is largely unresponsive to currently available therapies. Our findings that Id1 activation alone did not induce transcriptional repression of key proliferative and anti-angiogenic genes in certain melanoma cell lines suggests that selective targeting of Id1 individually may not be effective in all melanoma settings. Further studies are needed to identify subtypes of melanoma that are dependent on Id1 overexpression for progression and to further explore whether Id1 activation might mediate epigenetic gene silencing in particular subsets of melanoma.
Materials and Methods
Human cancer and primary cell lines
Human melanoma cell lines WM35, SBcl2, WM1552C, WM1341D, WM902B, WM278, WM983A, WM852, WM983B and 1205Lu and prostate cell line DU145 were maintained in DMEM (Invitrogen, Carlsbad, CA, USA) supplemented with 10% fetal bovine serum (Atlanta Biologicals, Lawrenceville, GA, USA), 292 μg/mL L-glutamine (Mediatech, Herndon, VA, USA) and 1% penicillin-streptomycin (Mediatech). Human prostate epithelial cells (PrECs) from Lonza Walkersville (Walkersville, MD, USA) were maintained in PrEC Growth Media (Lonza) supplemented with PrEC Bullet Kit (Lonza).
DNA isolation and bisulfite treatment
Genomic DNA was isolated from cells using the Wizard Genomic DNA Purification Kit (Promega, Madison, WI, USA). Genomic DNA was isolated from primary melanoma patient samples as previously described.35 Bisulfite modification of genomic DNA (∼1 μg) was completed using the EZ Methylation Kit (Zymo Research, Orange, CA, USA), except that modified DNA was eluted in a total volume of 40 μl. Modified DNA was used immediately or stored at −20°C.
Methylation-specific PCR
Methylation-specific PCR (MSP) was performed using primers specific for amplifying unmethylated and methylated alleles in a PCR Express Thermocycler (Hybaid Thermo, Waltham, MA, USA). Reactions were carried out on 2 μl bisulfite-modified DNA using JumpStart Red Taq DNA Polymerase (Sigma, St. Louis, MO, USA) and TSP1 or p16 MSP primers designed to span the transcription start site. PCR products were resolved using 2.5% sodium borate agarose gel electrophoresis. MSP primer sequences and conditions are listed in Table 1.
Table 1. Msp primer sequences and conditions.
| Nested primer sets | External forward primer 5′-3′ | External reverse primer 5′-3′ | Conditions |
|---|---|---|---|
| TSP1 | GGGTTTTTGTYGTTTTTTAGGAGTAATT | CTCCAAATAAATATCCCRAACAACTTTA | Annealing 57°C, 35 cycles |
| p16 | AGAAAGAGGAGGGGTTGGTTGG | ACRCCCRCACCTCCTCTACC | Annealing 57°C, 35 cycles |
| MSP primer sets | Forward primer 5′-3′ | Reverse primer 5′-3′ | Conditions |
| TSP1 Methylated | TCGGACGTATAGGTATTTTTCGC | ATCCTCGACGACCGCCG | Annealing 60°C, 35 cycles |
| TSP1 Unmethylated | TTTTTATTTTGGATGTATAGGTATTTTTTGT | CAACTTTAATCCTCAACAACCACCA | Annealing 60°C, 35 cycles |
| p16 Methylated | TTATTAGAGGGTGGGGCGGATCGC | GACCCCGAACCGCGACCGTAA | Annealing 64°C, 35 cycles |
| p16 Unmethylated | TTATTAGAGGGTGGGGTGGATTGT | CAACCCCAAACCACAACCATAA | Annealing 64°C, 35 cycles |
Lentivirus production
Recombinant lentiviruses were produced and concentrated as previously described.36 The bicistronic EF1α.ID1-UBC.GFP (ID1) lentivirus was generated by subcloning EF1α.ID1 into the UBC.GFP (GFP) lentivirus.
Lentivirus transduction
Recombinant lentiviruses were added to target cells seeded at a density of 7,500–10,000 cells/cm2 at a multiplicity of infection (MOI) of 5–20 for 8 h in the presence of 8 μg/mL Polybrene (Sigma). Cells were allowed to recover for 48–96 h before being subjected to either GFP fluorescence microscopy (Nikon Eclipse TE200/Nikon DXM 1200F camera) and harvesting for early time point analysis, or to GFP fluorescence cell sorting (BD FacsVantage) and serial passaging.
Western blot
Whole cell lysates (WCL) were extracted from cell lines using 4% SDS and homogenized using QIAshredder columns (Qiagen, Valencia, CA, USA). 15–50 μg of denatured WCL were subjected to electrophoresis using 4–12% NuPAGE Novex Bis-Tris (Invitrogen), transferred to polyvinylidene difluoride (PVDF) membranes (Millipore, Billerica, MA, USA), and treated with TrueBlot Enhancer Solution (eBioscience, San Diego, CA, USA). Blots were probed with 1:200 anti-Id1 (rabbit sc-488, Santa Cruz Biotechnology, CA, USA), 1:500 anti-p16 (rabbit sc-468, Santa Cruz), 1:500 anti-p21 (mouse 556431, BD Pharmingen, San Diego, CA, USA), 1:500 anti-TSP1 (mouse sc-59887, Santa Cruz) or 1:500 anti-Lamin B (goat sc-6216, Santa Cruz).
Immunostaining
Cells grown to 50–60% confluence on glass coverslips were fixed in 1% formaldehyde, permeabilized with 0.25% Triton X-100, washed with 1X PBS and blocked in 1% BSA. Cells were immunostained with 1:100 anti-Id1 (rabbit BCH-1/195-14, Biocheck, Inc., Foster City, CA, USA), or with 1:500 anti-Lamin B (goat sc-6216, Santa Cruz), followed with 1:200 anti-rabbit IgG Cy3 (Santa Cruz), or with 1:500 anti-goat IgG (Alexa Fluro 647 A21447, Invitrogen). Cell nuclei were stained with 10 μg/mL Hoeschst 33258. Stained coverslips were mounted onto slides and sealed. Immunostained images were taken at 20× using a Nikon Eclipse TE800/Nikon DXM 1200F camera and analyzed using Elements software in the SKCCC Cell Imaging Core.
Cell growth curve
Cells were seeded at a density of approximately 5,000 cells/cm2 in triplicate in a six-well plate. Cells were maintained in DMEM supplemented with 10% fetal bovine serum, 292 μg/mL L-glutamine and 1% penicillin-streptomycin until they reached 70–80% confluence. Cells were counted four times and then reseeded at the original density. Population doublings were calculated over 30 d using the following equation: Population doubling = LOG (average cell number/original seeding cell number, 2). Population doubling time was calculated from 1/slope of cumulative population doublings versus time.
Cell cycle analysis
Cells were fixed first in 0.05% glutaraldehyde and then in Magic Solution (0.55% NP-40, 3.7% formaldehyde, 0.011 mg/mL Hoechst 33258). Cells were analyzed using a BD LSR I flow cytometer in the SKCCC Cell Imaging Core.
RNA isolation and real-time reverse transcription-PCR
RNA was isolated from cells, reverse transcribed into cDNA and subjected to real-time RT-PCR as previously described37 using primers specific for TSP1, p16 or p21 (genes of interest: GOI) and glyceraldehyde-3-phosphate dehydrogenase (GAPDH). GOI expression levels were normalized to GAPDH for each cell line and calculated relative to GFP lentivirus infected cells (control) using the following equation: relative expression = 2ˆ(sample ΔCt - control ΔCt), where ΔCt = average Ct (GOI) - average Ct (GAPDH). Real-time RT-PCR primer sequences and conditions are listed in Table 2.
Table 2. Real-time RT-PCR primer sequences and conditions.
| RT primer sets | Forward primer 5′-3′ | Reverse primer 5′-3′ | Conditions |
|---|---|---|---|
| TSP1 | CATTAGAGTGGTGATGTATGAAGGG | CCAGAAGGTGCAATACCAGC | Annealing 55°C, 40 cycles |
| p16 | CAACGCACCGAATAGTTACGG | GCGCAGTTGGGCTCCG | Annealing 55°C, 40 cycles |
| p21 | GACAGCAGAGGAAGACCATGTGGA | TCCTGTGGGCGGATTAGGGCTT | Annealing 55°C, 40 cycles |
Protein co-immunoprecipitation (CoIP)
Cells in log-growth phase were lysed using cold modified RIPA Lysis Buffer (50 mM Tris-HCl pH 7.0, 100 mM NaCl, 0.5% NP-40, 3 mM EDTA) freshly supplemented with 1 mM AEBSF (Roche, Mannheim, Germany) and 1X Complete Protease Inhibitor Cocktail (PI, Roche). Sonicated lysates were immunoprecipitated with 6 μg anti-Id1 (rabbit sc-488) or 6 μg normal rabbit anti-IgG (12-370, Millipore, Billerica, MA, USA) using TrueBlot anti-rabbit IgG IP beads (eBioscience). Beads were washed with Wash Lysis Buffer (50 mM Tris-HCL pH 8.0, 150 mM NaCl, 1% NP-40) and samples were eluted in 2X NuPAGE SDS Sample Buffer modified with 100 mM DTT. Denatured proteins were subjected to electrophoresis using 4–12% NuPAGE Novex Bis-Tris gels (Invitrogen), transferred to PVDF (Millipore) and immunobloted with 1:200 anti-Id1 (rabbit sc-488) or 1:500 anti-E2A (rabbit sc-349).
Chromatin immunoprecipitation (ChIP)
Human melanoma cells in log-phase growth were cross-linked as previously described.38 For each chromatin immunoprecipitation (ChIP) assay, ∼2 × 10⁶ cells were used. ChIP was performed using the ChIP Assay Kit (Millipore, Upstate, NY, USA) as previously described,39 except that lysates were immunoprecipated with 5 μg anti-E2A antibody (SC-349) or 2 μg normal rabbit anti-IgG (12-370). To calculate E2A occupancy in ID1-overexpressing cells, the logarithmic standard curve was used to define quantitative values based on ΔCt (DOI - GAPDH), where DOI is DNA of interest, using the following formula: Occupancy = [((ΔCt E2A ID1 - ΔCt IgG ID1)/(ΔCt Input ID1))/((ΔCt E2A Uninfected - ΔCt IgG Uninfected)/(ΔCt Input Uninfected))]. ChIP primer sequences and real-time RT-PCR conditions are listed in Table 3.
Table 3. ChIp primer sequences and real-time RT-PCR conditions.
| p21 ChIP primer setsa | Forward primer 5′-3′ | Reverse primer 5′-3′ | Conditions |
|---|---|---|---|
| −1335 bp Set | CAGCCTGAGATGTCAGTAATTGTAGA | CAGAAATGAGTGATGTGTCTaTCCGC | Annealing 60°C, 40 cycles |
| −787 bp Set | CTTCTGTTCAGGTGAGTGTAGGGTG | GTCCCGTTTATTTCACAGATGAGG | Annealing 60°C, 40 cycles |
| −558 bp Set | TGTCTAGGTGCTCCAGGTGCTTCTG | GGACACAGCACTGTTAGAATGAGCC | Annealing 60°C, 40 cycles |
| −149 bp Set | AGGCTCAGCTGGCTCGGCGCTG | CCACAAGGAACTGACTTCGGCAG | Aannealing 60°C, 40 cycles |
| TSP1 ChIP primer setsa | Forward primer 5′-3′ | Reverse primer 5′-3′ | Conditions |
| −1797 bp Set | ATTTCTGACTGTCCAGTATCATGGAGC | GATGACCGGTATGTTCCTAAGGC | Annealing 60°C, 40 cycles |
| −954 bp Set | GCTCTGTAAATAGCTGAAGACTCTGG | GGGAGGACAGCTGCTTTCTACTCG | Annealing 60°c, 40 cycles |
Location of primers relative to transcription start site.
Acknowledgments
We thank R. Alani, C. Civin and X.-B. Yu for technical advice and reagents. We thank B. Ryu for BRAF sequencing data. This work was supported entirely by NIH grant CA127055 James G. Herman, MD.
Abbreviations
- Id1
inhibitor of DNA binding-1
- p16
CDKN2A
- p21
CDKN1A
- TSP1
thrombospondin-1
- MSP
methylation-specific PCR
- ChIP
chromatin immunoprecipitation
Footnotes
Conflict of interest: JGH is a consultant to OncoMethylome Sciences. Under a licensing agreement between the Johns Hopkins University and this company, MSP was licensed to OncoMethylome Sciences and JGH is entitled to a share of the royalties received by the University from sales of the licensed technology.
Note: Supplementary materials can be found at: www.landesbioscience.com/supplement/HealeyEPI5-5-Sup.pdf
References
- 1.Gazin C, Wajapeyee N, Gobeil S, Virbasius CM, Green MR. An elaborate pathway required for ras-mediated epigenetic silencing. Nature. 2007;449:1073–7. doi: 10.1038/nature06251. [DOI] [PMC free article] [PubMed] [Google Scholar]
- 2.Puto LA, Reed JC. Daxx represses RelB target promoters via DNA methyltransferase recruitment and DNA hypermethylation. Genes Dev. 2008;22:998–1010. doi: 10.1101/gad.1632208. [DOI] [PMC free article] [PubMed] [Google Scholar]
- 3.Vogelstein B, Kinzler KW. Cancer genes and the pathways they control. Nat Med. 2004;10:789–99. doi: 10.1038/nm1087. [DOI] [PubMed] [Google Scholar]
- 4.Di Croce L, Raker VA, Corsaro M, Fazi F, Fanelli M, Faretta M, et al. Methyltransferase recruitment and DNA hypermethylation of target promoters by an oncogenic transcription factor. Science. 2002;295:1079–82. doi: 10.1126/science.1065173. [DOI] [PubMed] [Google Scholar]
- 5.Brenner C, Deplus R, Didelot C, Loriot A, Vire E, De Smet C, et al. Myc represses transcription through recruitment of DNA methyltransferase corepressor. EMBO J. 2005;24:336–46. doi: 10.1038/sj.emboj.7600509. [DOI] [PMC free article] [PubMed] [Google Scholar]
- 6.Opavsky R, Wang SH, Trikha P, Raval A, Huang Y, Wu YZ, et al. CpG island methylation in a mouse model of lymphoma is driven by the genetic configuration of tumor cells. PLoS Genet. 2007;3:1757–69. doi: 10.1371/journal.pgen.0030167. [DOI] [PMC free article] [PubMed] [Google Scholar]
- 7.Perk J, Iavarone A, Benezra R. Id family of helix-loop-helix proteins in cancer. Nat Rev Cancer. 2005;5:603–14. doi: 10.1038/nrc1673. [DOI] [PubMed] [Google Scholar]
- 8.Schoppmann SF, Schindl M, Bayer G, Aumayr K, Dienes J, Horvat R, et al. Overexpression of id-1 is associated with poor clinical outcome in node negative breast cancer. Int J Cancer. 2003;104:677–82. doi: 10.1002/ijc.11009. [DOI] [PubMed] [Google Scholar]
- 9.Ohtani N, Zebedee Z, Huot TJ, Stinson JA, Sugimoto M, Ohashi Y, et al. Opposing effects of ets and id proteins on p16INK4a expression during cellular senescence. Nature. 2001;409:1067–70. doi: 10.1038/35059131. [DOI] [PubMed] [Google Scholar]
- 10.Alani RM, Young AZ, Shifflett CB. Id1 regulation of cellular senescence through transcriptional repression of p16/Ink4a. Proc Natl Acad Sci USA. 2001;98:7812–6. doi: 10.1073/pnas.141235398. [DOI] [PMC free article] [PubMed] [Google Scholar]
- 11.Cummings SD, Ryu B, Samuels MA, Yu X, Meeker AK, Healey MA, et al. Id1 delays senescence of primary human melanocytes. Mol Carcinog. 2008;47:653–9. doi: 10.1002/mc.20422. [DOI] [PMC free article] [PubMed] [Google Scholar]
- 12.Prabhu S, Ignatova A, Park ST, Sun XH. Regulation of the expression of cyclin-dependent kinase inhibitor p21 by E2A and id proteins. Mol Cell Biol. 1997;17:5888–96. doi: 10.1128/mcb.17.10.5888. [DOI] [PMC free article] [PubMed] [Google Scholar]
- 13.Volpert OV, Pili R, Sikder HA, Nelius T, Zaichuk T, Morris C, et al. Id1 regulates angiogenesis through transcriptional repression of thrombospondin-1. Cancer Cell. 2002;2:473–83. doi: 10.1016/s1535-6108(02)00209-x. [DOI] [PubMed] [Google Scholar]
- 14.Straume O, Akslen LA. Strong expression of ID1 protein is associated with decreased survival, increased expression of ephrin-A1/EPHA2, and reduced thrombospondin-1 in malignant melanoma. Br J Cancer. 2005;93:933–8. doi: 10.1038/sj.bjc.6602792. [DOI] [PMC free article] [PubMed] [Google Scholar]
- 15.Rofstad EK, Henriksen K, Galappathi K, Mathiesen B. Antiangiogenic treatment with thrombospondin-1 enhances primary tumor radiation response and prevents growth of dormant pulmonary micrometastases after curative radiation therapy in human melanoma xenografts. Cancer Res. 2003;63:4055–61. [PubMed] [Google Scholar]
- 16.Lee CH, Wu CL, Shiau AL. Systemic administration of attenuated salmonella choleraesuis carrying thrombospondin-1 gene leads to tumor-specific transgene expression, delayed tumor growth and prolonged survival in the murine melanoma model. Cancer Gene Ther. 2005;12:175–84. doi: 10.1038/sj.cgt.7700777. [DOI] [PubMed] [Google Scholar]
- 17.Markovic SN, Suman VJ, Rao RA, Ingle JN, Kaur JS, Erickson LA, et al. A phase II study of ABT-510 (thrombospondin-1 analog) for the treatment of metastatic melanoma. Am J Clin Oncol. 2007;30:303–9. doi: 10.1097/01.coc.0000256104.80089.35. [DOI] [PubMed] [Google Scholar]
- 18.Ryu B, Kim DS, DeLuca AM, Healey MA, Dunlap S, Fackler MJ, et al. Id1 expression is transcriptionally regulated in radial growth phase melanomas. Int J Cancer. 2007;121:1705–9. doi: 10.1002/ijc.22875. [DOI] [PubMed] [Google Scholar]
- 19.Gonzalgo ML, Bender CM, You EH, Glendening JM, Flores JF, Walker GJ, et al. Low frequency of p16/CDKN2A methylation in sporadic melanoma: Comparative approaches for methylation analysis of primary tumors. Cancer Res. 1997;57:5336–47. [PubMed] [Google Scholar]
- 20.Roman-Gomez J, Castillejo JA, Jimenez A, Gonzalez MG, Moreno F, Rodriguez Mdel C, et al. 5′ CpG island hypermethylation is associated with transcriptional silencing of the p21(CIP1/WAF1/SDI1) gene and confers poor prognosis in acute lymphoblastic leukemia. Blood. 2002;99:2291–6. doi: 10.1182/blood.v99.7.2291. [DOI] [PubMed] [Google Scholar]
- 21.Li Q, Ahuja N, Burger PC, Issa JP. Methylation and silencing of the thrombospondin-1 promoter in human cancer. Oncogene. 1999;18:3284–9. doi: 10.1038/sj.onc.1202663. [DOI] [PubMed] [Google Scholar]
- 22.Yang QW, Liu S, Tian Y, Salwen HR, Chlenski A, Weinstein J, et al. Methylation-associated silencing of the thrombospondin-1 gene in human neuroblastoma. Cancer Res. 2003;63:6299–310. [PubMed] [Google Scholar]
- 23.Tanaka K, Pracyk JB, Takeda K, Yu ZX, Ferrans VJ, Deshpande SS, et al. Expression of Id1 results in apoptosis of cardiac myocytes through a redox-dependent mechanism. J Biol Chem. 1998;273:25922–8. doi: 10.1074/jbc.273.40.25922. [DOI] [PubMed] [Google Scholar]
- 24.Darby S, Cross SS, Brown NJ, Hamdy FC, Robson CN. BMP-6 overexpression in prostate cancer is associated with increased id-1 protein and a more invasive phenotype. J Pathol. 2008;214:394–404. doi: 10.1002/path.2292. [DOI] [PubMed] [Google Scholar]
- 25.Framson P, Bornstein P. A serum response element and a binding site for NF-Y mediate the serum response of the human thrombospondin 1 gene. J Biol Chem. 1993;268:4989–96. [PubMed] [Google Scholar]
- 26.Takahashi E, Funato N, Higashihori N, Hata Y, Gridley T, Nakamura M. Snail regulates p21(WAF/CIP1) expression in cooperation with E2A and twist. Biochem Biophys Res Commun. 2004;325:1136–44. doi: 10.1016/j.bbrc.2004.10.148. [DOI] [PubMed] [Google Scholar]
- 27.Connerney J, Andreeva V, Leshem Y, Mercado MA, Dowell K, Yang X, et al. Twist1 homodimers enhance FGF responsiveness of the cranial sutures and promote suture closure. Dev Biol. 2008;318:323–34. doi: 10.1016/j.ydbio.2008.03.037. [DOI] [PMC free article] [PubMed] [Google Scholar]
- 28.Sun R, Su Y, Zhao X, Qi J, Luo X, Yang Z, et al. Human calcium/calmodulin-dependent serine protein kinase regulates the expression of p21 via the E2A transcription factor. Biochem J. 2009;419:457–66. doi: 10.1042/BJ20080515. [DOI] [PubMed] [Google Scholar]
- 29.Swarbrick A, Roy E, Allen T, Bishop JM. Id1 cooperates with oncogenic ras to induce metastatic mammary carcinoma by subversion of the cellular senescence response. Proc Natl Acad Sci USA. 2008;105:5402–7. doi: 10.1073/pnas.0801505105. [DOI] [PMC free article] [PubMed] [Google Scholar]
- 30.Tellez CS, Shen L, Estecio MR, Jelinek J, Gershenwald JE, Issa JP. CpG island methylation profiling in human melanoma cell lines. Melanoma Res. 2009;19:146–55. doi: 10.1097/cmr.0b013e32832b274e. [DOI] [PubMed] [Google Scholar]
- 31.Gupta GP, Perk J, Acharyya S, de Candia P, Mittal V, Todorova-Manova K, et al. ID genes mediate tumor reinitiation during breast cancer lung metastasis. Proc Natl Acad Sci USA. 2007;104:19506–11. doi: 10.1073/pnas.0709185104. [DOI] [PMC free article] [PubMed] [Google Scholar]
- 32.Perk J, Gil-Bazo I, Chin Y, de Candia P, Chen JJ, Zhao Y, et al. Reassessment of id1 protein expression in human mammary, prostate, and bladder cancers using a monospecific rabbit monoclonal anti-id1 antibody. Cancer Res. 2006;66:10870–7. doi: 10.1158/0008-5472.CAN-06-2643. [DOI] [PubMed] [Google Scholar]
- 33.Salomon R, Young L, Macleod D, Yu XL, Dong Q. Probasin promoter-driven expression of ID1 is not sufficient for carcinogenesis in rodent prostate. J Histochem Cytochem. 2009;57:599–604. doi: 10.1369/jhc.2009.953182. [DOI] [PMC free article] [PubMed] [Google Scholar]
- 34.Gao D, Nolan DJ, Mellick AS, Bambino K, McDonnell K, Mittal V. Endothelial progenitor cells control the angiogenic switch in mouse lung metastasis. Science. 2008;319:195–8. doi: 10.1126/science.1150224. [DOI] [PubMed] [Google Scholar]
- 35.Winnepenninckx V, Lazar V, Michiels S, Dessen P, Stas M, Alonso SR, et al. Melanoma Group of the European Organization for Research and Treatment of Cancer. Gene expression profiling of primary cutaneous melanoma and clinical outcome. J Natl Cancer Inst. 2006;98:472–82. doi: 10.1093/jnci/djj103. [DOI] [PubMed] [Google Scholar]
- 36.Yu X, Zhan X, D'Costa J, Tanavde VM, Ye Z, Peng T, et al. Lentiviral vectors with two independent internal promoters transfer high-level expression of multiple transgenes to human hematopoietic stem-progenitor cells. Mol Ther. 2003;7:827–38. doi: 10.1016/s1525-0016(03)00104-7. [DOI] [PubMed] [Google Scholar]
- 37.Zinn RL, Pruitt K, Eguchi S, Baylin SB, Herman JG. hTERT is expressed in cancer cell lines despite promoter DNA methylation by preservation of unmethylated DNA and active chromatin around the transcription start site. Cancer Res. 2007;67:194–201. doi: 10.1158/0008-5472.CAN-06-3396. [DOI] [PubMed] [Google Scholar]
- 38.Fahrner JA, Eguchi S, Herman JG, Baylin SB. Dependence of histone modifications and gene expression on DNA hypermethylation in cancer. Cancer Res. 2002;62:7213–8. [PubMed] [Google Scholar]
- 39.Tiwari VK, McGarvey KM, Licchesi JD, Ohm JE, Herman JG, Schubeler D, et al. PcG proteins, DNA methylation and gene repression by chromatin looping. PLoS Biol. 2008;6:2911–27. doi: 10.1371/journal.pbio.0060306. [DOI] [PMC free article] [PubMed] [Google Scholar]


