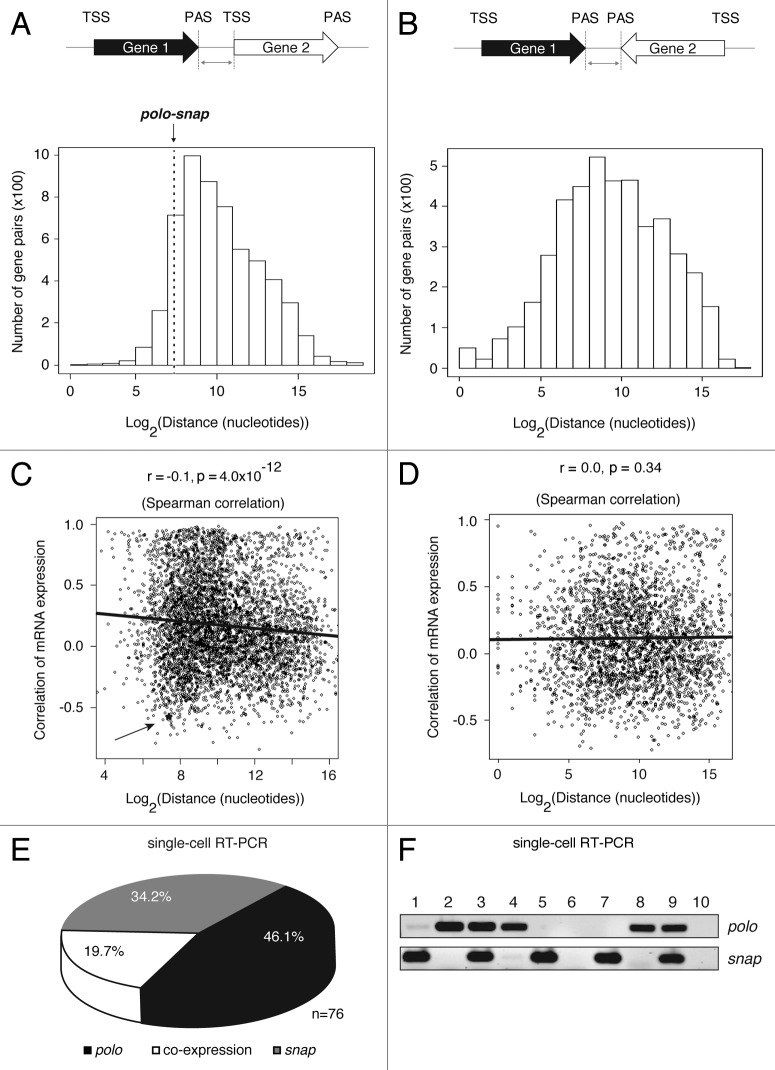
Figure 1. Some closely spaced tandem genes, including polo-snap, have a negative correlation of gene expression. (A) Schematic representation of the analyzed tandem gene pairs across the Drosophila genome (April 2006, BDGP release 5.12/dm3). The graph represents the number of gene pairs in tandem configuration and the distribution of distances between PAS of Gene 1 and TSS of Gene 2. The distance between polo and snap is 168 nt, which is at the 10.7 percentile among all gene pairs. (B) Schematic representation of the analyzed convergent gene pairs across the Drosophila genome (dm3). The graph represents the number of gene pairs in convergent configuration and the distribution of distances between PAS of Gene 1 and Gene 2. (C) Scatter plot shows an inverse correlation between gene distance (tandem genes) and gene expression. Correlation of gene expression (r) was based on Pearson correlation of expression values from 26 fly tissues. The r and p shown in the figure are based on Spearman correlation. The gene expression correlation between polo and snap is -0.57. An asterisk and arrow mark polo-snap. (D) Scatter plot shows no correlation between gene distance (PAS to PAS only) and correlation of gene expression. Correlation of gene expression (r) was based on Pearson correlation of expression values from 26 fly tissues. The r and p shown in the figure are based on Spearman correlation. (E) S2 single cells were sorted by flow cytometry on exponential phase of growth and single- cell PCR for polo and snap was performed using specific primers. The circle graph shows that in more than 80% of the cells polo and snap are not co-expressed (n = 76). (F) A representative agarose gel showing the PCR products for polo and snap after electrophoresis is shown. Each lane corresponds to a single cell sorted by flow cytometry. Lane 6 and lane 10 represent non-template controls for PCR reactions.

An official website of the United States government
Here's how you know
Official websites use .gov
A
.gov website belongs to an official
government organization in the United States.
Secure .gov websites use HTTPS
A lock (
) or https:// means you've safely
connected to the .gov website. Share sensitive
information only on official, secure websites.
