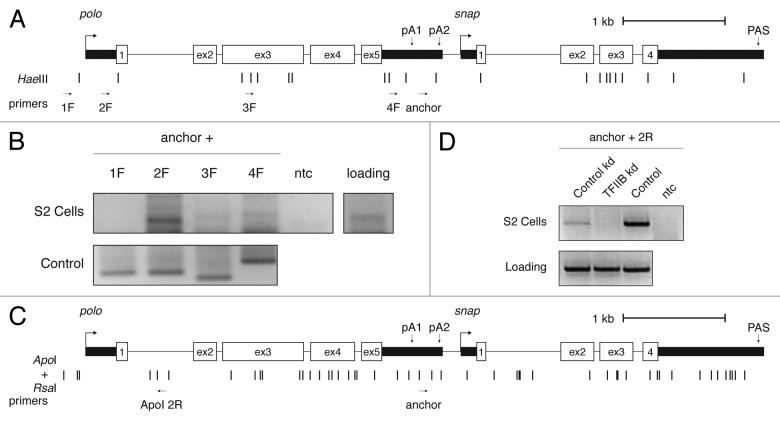
Figure 5.polo initiation and terminator regions interact through a gene loop dependent of TFIIB. (A) Schematic representation of polo and snap locus with restriction enzyme sites and primers for HaeIII 3C analysis. Arrows indicate primer direction and name. polo PAS are indicated. (B) polo 3C analysis. An agarose gel is shown. Positive lanes are internal polo PCR products on S2 gDNA (control panel) and chromatin (for cells). Common PCR primer (anchor) is shown above the figure, with the second primer shown above each lane (1F-4F). (C) Schematic representation of polo and snap locus with restriction enzyme sites and primers for ApoI/ RsaI 3C analysis. Arrows indicate primer direction and name. polo PAS are indicated. (D) polo 3C analysis upon TFIIB depletion. A representative agarose gel is shown for control kd, TFIIB depletion and control PCR panel (control) is shown. Positive lanes are internal polo PCR products on S2 gDNA (control panel) and chromatin (for cells). anchor and ApoI 2R PCR primers were used.

An official website of the United States government
Here's how you know
Official websites use .gov
A
.gov website belongs to an official
government organization in the United States.
Secure .gov websites use HTTPS
A lock (
) or https:// means you've safely
connected to the .gov website. Share sensitive
information only on official, secure websites.
