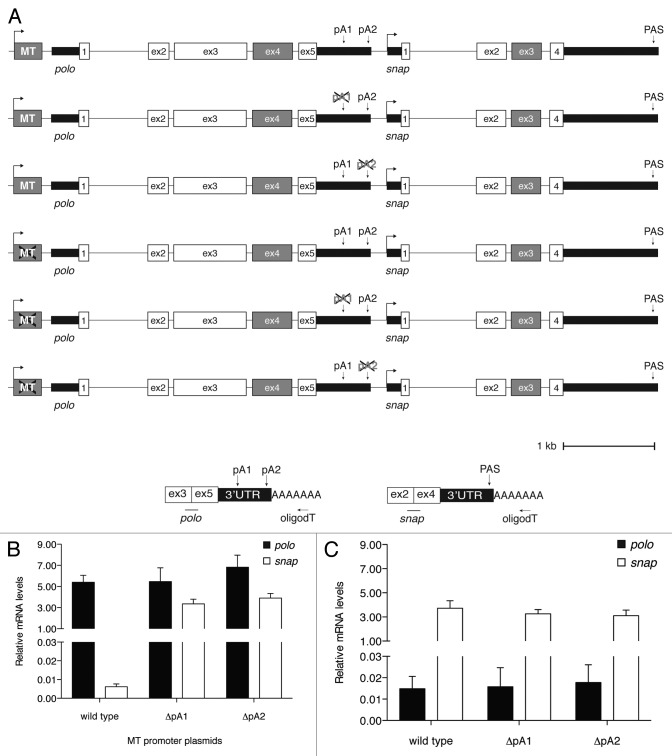
Figure 6. Deletion of polo PAS affect snap expression. (A) Detailed schematic representation of different polo-snap containing plasmids. Note the absence of polo exon 4 and snap exon 3 (gray boxes) for differentiation between endogenous and plasmid derived transcripts. The crosses over either the promoter (MT) or the PAS (pA1 or pA2) represent the deletion of these structures in the respective plasmids. (B) Quantification of polo and snap mRNA levels using the plasmids where polo is expressed under the control of the metallothionein promoter. Polyadenylated transcripts from the plasmid were quantified as depicted in the scheme on the right and normalized to a co-transfected plasmid expressing eGFP. Oligod(T) was used for the RT reaction and primers on exons 3 and 5, and 2 and 4, on polo and snap, respectively, were used on the qPCR. (C) Same as (B) but for quantification of polo and snap mRNA levels using plasmids where the metallothionein promoter cassette was deleted. Polyadenylated transcripts were quantified as in (A).

An official website of the United States government
Here's how you know
Official websites use .gov
A
.gov website belongs to an official
government organization in the United States.
Secure .gov websites use HTTPS
A lock (
) or https:// means you've safely
connected to the .gov website. Share sensitive
information only on official, secure websites.
