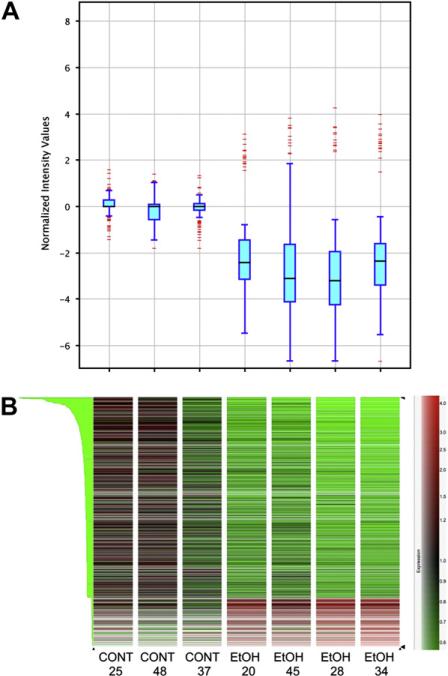
Fig. 1.
A. Box whisker plots of placental gene expression in control and ethanol-exposed placentas representing the minimum (end of the bottom whisker), the first quartile (bottom border of the box), the median (line through the box), the third quartile (top border of the box), and the maximum (end of the top whisker) of the distribution. The separately drawn points are outliers. Points are regarded as outliers if the minimum of their distance to the first and the third quartile is greater than 1.5 times the interquartile range (IQR = third quartile–second quartile). B. Heat map plots illustrating unsupervised hierarchical clustering on similarity in expression profiles across conditions of 643 genes list, filtered by twofold expression changes and statistical significance (Student's t-test). CONT = saccharin control group and EtOH = 5% ethanol treatment group. The numbers below the group labels indicate the litter number from which the placenta tissue was harvested. Each heat map corresponds to the whisker plot directly above it.

