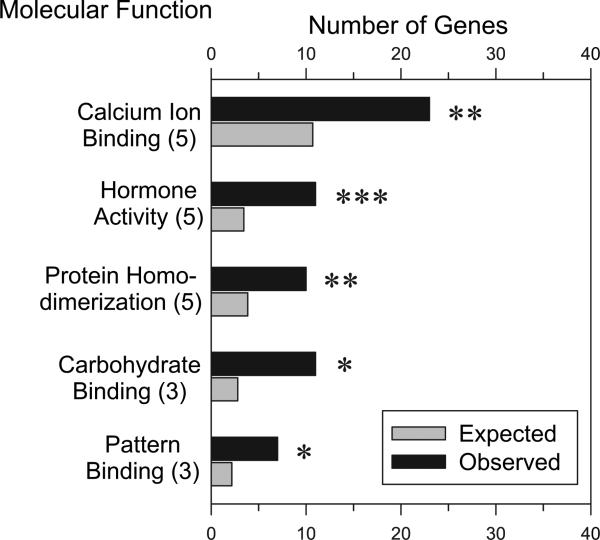
Fig. 3.
Selected enriched “molecular function” gene ontology (GO) categories. Numbers in parenthesis after the molecular function denote the GO category level. Data were analyzed using Gene Ontology Tree Machine GOTM software (Zhang et al., 2000). The distribution of differentially regulated genes (gray bars) in each GO category was compared with all genes on the Affymetrix Rat 230 2.0 array (black bars). Statistical significance was analyzed using the hypergeometric statistical test; *P < .05, **P < .005, ***P < .0005.

