

Abstract
Background
Care for falls and urinary incontinence (UI) among older patients is inadequate. One possible explanation is that physicians provide less recommended care to patients who are not as concerned about their falls and UI.
Objective
To test whether patient-reported severity for two geriatric conditions, falls and UI, is associated with quality of care.
Research Design
Prospective cohort study of elders with falls and/or fear of falling (n=384) and UI (n=163).
Subjects
Participants in the Assessing Care of Vulnerable Elders-2 Study (2002–3), which evaluated an intervention to improve the care for falls and UI among older (age ≥75) ambulatory care patients with falls/fear of falling or UI.
Measures
Falls Efficacy Scale (FES) and the Incontinence Quality of Life (IQOL) surveys measured at baseline, quality of care measured by a 13-month medical record abstraction.
Results
There was a small difference in falls quality scores across the range of FES, with greater patient-perceived falls severity associated with better odds of passing falls quality indicators (OR 1.11 (95% CI 1.02–1.21) per 10-point increment in FES). Greater patient-perceived UI severity (IQOL score) was not associated with better quality of UI care.
Conclusions
Although older persons with greater patient-perceived falls severity receive modestly better quality of care, those with more distressing incontinence do not. For both conditions, however, even the most symptomatic patients received less than half of recommended care. Low patient-perceived severity of condition is not the basis of poor care for falls and UI.
Keywords: Quality of care, Urinary Incontinence, Falls
INTRODUCTION
Older patients often fail to receive recommended care for common geriatric conditions such as fear of falling, falls and urinary incontinence (UI) but we understand little about the factors associated with such deficits in care.1 Previous studies identified system2–5 and provider6–16 characteristics that contribute to variations in care quality.
Patient-related factors are another potential source of variation in care quality. Patients with more co-morbidities17–19 receive better quality of care, and patients needing time-consuming services such as counseling receive poorer quality of care.18 Unrelated co-morbidities and some sociodemographic characteristics may also negatively affect care.20–28
Some studies include illness severity as a predictor of better quality of care. Studies suggest that better care is delivered to those with objective clinical measures of severity: higher blood pressures are associated with better hypertension care;29, 30 lower CD4 counts are associated with better HIV care;31 and pneumonia severity measures are associated with pneumonia guideline adherence.32, 33 No studies, however, have focused on whether subjective patient report of disease severity is associated with better quality of care. We sought to determine whether subjective patient-reported severity of fear of falling, falls, and UI affected the quality of care provided.
METHODS
This study used falls and UI data from the Assessing Care of Vulnerable Elders-2 (ACOVE-2) study,34 a controlled trial to improve the quality of care for falls, UI, and dementia among older outpatients. As part of this study, we aimed to analyze whether patient-reported disease severity was related to subsequent quality of care for falls, fear of falling, and UI. A self-reported dementia severity measure was unavailable for study.
The ACOVE-2 intervention implemented a practice re-design intervention35. Patients aged ≥75 years at intervention and control sites were screened by office personnel with yes/no screening questions concerning any fear of falling, serious falls (2+ falls or fall requiring physician attention in past year) and UI symptoms (bothersome enough to seek medical care).
Upon enrollment, those with fear of falling and/or falls were administered the 10-item Falls Efficacy Scale (FES),36 a measure associated with severity of future falls, gait and balance impairment, and disability.36–39 Patients who screened positively for fear of falling but denied falls were excluded if they had a “negative” FES (i.e., described no falling concern on all FES items). Those with bothersome UI answered the 22-item Incontinence Quality of Life (IQOL) survey, a measure of incontinence severity and quality of life.40, 41 Patients could be in both UI and falls samples.
Quality of care measurement
We used ACOVE process-of-care quality indicators (QIs) to evaluate falls and UI care. The number of QIs triggered per participant varied, due to presence/absence of clinical criteria indicated by the QIs.
We applied these measures of quality to all outpatient primary care and specialist medical records for a 13-month period. If the patient received the recommended process, a score of 1 was awarded; if not, a score of 0 was assigned. Documentation of patient refusal received full credit. For selected QIs (Falls QIs 3–5 and UI QIs 1 and 6), individuals with advanced dementia or life expectancy ≤ 6 months were not evaluated.42 In addition, if the patient had already received a workup and/or completed recommended therapies for the falls or UI condition (i.e., “maximal treatment”), then QIs were excluded.
Variables
Our primary outcome was a dichotomous variable representing whether the triggered QI was passed or failed, clustered at the level of the patient.
The primary variable of interest for the falls analysis was the severity of patient’s concern for falls during daily activities (e.g., bathing, walking) measured by the FES.36 FES scores are calculated as the sum of responses (1 point for “not at all” concerned to 4 points for “very” concerned) for 10 activities, ranging from 10 to 40. To facilitate interpretation of the results, we rescaled the FES score from 0 to 100 points (higher=more severe concern). Those with a re-scaled score ≥25 have severe fear of falling, a threshold associated with increased risk of future falls.39 Our analytic sample only included subjects with ≤2 missing FES items.
The primary variable of interest for the UI analysis was severity of distress and bother (e.g., limitations in daily activities, embarrassment, or psychosocial consequences) caused by UI symptoms as measured by the 22-item IQOL survey.41 Responses to each item are graded on a 5-point scale ranging from “extremely” (1 point) to “not at all” (5 points). The IQOL is a sum of the responses, rescaled on a 100-point scale.41 For ease of comparison with falls analyses, we reversed the IQOL score so that higher scores reflected worse symptoms (i.e., “reversed-IQOL”, or “rIQOL” score). Those with rIQOL scores of ≤50 had mild-to-moderate UI,40 while scores ≥50 indicate moderate-to-severe disease.40 We excluded patients with >3 missing items.
For both analyses, we calculated full FES and rIQOL scores for those with few missing items (1–2 for FES, 1–3 for rIQOL) using multiple imputation.43 IQOL and FES scores obtained from proxy respondents were excluded because they overstate FES and understate IQOL compared to subjects by 0.9 and 0.7 standard deviations, respectively.44
We classified two falls QIs (# 4,5) and three UI QIs (# 4, 5, 6, Table 2) as “secondary” QIs because they could be triggered only by an abnormality (e.g., abnormal gait) identified as a result of passing another QI (e.g., gait examination). We considered this as a potential confounder because patients with more severe conditions might be more likely to trigger and pass a secondary QI because they passed the preceding primary QI.
Table 2.
Falls and Urinary Incontinence (UI) Quality Indicators (QIs)
| Falls QIs | Number of times QI was triggered | # of triggered QIs passed (%) | UI QIs | Number of times QI was triggered | # of triggered QIs passed (%) | |
|---|---|---|---|---|---|---|
| QI #1 | If a person age 75 or older reports a fall, then a falls history should be performed | 165 | 68 (41%) | If a person age 75 or older reports new UI symptoms then a targeted history should be performed | 162 | 44 (27%) |
| QI #2 | If a person age 75 or older reports a fall, then a falls physical exam should be performed | 165 | 57 (35%) | If a person age 75 or older reports new UI symptoms then a targeted exam should be performed | 163 | 45 (28%) |
| QI #3 | If a person age 75 or older reports fear of falling or a gait, mobility, or balance problem then he/she should have a gait, mobility and balance exam performed | 248 | 66 (27%) | If a person age 75 or older reports new UI symptoms then a dipstick analysis should be performed | 163 | 62 (38%) |
| QI #4 | If a person age 75 or older is found to have impaired balance, proprioception, or increased postural sway then an intervention (exercise/physical therapy, assistive device) should be recommended | 43 | 10 (23%) | If a person age 75 or older is found to have UI at a new evaluation and pharmacologic therapy is recommended then a postvoid residual should be performed prior to pharmacologic therapy | 23 | 8 (35%) |
| QI #5 | If a person age 75 or older is found to have impaired gait, decreased strength or endurance, then an exercise program should be recommended | 35 | 27 (77%) | If a person age 75 or older is found to have UI at a new evaluation then treatment options should be discussed | 163 | 66 (40%) |
| QI #6 | If a person age 75 or older who is cognitively intact and ambulatory is found to have UI without hematuria or high postvoid residual then behavioral therapy should be recommended prior to pharmacologic therapy | 115 | 26 (23%) | |||
| All QIs | 656 | 228 (35%) | 789 | 251 (32%) |
Analysis
We first performed unadjusted logistic regressions of the quality scores for falls QIs with FES scores and the quality scores for UI QIs with rIQOL scores. Then we used multivariable logistic regression to predict the odds of passing versus failing the QIs, controlling for age, gender, number of QIs triggered for all ACOVE conditions (proxy for co-morbidity), and primary versus secondary QI. Because the ACOVE-2 intervention improved the quality of care for falls and incontinence34, we controlled for the intervention and considered an interaction term with baseline FES or rIQOL. Standard errors were adjusted for clustering by patient, then by physician. Analyses were performed using STATA version 10.0.
RESULTS
Of 2671 screened older (age ≥75) patients, 53 (11%) reported falls, 369 (74%) reported fear of falling, and 78 (16%) reported both falls and fear of falling. After inclusion criteria were applied, our analytic sample for fear of falling/falls (“falls sample”) consisted of 384 (77%) patients evaluated for 656 QIs. There were 235 (9% of screened) patients who endorsed bothersome UI symptoms; 163 (69%) met inclusion criteria and were evaluated for 789 UI QIs (Figure 1).
Figure 1. Flow Diagram of.
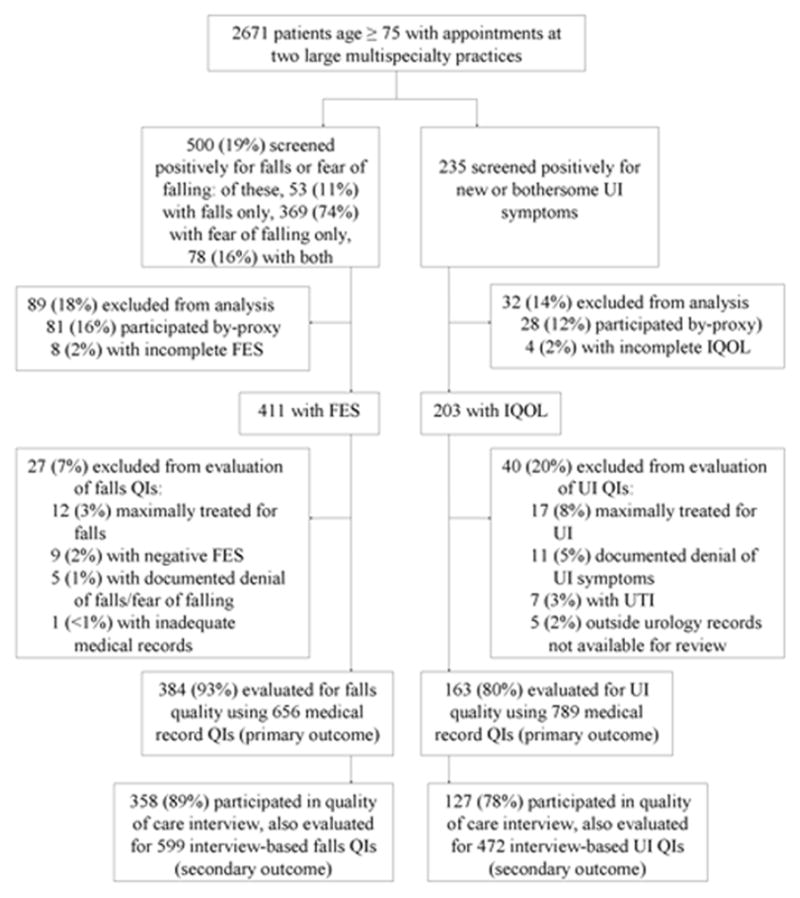
Enrollment and Quality of Care Measurement for Falls and Urinary Incontinence Patients in the Assessing the Care of Vulnerable Elders (ACOVE-2) Study
FES = Falls Efficacy Scale
IQOL = Incontinence Quality of Life survey
UI = Urinary Incontinence
QI = Quality indicator
* Patient with positive screens for both UI and falls were considered in both samples. There were 115 (4.3% of unscreened sample of 2671) with positive UI and falls/fear of falling screens. After exclusions, the final analytic sample included 69 of these patients (18% of the falls sample and 42% of the UI sample).
Mean subject age was 81 years. The falls sample was 34% male; the UI sample was 20% male. The overall pass rate was 35% for the falls and 32% for the UI QIs (Table 1). Pass rates for individual QIs are displayed in Table 2.
Table 1.
Descriptive Statistics of Quality Indicator and Patient-level Characteristics
| Falls | Urinary Incontinence (UI) | ||
|---|---|---|---|
| Quality Indicator (QI) Characteristics | Number of QI triggering events within condition | 656 | 789 |
| Number of triggered QIs passed (%) within condition | 228 (35%) | 251 (32%) | |
| Patient-level Characteristics | Number of patients | 384 | 163 |
| Percent male gender | 33% | 20% | |
| Percent intervention group (versus control) | 55% | 55% | |
| Mean number of falls or UI QIs triggered | 1.7 (range 1–5) | 4.8 (range 3–6) | |
| Mean number of QIs triggered, for all ACOVE conditions* | 22 (range 5–61, SD=10) | 23 (range 9–61, SD=10) | |
| Mean FES or rIQOL score | 35 (range 0–100, SD=27) | 27 (range 0–100, SD=21) |
FES = Falls Efficacy Score (possible range 0–100, higher is more severe) rIQOL = reversed Incontinence Quality of Life score (possible range 0–100, higher is more severe)
Because ACOVE QIs were triggered by medical conditions, we used the mean number of QIs triggered for all ACOVE conditions as the measurement for co-morbidity.
Falls Analysis
In unadjusted models, higher (more symptomatic) FES scores were associated with higher odds of passing falls QIs (OR 1.09 for every 10-point increase in FES, p=.007).
In the multivariable logistic regression analyses, each 10-point increase in FES was associated with 1.11 (95% CI 1.02–1.21) times the odds of passing falls QIs (Table 3). Being in the intervention group increased odds of passing the falls QIs (OR=2.77, 95% CI 1.56–4.92) but did not modify the relationship between FES and quality of care (p=.6 for interaction term between FES and intervention group). Age, gender, co-morbidity, and primary versus secondary QI had no effect on quality.
Table 3.
Multivariable Logistic Regression Models Predicting the Quality of Falls and Urinary Incontinence Care
| Quality of Falls Care | Quality of Urinary Incontinence Care | |||||
|---|---|---|---|---|---|---|
| OR | 95 % Confidence Interval | OR | 95 % Confidence Interval | |||
| Severity of patients’ concern for falling or UI* | 1.11 | 1.02 | 1.21 | 1.02 | 0.92 | 1.14 |
| Intervention | 2.77 | 1.56 | 4.92 | 2.21 | 1.43 | 3.40 |
| Age | 0.99 | 0.95 | 1.03 | 0.95 | 0.90 | 1.00 |
| Male | 1.04 | 0.72 | 1.50 | 1.60 | 0.88 | 2.89 |
| Number of QIs triggered for all conditions | 1.00 | 0.99 | 1.02 | 0.98 | 0.96 | 1.00 |
| Primary QI | 1.41 | 0.85 | 2.35 | 1.15 | 0.86 | 1.54 |
Severity of concern for falling was measured by the Falls Efficacy Scale (FES), while severity of Urinary Incontinence (UI) was measured by the Reversed-Incontinence Quality of Life (rIQOL) scale
OR= odds ratio. ORs reflect a 10-point change in the rescaled FES or reversed IQOL score, intervention versus control, age per year, male versus female gender, number of QIs (per patient, a proxy for co-morbidity), primary versus secondary QI. Standard errors were adjusted for clustering by patient.
The falls model includes 656 quality indicators of falls care among 384 patients. In addition to the variables displayed, an interaction term between intervention group and FES is included in the model (p=.6). The FES is rescaled to 0–100 with higher scores indicating more symptoms.
The UI model includes 789 quality indicators of UI care among 163 patients. The rIQOL ranged between 1.14–100 with higher scores indicating more symptoms.
The predicted probabilities of quality of falls care for a hypothetical patient across the range of FES scores were obtained from the full multivariable model. In the graphed example (Figure 2), the predicted probability of passing across the range of FES scores (0 to 100) increased from 18% (95% CI 13–24%) to 38% (95% CI 25–47%). Across the FES interquartile range, the predicted difference in passing was 7% (20% versus 27%). Figure 2 shows that even for those with the highest concern and probability of falling, recommended care was provided approximately one-third of the time.
Figure 2.
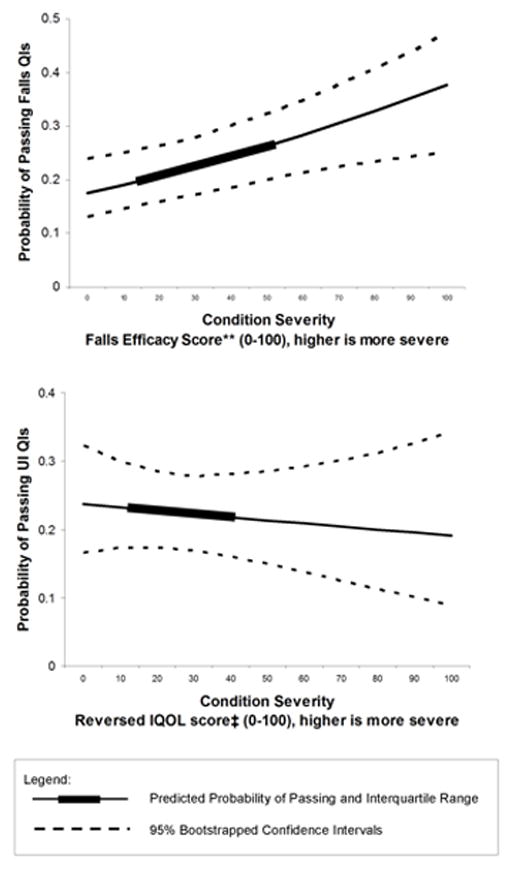
Probability* of Passing Falls and UI Quality Indicators
* Predicted probabilities are based upon a multivariable logistic regression that controlled for intervention versus control group, interaction between FES score or rIQOL score and intervention versus control group, age, gender, number of QIs triggered, and secondary versus primary QI. Displayed predicted values are for an 81-year old woman in the control group triggering a primary QI. 95% confidence intervals were obtained by bootstrapping.
** FES score was rescaled to range from 0 to 100 (higher is more fear of falling). Median FES scores was 30 (interquartile range 13–53).
‡Reversed IQOL scores range from 0 to 100 (higher is more symptomatic). Median rIQOL score was 23 (interquartile range 11–40).
FES = Falls Efficacy Score
IQOL = reversed Incontinence Quality of Life
UI = Urinary Incontinence
QIs = Quality Indicators
UI Analysis
There was no relationship between rIQOL and UI quality of care in unadjusted and adjusted logistic regressions (Table 3 and Fig 2).
DISCUSSION
In this study of subjective disease severity and quality of care, we found a small effect of concern about falling on quality of falls care (a 7% absolute difference in quality of care over the FES interquartile range). There was no relationship between distress due to UI symptoms and quality of care.
The mild effect of patient-reported fear of falling on falls care is consistent with prior research. Greater fear of falling is related to likelihood of falling,37–39 so physicians may have provided more recommended falls care to patients with higher FES scores to prevent falls in higher-risk patients with greater potential for benefit.36, 39 Higher patient-reported FES scores may reflect greater patient priority in receiving falls care, which is consistent with prior work suggesting that greater symptom severity is associated with healthcare-seeking behavior.45–47 Also, greater severity increases the likelihood of clinical detection.48
However, even patients with severe fear of falling or incontinence symptoms do not receive high quality of care. Thus, the degree of patient-reported severity for falls and UI is not the overall basis of poor care for these conditions.
Our findings have implications for the science of quality measurement. Process-of-care QIs, typically identify a single clinical threshold at which a particular care process should be performed for all eligible patients. In most cases, they represent a minimum standard of quality of care for a population. They do not typically require an increasing intensity of care in response to small increments in patient-perceived disease severity; hence, most process-of-care QIs do not adjust for severity. Finding little or no association between patient-perceived disease severity and performance provides support that adjustment for patient-perceived disease severity is unnecessary.
The minimal relationship between patient-reported disease severity and quality of care for falls and lack of relationship for UI is contrary to findings in hypertension, HIV, and pneumonia where objective clinical severity relates to measured quality of care. 31–33 This may be because clinicians in our study were not provided with FES and IQOL scores, whereas clinicians were likely aware of clinical disease severity in the cited studies. Additionally, we considered whether the screening questions identified patients with mild conditions; however, FES and IQOL scores suggest moderate-to-severe concern for falling and distressing UI, and other studies have used similar questions to screen for falls49 and fear of falling39 interventions. Last, UI and falls care may be considered less critical or more burdensome than care for conditions studied previously.
This study has several limitations. Although FES and IQOL scores are associated with objective clinical indicators of falls and UI severity (e.g., future falls36–39 and number of incontinent episodes per week40, 41), it is possible that they were inadequate proxies for overall clinical severity; better measures could be collected in the future. We did not measure other types of patient-reported variables that have been hypothesized to affect quality of care such as patients’ trust in their physician.50 Our sample lacked ethnic diversity. We lacked sample size to analyze each quality indicator separately. Finally, our results are not generalizable to older patients who require proxies due to cognitive impairment.
Despite these limitations, we were able to rigorously examine patient-reported disease severity using scales that differentiated our subjects on a continuum of severity, and the symptom surveys were administered prior to delivery of care in anticipation of this planned analysis. We believe that our results are generalizable to older community-dwelling elders because our study selected a sample based only on age and screening questions specific to the diseases studied.
In conclusion, this study found that patient-reported fall severity is weakly related to quality of care, and patient-reported UI severity is not associated with quality of care. Given the wide gap between falls care1, 34 and recommended care, the relationship between patient-perceived severity and quality is likely of little consequence.
Acknowledgments
Dr. Min is supported by the AHRQ (R21 HS017621). Dr. Min was on the UCLA faculty during the writing of this manuscript, supported by NIA-UCLA (K12 AG001004). Dr. Ganz is funded by the U.S. Department of Veterans Affairs, Veterans Health Administration, VA Health Services Research & Development (HSR&D) Service through the VA Greater Los Angeles HSR&D Center of Excellence (Project # VA CD2 08-012-1). This research was also supported by the UCLA Claude Pepper Older Americans Independence Center funded by the National Institute of Aging (AG028748).
References
- 1.Wenger NS, Solomon DH, Roth CP, et al. The quality of medical care provided to vulnerable community-dwelling older patients. Ann Intern Med. 2003;139:740–747. doi: 10.7326/0003-4819-139-9-200311040-00008. [DOI] [PubMed] [Google Scholar]
- 2.Landon BE, Zaslavsky AM, Bernard SL, et al. Comparison of performance of traditional Medicare vs Medicare managed care. Jama. 2004;291:1744–1752. doi: 10.1001/jama.291.14.1744. [DOI] [PubMed] [Google Scholar]
- 3.Pham HH, Schrag D, Hargraves JL, et al. Delivery of preventive services to older adults by primary care physicians. Jama. 2005;294:473–481. doi: 10.1001/jama.294.4.473. [DOI] [PubMed] [Google Scholar]
- 4.Mehrotra A, Epstein AM, Rosenthal MB. Do integrated medical groups provide higher-quality medical care than individual practice associations? Ann Intern Med. 2006;145:826–833. doi: 10.7326/0003-4819-145-11-200612050-00007. [DOI] [PubMed] [Google Scholar]
- 5.Fairchild DG, McLoughlin KS, Gharib S, et al. Productivity, quality, and patient satisfaction: comparison of part-time and full-time primary care physicians. J Gen Intern Med. 2001;16:663–667. doi: 10.1111/j.1525-1497.2001.01111.x. [DOI] [PMC free article] [PubMed] [Google Scholar]
- 6.Diette GB, Skinner EA, Nguyen TT, et al. Comparison of quality of care by specialist and generalist physicians as usual source of asthma care for children. Pediatrics. 2001;108:432–437. doi: 10.1542/peds.108.2.432. [DOI] [PubMed] [Google Scholar]
- 7.Wu AW, Young Y, Skinner EA, et al. Quality of care and outcomes of adults with asthma treated by specialists and generalists in managed care. Arch Intern Med. 2001;161:2554–2560. doi: 10.1001/archinte.161.21.2554. [DOI] [PubMed] [Google Scholar]
- 8.Ayanian JZ, Hauptman PJ, Guadagnoli E, et al. Knowledge and practices of generalist and specialist physicians regarding drug therapy for acute myocardial infarction. N Engl J Med. 1994;331:1136–1142. doi: 10.1056/NEJM199410273311707. [DOI] [PubMed] [Google Scholar]
- 9.Cheng EM, Swarztrauber K, Siderowf AD, et al. Association of specialist involvement and quality of care for Parkinson’s disease. Mov Disord. 2007;22:515–522. doi: 10.1002/mds.21311. [DOI] [PubMed] [Google Scholar]
- 10.Smetana GW, Landon BE, Bindman AB, et al. A comparison of outcomes resulting from generalist vs specialist care for a single discrete medical condition: a systematic review and methodologic critique. Arch Intern Med. 2007;167:10–20. doi: 10.1001/archinte.167.1.10. [DOI] [PubMed] [Google Scholar]
- 11.Shekelle PG, MacLean CH, Morton SC, et al. Acove quality indicators. Ann Intern Med. 2001;135:653–667. doi: 10.7326/0003-4819-135-8_part_2-200110161-00004. [DOI] [PubMed] [Google Scholar]
- 12.Backer V, Nepper-Christensen S, Nolte H. Quality of care in patients with asthma and rhinitis treated by respiratory specialists and primary care physicians: a 3-year randomized and prospective follow-up study. Ann Allergy Asthma Immunol. 2006;97:490–496. doi: 10.1016/S1081-1206(10)60940-4. [DOI] [PubMed] [Google Scholar]
- 13.Walsh JM, Swangard DM, Davis T, et al. Exercise counseling by primary care physicians in the era of managed care. Am J Prev Med. 1999;16:307–313. doi: 10.1016/s0749-3797(99)00021-5. [DOI] [PubMed] [Google Scholar]
- 14.Lewis CE, Clancy C, Leake B, et al. The counseling practices of internists. Ann Intern Med. 1991;114:54–58. doi: 10.7326/0003-4819-114-1-54. [DOI] [PubMed] [Google Scholar]
- 15.Chodosh J, Petitti DB, Elliott M, et al. Physician recognition of cognitive impairment: evaluating the need for improvement. J Am Geriatr Soc. 2004;52:1051–1059. doi: 10.1111/j.1532-5415.2004.52301.x. [DOI] [PubMed] [Google Scholar]
- 16.Choudhry NK, Fletcher RH, Soumerai SB. Systematic review: the relationship between clinical experience and quality of health care. Ann Intern Med. 2005;142:260–273. doi: 10.7326/0003-4819-142-4-200502150-00008. [DOI] [PubMed] [Google Scholar]
- 17.Min LC, Wenger NS, Fung C, et al. Multimorbidity is associated with better quality of care among vulnerable elders. Med Care. 2007;45:480–488. doi: 10.1097/MLR.0b013e318030fff9. [DOI] [PubMed] [Google Scholar]
- 18.Min LC, Reuben DB, MacLean CH, et al. Predictors of overall quality of care provided to vulnerable older people. J Am Geriatr Soc. 2005;53:1705–1711. doi: 10.1111/j.1532-5415.2005.53520.x. [DOI] [PubMed] [Google Scholar]
- 19.Higashi T, Wenger NS, Adams JL, et al. Relationship between number of medical conditions and quality of care. N Engl J Med. 2007;356:2496–2504. doi: 10.1056/NEJMsa066253. [DOI] [PubMed] [Google Scholar]
- 20.Turner BJ, Hollenbeak CS, Weiner M, et al. Effect of unrelated comorbid conditions on hypertension management. Ann Intern Med. 2008;148:578–586. doi: 10.7326/0003-4819-148-8-200804150-00002. [DOI] [PubMed] [Google Scholar]
- 21.Piette JD, Kerr EA. The impact of comorbid chronic conditions on diabetes care. Diabetes Care. 2006;29:725–731. doi: 10.2337/diacare.29.03.06.dc05-2078. [DOI] [PubMed] [Google Scholar]
- 22.Miller M, Byington R, Hunninghake D, et al. Sex bias and underutilization of lipid-lowering therapy in patients with coronary artery disease at academic medical centers in the United States and Canada. Prospective Randomized Evaluation of the Vascular Effects of Norvasc Trial (PREVENT) Investigators. Arch Intern Med. 2000;160:343–347. doi: 10.1001/archinte.160.3.343. [DOI] [PubMed] [Google Scholar]
- 23.Humphries KH, Kerr CR, Connolly SJ, et al. New-onset atrial fibrillation: sex differences in presentation, treatment, and outcome. Circulation. 2001;103:2365–2370. doi: 10.1161/01.cir.103.19.2365. [DOI] [PubMed] [Google Scholar]
- 24.Etzioni DA, Yano EM, Rubenstein LV, et al. Measuring the quality of colorectal cancer screening: the importance of follow-up. Dis Colon Rectum. 2006;49:1002–1010. doi: 10.1007/s10350-006-0533-2. [DOI] [PubMed] [Google Scholar]
- 25.Burack RC, Gurney JG, McDaniel AM. Health status and mammography use among older women. J Gen Intern Med. 1998;13:366–372. doi: 10.1046/j.1525-1497.1998.00116.x. [DOI] [PMC free article] [PubMed] [Google Scholar]
- 26.McCall DT, Sauaia A, Hamman RF, et al. Are low-income elderly patients at risk for poor diabetes care? Diabetes Care. 2004;27:1060–1065. doi: 10.2337/diacare.27.5.1060. [DOI] [PubMed] [Google Scholar]
- 27.Rathore SS, Foody JM, Wang Y, et al. Race, quality of care, and outcomes of elderly patients hospitalized with heart failure. Jama. 2003;289:2517–2524. doi: 10.1001/jama.289.19.2517. [DOI] [PubMed] [Google Scholar]
- 28.Steingart RM, Packer M, Hamm P, et al. Sex differences in the management of coronary artery disease. Survival and Ventricular Enlargement Investigators. N Engl J Med. 1991;325:226–230. doi: 10.1056/NEJM199107253250402. [DOI] [PubMed] [Google Scholar]
- 29.Fagard RH, Van den Enden M. Treatment and blood pressure control in isolated systolic hypertension vs diastolic hypertension in primary care. J Hum Hypertens. 2003;17:681–687. doi: 10.1038/sj.jhh.1001598. [DOI] [PubMed] [Google Scholar]
- 30.Kerr EA, Zikmund-Fisher BJ, Klamerus ML, et al. The role of clinical uncertainty in treatment decisions for diabetic patients with uncontrolled blood pressure. Ann Intern Med. 2008;148:717–727. doi: 10.7326/0003-4819-148-10-200805200-00004. [DOI] [PubMed] [Google Scholar]
- 31.Asch SM, Fremont AM, Turner BJ, et al. Symptom-based framework for assessing quality of HIV care. Int J Qual Health Care. 2004;16:41–50. doi: 10.1093/intqhc/mzh004. [DOI] [PubMed] [Google Scholar]
- 32.Fine JM, Fine MJ, Galusha D, et al. Patient and hospital characteristics associated with recommended processes of care for elderly patients hospitalized with pneumonia: results from the medicare quality indicator system pneumonia module. Arch Intern Med. 2002;162:827–833. doi: 10.1001/archinte.162.7.827. [DOI] [PubMed] [Google Scholar]
- 33.Dedier J, Singer DE, Chang Y, et al. Processes of care, illness severity, and outcomes in the management of community-acquired pneumonia at academic hospitals. Arch Intern Med. 2001;161:2099–2104. doi: 10.1001/archinte.161.17.2099. [DOI] [PubMed] [Google Scholar]
- 34.Wenger NS, Roth CP, Shekelle PG, et al. A practice-based intervention to improve primary care for falls, urinary incontinence, and dementia. J Am Geriatr Soc. 2009;57:547–555. doi: 10.1111/j.1532-5415.2008.02128.x. [DOI] [PubMed] [Google Scholar]
- 35.Reuben DB, Roth C, Kamberg C, et al. Restructuring primary care practices to manage geriatric syndromes: the ACOVE-2 intervention. J Am Geriatr Soc. 2003;51:1787–1793. doi: 10.1046/j.1532-5415.2003.51565.x. [DOI] [PubMed] [Google Scholar]
- 36.Tinetti ME, Richman D, Powell L. Falls efficacy as a measure of fear of falling. J Gerontol. 1990;45:239–243. doi: 10.1093/geronj/45.6.p239. [DOI] [PubMed] [Google Scholar]
- 37.Powell LE, Myers AM. The Activities-specific Balance Confidence (ABC) Scale. J Gerontol A Biol Sci Med Sci. 1995;50A:M28–34. doi: 10.1093/gerona/50a.1.m28. [DOI] [PubMed] [Google Scholar]
- 38.Kressig RW, Wolf SL, Sattin RW, et al. Associations of demographic, functional, and behavioral characteristics with activity-related fear of falling among older adults transitioning to frailty. J Am Geriatr Soc. 2001;49:1456–1462. doi: 10.1046/j.1532-5415.2001.4911237.x. [DOI] [PubMed] [Google Scholar]
- 39.Cumming RG, Salkeld G, Thomas M, et al. Prospective study of the impact of fear of falling on activities of daily living, SF-36 scores, and nursing home admission. J Gerontol A Biol Sci Med Sci. 2000;55:M299–305. doi: 10.1093/gerona/55.5.m299. [DOI] [PubMed] [Google Scholar]
- 40.Wagner TH, Patrick DL, Bavendam TG, et al. Quality of life of persons with urinary incontinence: development of a new measure. Urology. 1996;47:67–71. doi: 10.1016/s0090-4295(99)80384-7. discussion 71–62. [DOI] [PubMed] [Google Scholar]
- 41.Patrick DL, Martin M, Bushnell DM. The I-QOL: A Quality-of-Life Instrument Specific to Persons with Urinary Incontinence: User’s Manual and Scoring Diskette for United States. Seattle, Washington: Health Research Associates, Inc; 1999. [Google Scholar]
- 42.Solomon DH, Wenger NS, Saliba D, et al. Appropriateness of quality indicators for older patients with advanced dementia and poor prognosis. J Am Geriatr Soc. 2003;51:902–907. doi: 10.1046/j.1365-2389.2003.513331.x. [DOI] [PubMed] [Google Scholar]
- 43.Royston P. Multiple imputation of missing values: Update of ice. Stata Journal. 2005;5:527–536. [Google Scholar]
- 44.Higashi T, Hays RD, Brown JA, et al. Do proxies reflect patients’ health concerns about urinary incontinence and gait problems? Health Qual Life Outcomes. 2005;3:75. doi: 10.1186/1477-7525-3-75. [DOI] [PMC free article] [PubMed] [Google Scholar]
- 45.Kinchen KS, Burgio K, Diokno AC, et al. Factors associated with women’s decisions to seek treatment for urinary incontinence. J Womens Health (Larchmt) 2003;12:687–698. doi: 10.1089/154099903322404339. [DOI] [PubMed] [Google Scholar]
- 46.Peters TJ, Horrocks S, Stoddart H, et al. Factors associated with variations in older people’s use of community-based continence services. Health Soc Care Community. 2004;12:53–62. doi: 10.1111/j.1365-2524.2004.00468.x. [DOI] [PubMed] [Google Scholar]
- 47.Diokno AC, Burgio K, Fultz NH, et al. Medical and self-care practices reported by women with urinary incontinence. Am J Manag Care. 2004;10:69–78. [PubMed] [Google Scholar]
- 48.Borowsky SJ, Rubenstein LV, Meredith LS, et al. Who is at risk of nondetection of mental health problems in primary care? J Gen Intern Med. 2000;15:381–388. doi: 10.1046/j.1525-1497.2000.12088.x. [DOI] [PMC free article] [PubMed] [Google Scholar]
- 49.Cwikel JG, Fried AV, Biderman A, et al. Validation of a fall-risk screening test, the Elderly Fall Screening Test (EFST), for community-dwelling elderly. Disabil Rehabil. 1998;20:161–167. doi: 10.3109/09638289809166077. [DOI] [PubMed] [Google Scholar]
- 50.Gallagher TH, Levinson W. A prescription for protecting the doctor-patient relationship. Am J Manag Care. 2004;10:61–68. [PubMed] [Google Scholar]