Abstract
Diabetes is a lifelong condition that may cause death and seriously affects the quality of life of a rapidly growing number of individuals. Acetone is a selective breath marker for diabetes that may contribute to the monitoring of related metabolic disorder and thus simplify the management of this illness. Here, the overall performance of Si-doped WO3 nanoparticles made by flame spray pyrolysis as portable acetone detectors is critically reviewed focusing on the requirements for medical diagnostic. The effect of flow rate, chamber volume and acetone dissociation within the measuring chamber are discussed with respect to the calibration of the sensor response. The challenges for the fabrication of portable breath acetone sensors based on chemo-resistive detectors are underlined indicating possible solutions and novel research directions.
1. Introduction
New methods such as non-invasive diagnostics by human breath analysis bear the potential to drastically reduce the costs of medical care [1]. Standard medical diagnostic (e.g. blood analysis) has reached the limit of further economization as trained human resources are required. Modern non-invasive medical diagnostic by breath analysis started in 1970 by the classification of more than 200 components in human breath [2]. The bulk matrix of the breath is a mixture of nitrogen, oxygen, carbon dioxide, water, and inert gases. The remaining small fraction consists of more than 1000 trace volatile organic compounds (VOCs) with concentrations ranging from parts per million (ppm) to parts per trillion (ppt) by volume [1]. Some of the endogenous compounds found in human breath, such as inorganic gas (e.g. NO, CO) and VOCs (e.g. acetone, ethanol, ammonia, ethane, pentane), has been successfully identified as breath markers for several diseases [1,3].
Diabetes is a lifelong condition that may cause death and seriously decrease the quality of life. The number of persons suffering from diabetes (type-1 and -2) is increasing due to population growth, aging, urbanization, and increasing occurrence of obesity and physical inactivity [4]. Acetone is a specific breath marker for type-1 diabetes [1,5] and its concentration increases from 300 - 900 ppb for healthy humans [6] to more than 1800 ppb [7] for diabetic patients. Furthermore, several studies are suggesting that breath acetone concentration may be correlated with blood glucose level and thus its determination as potential to become a new standard for insulin management [5,8].
Application of breath analysis to acetone detection has already shown the potential to rapidly distinguish between healthy and diabetic patients. These remarkable results were achieved thank to the great improvements in analytical devices and breath analysis techniques achieved in the last years [9]. Currently, breath acetone testing is carried out by GC followed by flame ionization detection [10], ion mobility spectrometry [11], and MS detection [12]. These methods need bulky instrumentation and skilled operators. Sample collection and preconcentration involving a complicated procedure is required before introduction of the collected sample into a gas chromatographic column. Furthermore, some or all of the breath acetone may be lost during these time-consuming procedures. Because of these limitations, these methods are not very suitable for use in diabetes diagnosis and acetone monitoring outside the laboratory. In fact, to meet the requirements for clinic applications, the sensing devices need, in addition to the already demonstrated sensitivity and selectivity, also sufficient portability and affordable production cost. With respect to the latter, chemo-resistive gas sensors are solid state devices that have a strong miniaturization potential while offering very high sensitivities down to the ppb range [13] and thus may become a key technology for commercial implementation of breath analysis [14].
Metal oxide nanoparticles of few nanometers are, to date, state-of-the-art material for chemo-resistive gas sensing [14-16]. This is attributed to the strong interaction between surface states and electronic conductivity for particle size close to twice the material Debye length [14,17]. Furthermore, the high specific surface area of the nanoparticles allows minimization of the required material for fabrication of the detector (e.g. nanoparticle film) decreasing considerably its production costs [13]. Fabrication of portable [18] and even fully integrated [19] gas sensors constituted by thin films of metal oxide nanoparticles has been copiously [20,21] demonstrated showing excellent sensing performances [22] and very low (< 100 mW) power consumptions [18]. On the other side, a major drawback of chemo-resistive nanoparticles as gas detectors is their poor selectivity that limits their application for the analysis of complex gas mixtures such as the breath. As a result, a main challenge is the synthesis of tailored nanoparticles able to specifically detect the target analyte in unpredictable and varying measurement conditions (e.g. relative humidity, pressure, temperature and disturbing analyte).
Among the various sensing metal oxide (Table 1), TiO2, WO3 and SnO2 based gas sensors have shown the highest sensitivity to low concentrations of acetone. Their relatively high operation temperatures (Table 1) are not a strong limitation as implementation of optimized substrate layouts such as micro-hot plates allow the realization of portable devices with low power consumption [19]. A critical analysis, however, shows that TiO2 is also very sensitive to isoprene [23] while SnO2 is well known for its high sensitivity to ethanol [17] and cross sensitivity to water vapor [24]. In contrast, the ε-phase of WO3 has demonstrated very high selectivity toward acetone with respect to several analytes such as CO, NO2 and ethanol [25]. Recently, the optimization and mandatory stabilization of the ε-phase content of WO3 nanoparticles up to the operating temperature of chemo-resistive metal oxide gas sensors has been achieved by Si-doping during its flame synthesis [26]. This method, already demonstrated for SnO2 is able to enhance the sensitivity of the original MOX while drastically improving its thermal stability [17]. Flame aerosol processes are a powerful alternative for the synthesis of single and mixed metal oxide nanoparticles [14]. In addition to their easy scalability, the rapid heating and cooling during combustion can capture meta-stable phases, such as ε-WO3, [25-27] while assuring high purity [28] of the products and production rate [14]. FSP has been successfully applied to the direct deposition of nanoparticle films onto sensor substrates leading to high sensitivity and low limit of detection (ppb). Furthermore, the mechanical stability of such nanoparticle films has been improved by rapid in-situ annealing [22] allowing their integration into standard micro devices fabrication processes [18].
Table 1.
Acetone detection in dry air by chemo-resistive gas sensors.
| Material | Process | Sensor response (-) to acetone [ppm] | LOD (ppm) | Temperature (°C) | Ref. |
|---|---|---|---|---|---|
|
| |||||
| Fe2O3/Pt | Wet-method | 4.2 [10] | 10 | 300 | [42] |
| Fe2O3/RuO2 | Wet-method | 1.5 [10] | 10 | 300 | [42] |
| SnO2 | Dip-coating | 2 [3] | 2 | RT | [43] |
| TiO2 | Drop-coating | 4 [1] | 1 | 500 | [23] |
| SnO2-ZnO | Wet-method | 2.3 [200] | 200 | 300 | [44] |
| Cr-WO3 | Drop-coating | 1 [0.5] | 0.2 | 400 | [25] |
| Ce-SnO2 | Dip-coating | 75 [100] | 100 | 210 | [45] |
| Si-WO3 | FSP | 4.1 [0.5] | 0.02 | 400 | [26] |
| ZnO | RF-SPU | 0.2 [60] | 15 | 400 | [46] |
Sensor response: Rair/Ranalyte − 1; LOD: Limit of detection
The acetone sensing performance of such Si-doped WO3 nanoparticle films has been tested in simulated breath conditions (up to 90% rh) showing extremely high sensitivity and signal to noise ratio down to less than 30 ppb acetone [27]. For a fundamental understanding, the high interaction between acetone and the WO3 surface (reception function) is complex, cannot be merely simplified to the role played by the dipole moments and require further studies [27]. However, for practical applications the main challenges are the characterization of such Si-WO3 sensors in real conditions and to other potential disturbing analytes that may be found in the breath. More in specific, the breath concentration of several endogenous VOCs can change remarkably has a function of metabolic activity and test conditions and thus require further characterization. Furthermore, the effect of flow rate, temperature, chamber volume on the sensor response are not trivial and require accurate characterization and optimization.
Here, the challenges for the fabrication of portable Si-WO3 sensors for acetone detection are critically reviewed underlining the strength and the open questions of this promising technology. To this goal pure and Si-doped WO3 nanoparticle films have been deposited by flame spray pyrolysis on sensor substrates. The properties of these sensors are summarized by exemplary results obtained by acetone detection in simulated conditions and discussed with respect to the measurement procedures. The role of carrier gas flow rate and of measurement temperature on the acetone decomposition and analyte mass transfer to the WO3 nanoparticle film during sensor measurement is assessed with respect to the overall performance. Finally, general guidelines for the fabrication of portable Si-WO3 sensors are presented.
2. Experimental
2.1 Sensor Fabrication
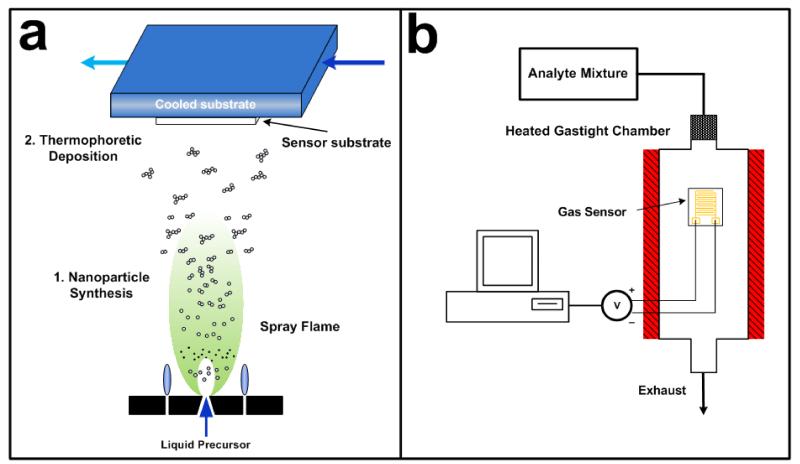
A flame spray pyrolysis (FSP) reactor was used [29] for synthesis and direct deposition of pure and Si-doped WO3 nanoparticles films onto Al2O3 substrates featuring a set of interdigitated Au electrodes (Figure 1a). Sensing nanoparticles were prepared as follows: Ammonium (meta)tungstate hydrate (Aldrich, purity > 97%) and hexamethyldisiloxane (HMDSO, Aldrich, purity > 99%) were mixed, as dictated by the final Si molar content, and diluted in a 1:1 (volume ratio) mixture of diethylene glycol monobutyl ether (Fluka, purity > 98.5%) and ethanol (Fluka, purity > 99.5%) with a total metal atom (Si and W) concentration of 0.2 M. This solution was supplied at a rate of 5 ml/min through the FSP nozzle and dispersed to a fine spray with 5 l/min oxygen (pressure drop 1.5 bar). That spray was ignited by a supporting ring-shaped premixed methane/oxygen flame. Powder samples were collected with a vacuum pump on a water-cooled glass-fiber filter (GF/D Whatman, 257 mm diameter) placed 50 cm above the burner, downstream of the sensor substrate. The films were annealed and mechanically stabilized in-situ by lowering the substrate holder to NS = 14 cm and impinging a particle-free (no metal precursor), xylene-fed spray flame (12 ml/min) onto the film for 30 s [22]. Flame settings used are described more in detail elsewhere [26].
Figure 1.
(a) Sensor fabrication schematic: metal oxide nanoparticles are produced by combustion and pyrolysis of a precursor solution in a FSP reactor and directly deposited onto cooled sensor substrate consisting of Al2O3 support with interdigitated Au electrodes. (b) Sensor characterization setup: analyte mixtures are dosed by mass flow controllers. The detector is kept in an oven and connected to a voltmeter to mesasure the film resistance.
2.2 Particle and Film Characterization
X-ray diffraction (XRD) patterns were obtained by a Bruker, AXS D8 Advance diffractometer operated at 40 kV, 40 mA at 2θ (Cu Kα) = 10 - 60°, step = 0.04° and scan speed = 0.8°/min. The crystal size (dXRD) was determined using the Rietveld fundamental parameter method with the structural parameters of monoclinic γ and ε-WO3 [30,31]. The powder specific surface area (SSA) was measured by BET analysis using a Micromeritics Tristar 3000. The BET equivalent diameter was calculated using the density of WO3 (7.16 g/cm3) and SiO2 (2.19 g/cm3) for the given composition. The morphology, patterning characteristics and thickness of the deposited sensing films were investigated by scanning electron microscopy (SEM) with a LEO 1530 Gemini (Zeiss/LEO,Oberkochen) and a Tecnai F30 microscope (FEI (Eindhoven); field emission cathode, operated at 2 kV).
2.3 Sensor Characterization
Sensor measurements were performed as described in detail elsewhere [27]. Prior to sensing tests, the sensors were kept in an oven (Carbolite) at 500 °C for 5 hours to thermally stabilize them and avoid nanoparticle sintering and thereby drift of the sensor signal during testing. Humidified air was generated by bubbling synthetic air ((20.8 ± 2)% O2 rest nitrogen, Pan Gas 5.0) through distilled water maintained below room temperature at TB = 20 °C to avoid condensation in the pipes. Acetone (10 ppm in synthetic air, Pan Gas 5.0) or ethanol (10 ppm in synthetic air, Pan Gas 5.0) were controlled by a separate mass flow controller and diluted further with synthetic air to reach the desired concentration. The sensors were placed in a quartz tube (3.5 cm in diameter and 35 cm long) located in a tubular furnace (Nabertherm) and connected to a voltmeter (Keithley, 2700 Multimeter/Data acquisition system) to measure the film resistance (Figure 1b). The operating temperature was varied between 325 and 500 °C and measured with a n-type thermocouple placed above the sensor. The stream exiting the furnace was analyzed by a mass spectrometer (MS, Pfeiffer, Vacuum Thermostar) at high analyte concentrations (> ppm).The sensor response (S) is defined as:
| (1) |
where Rair is the film resistance in air with a given rh and Ranalyte is the film resistance with a given concentration of acetone or ethanol at the same rh.
3. Results and Discussion
Flame spray pyrolysis (FSP) is capable of producing mixed metal oxide powders in the 1-200 nm range from low-cost precursor [32] with high production rate. The precursor preparation is a delicate step for the successful synthesis of tailored nanoparticles [33]. The precursor composition has a remarkable influence on the product particle morphology, crystallinity and size [34-35]. Here, ammonium (meta)tungstate hydrate was used as precursor for the synthesis of WO3 nanoparticles. Starting from this solid precursor, the formation of a homogeneous liquid solution is not trivial. More in specific, a maximum total metal atoms (W) concentration of 0.2 mol/l was allowed in order to completely dissolve the solid phase and obtain a clear solution.
Films of pure and Si-doped WO3 nanoparticles have been fabricated by flame spray pyrolysis (FSP) and utilized as chemo-resistive acetone detectors. The nanoparticles were directly deposited from the aerosol (Figure 1a) onto dielectric substrates bearing a couple of interdigitated Au electrodes. The temperature difference between the hot flame aerosol and the cooled substrate induces a strong thermophoretic flux that leads to the rapid (1 – 4 min) growth of the nanoparticle film. However, the as deposited films are characterized by very low adhesion/cohesion and require further mechanical stabilization. This was obtained in-situ by applying rapidly high thermal and mechanical stress with a particle-free xylene flame which drastically changes the patterns morphology as previously reported for flame-made SnO2 nanoparticle [22]. The resulting nanoparticle films are very stable and can sustain further handling as required by standard micro-machining processes. Furthermore, they retain the large specific surface area of the nanoparticles and very high porosity [22]. This morphology has strong potential for gas sensors as it effectively enhances the interaction with analyte and thus results in very high sensor response [14].
3.1 Particles and Layer Analysis
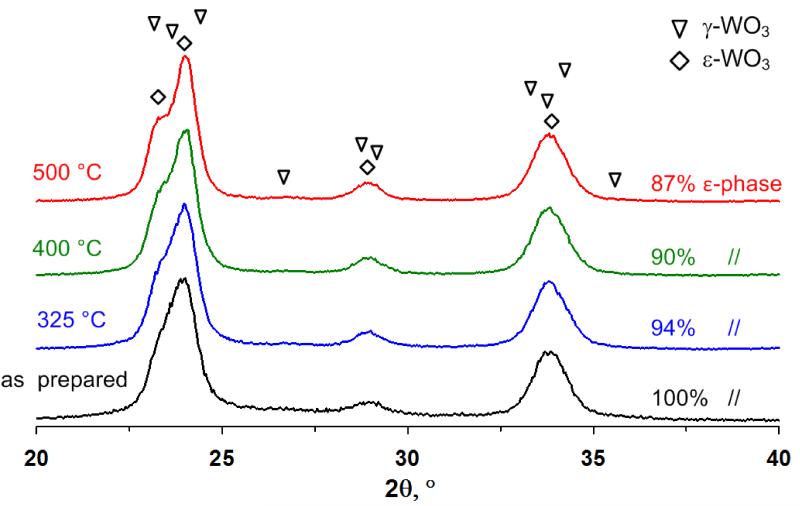
Pure WO3 particles had an average grain size of 13 nm. The grain size was slightly decreased to 12 – 10 nm by Si-doping at 10 and 20% content, respectively [26]. The XRD spectra of the as prepared Si-doped samples revealed only the presence of the acetone selective ε-WO3 phases. Furthermore, the thermal evolution of the XRD spectra (Figure 2) for 10 mol% Si-doped WO3 indicates that Si-doping successfully stabilizes the ε-phase (diamonds) up to 500 °C. However, the ε-phase is slightly decreased from 100 to 87% (Figure 2) by annealing at 500 °C for 5 hours.
Figure 2.
XRD pattern (2θ = 20 - 40°) of 10 mol% Si-doped WO3 nanoparticles at different annealing temperature (325 - 500 °C for 5 h in air). With annealing the ε-phase content is decreasing, however, the γ peaks are still not clearly distinguishable up to 500 °C.
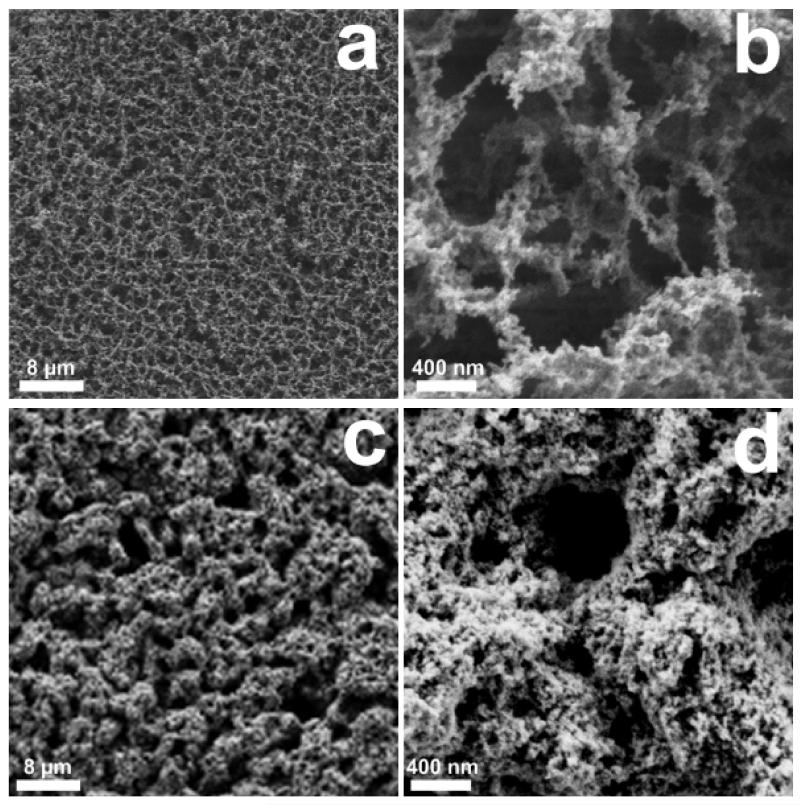
The final gas detectors consisted of chemo-resistive pure or Si-doped WO3 films deposited on sensor substrates. As discussed above, the films were made of highly gas sensitive nanoparticles and had high porosity (e.g. 62% for SnO2) [22] to allow rapid infiltration of the analyte and evacuation of the products. The change in morphology between the as prepared and after mechanical stabilization WO3 film was characterized by scanning electron microscopy (SEM) analysis. These results are comparable to that obtained by in-situ annealing of SnO2 nanoparticle films [22], where the layer stability was tested by directing a N2 or water jet towards its surface. Here, the as prepared film consisted also of a uniform (Figure 3a) net of thin bridges made of loosely connected nanoparticles (b). The in-situ annealing step [22] drastically changed this film morphology. In fact, although the large-scale layer homogeneity was preserved, the dense net of thin bridges transformed into a more compact structures (Figure 3c,d) made of partially sintered nanoparticles and having higher stability. This open, porous structure facilitates the analyte transport through the sensitive layer so that analyte-induced resistance changes, which constitute the sensor response, occur rapidly in the whole sensitive layer. This positively influences the response and recovery time during gas detection and has an impact also on the sensor sensitivity as more surface is exposed to the analyte.
Figure 3.
SEM images of as prepared (a,b) and after in-situ annealing (c,d) pure WO3 nanoparticle films at high magnification. Thinly agglomerated particle bridges extend for hundreds of nm (b). After in-situ annealing the morphology is altered to more robust structures (d).
3.2 Sensor Characterization
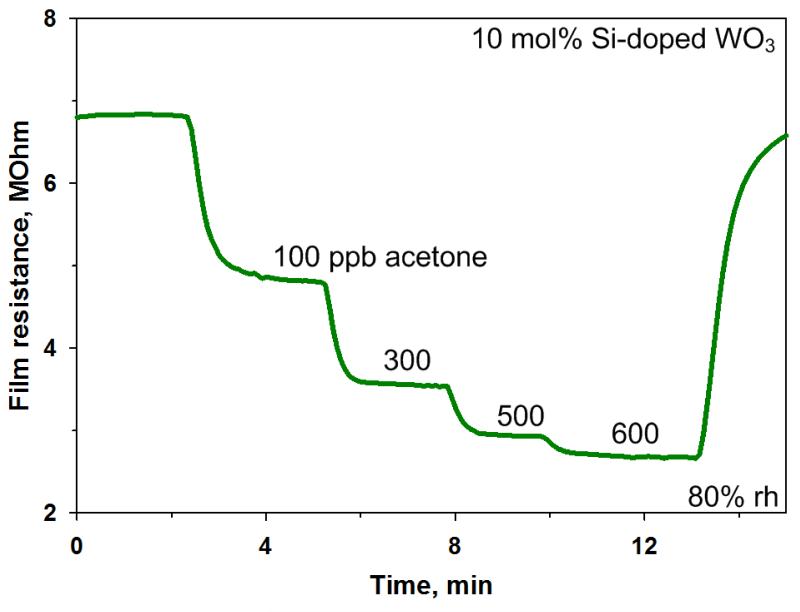
As expected for n-type nanostructured semiconductors, after the injection of the reducing analyte (here, acetone), the sensor resistance was rapidly decreased [36]. Figure 4 shows typical resistance plot of a 10 mol% Si-doped WO3 sensor upon exposure to various acetone concentrations at a temperature of 400 °C in 80% relative humidity (rh). A strong signal to noise ratio and a rapid stabilization of the sensor resistance upon variation in the acetone concentration are strong assets of these Si-WO3 detectors. From these measurements the sensor performance was computed for each acetone concentration leading to a sensor response more than 1.6 for injection of 600 ppb of acetone. It was previously demonstrated that such ε-WO3 sensors are able to discriminate between the expected breath acetone concentrations of healthy humans (< 900 ppb) and diabetic patients (> 1800 ppb) by a remarkable gap (~40%) in sensor response [27]. In fact, for such sensors, the response to 1800 ppb acetone with 90% relative humidity was above 3 [27]. With respect to other metal oxides (Table 1), comparing similar experimental conditions (dry air), the sensor response of this 10 mol% Si-doped WO3 nanoparticles was the highest. Furthermore, the sensor response time to 100 ppb acetone, defined as the time needed to reach 90% of the response, was relatively small (~1.3 min) at 80% rh (Figure 4). However, smaller response times are required in the clinical diagnostic since the exhalation time of a patient is limited. Micro-gas sensors demonstrated shorter response time (~14 seconds) and thus optimization and miniaturization of the sensing chamber may be a viable solution to reduce it [22]. Here, the relatively large sensor response time could be attributed to too small carrier gas flow with respect to the chamber volume (flow velocity < 0.02 m/s) and thus the response time can be limited by mass transfer of the analyte to the sensing film instead from the actual reaction rate. Furthermore, large chambers are often subject to long concentration transients with some spatial inhomogeneity [37]. Geometrical parameters, such as shape and inlet/outlet position play an important role for the development of flow conditions and gas concentration profile inside the chamber [37]. In addition to affecting the actual sensor response, these parameters also greatly influence the response time as discussed above. Since short response times (e.g. less than 1 minute) are usually required for online monitoring of the breath [9], it is advantageous to keep the testing chamber volume as small as possible.
Figure 4.
Sensor resistance change of 10 mol% Si-doped WO3 nanoparticle film exposed to different acetone concentrations at 400 °C in 80% rh.
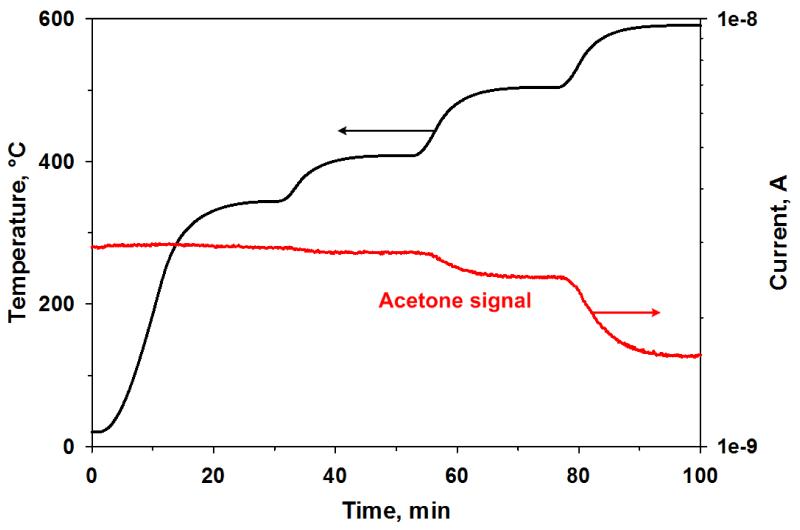
The sensor operating temperature is a key parameter during analyte detection. It influences the sensing performance both in terms of catalytic activity of the WO3 surface (e.g. reduction reactions) [38-39] and electrical properties of the semiconductor (e.g. activation of defects) [38]. Even though measurements in heated chambers are widely used for characterization of MOx gas sensors, as done here, back-heated sensors represent a considerably more realistic condition for actual breath analysis. For one, back-heated sensors can be more easily miniaturized and require low power consumption drastically enhancing the devices portability. Secondly, as the gas flow analyzed by the sensor is not heated within the chamber, potential alterations of its composition are avoided. Here, we have investigated the decomposition of acetone in a furnace utilized as standard heated chamber [23] for sensor characterization. Figure 5 shows the acetone signal (20 ppm) in air measured by MS as a function of the chamber temperature. The acetone signal starts decreasing above 400 °C and at 600 °C a remarkable portion of the MS signal is lost suggesting its dissociation/oxidation. In fact, considering that the self-ignition temperature of acetone is 465 °C, its dissociation/oxidation could also contribute to the decrease in sensor response observed at 500 °C [27]. Nevertheless, these high temperatures (300 - 500 °C) are commonly used for acetone measurements (Table 1).
Figure 5.
Acetone MS signal intensity and temperature as a function of the measurement time. Above 400°C the acetone signal intensity starts to decrease decrease indicating its dissociation/oxidation.
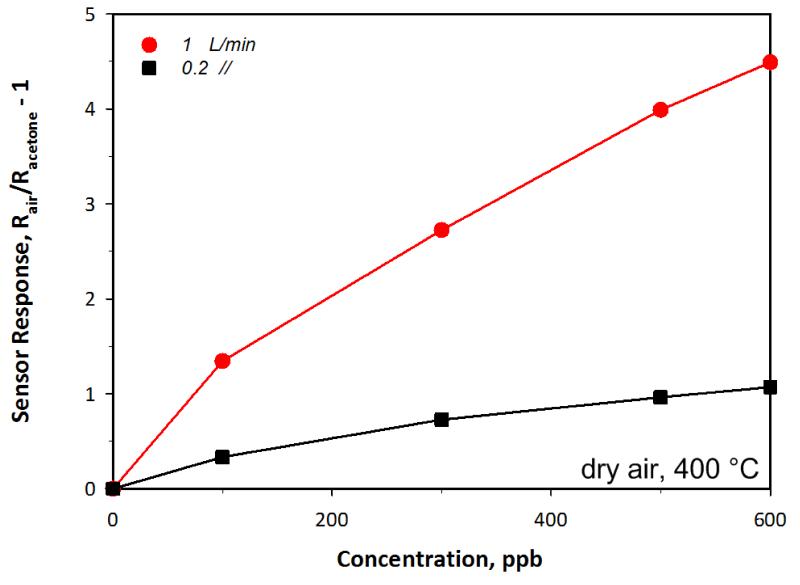
As suggested above, additional parameters, such as the volume of the chamber and the gas flow rate, need also to be considered to precisely control the static and dynamic test conditions. In fact, their flow conditions could affect the sensor response as the temperature of the sensor is influenced by heat exchange processes between the sensor and the surrounding gas [40]. Furthermore, too low flow velocities may lead to a diffusion-limited response and thus allowing strong variation of its magnitude as a function of the flow conditions. Here this was estimated by decreasing the total carrier gas flow rate supplied to the measurement chamber during sensor measurements. The sensor response to 600 ppb acetone decreased from 4.5 to 1.1 with decreasing flow total flow rate from 1 l/min (standard test conditions) to 0.2 l/min (corresponding to a flow velocity decrease from 0.017 to 0.003 m/s) resulting in a linear correlation (Figure 6) between total flow and sensor response. A similar behavior was previously observed even for back-heated SnO2 sensor during CO detection. There, the sensor response to 800 ppm CO decreased from about 700 to 400 with decreasing inlet flow rate from 0.2 to 0.05 l/min [41]. In that case, however, the volume of the testing chamber and the carrier gas flow rates supplied were both considerably smaller than here [41]. This suggests that if sufficient flow rate are not supplied, diffusion-limited instead of reaction-limited sensor response are measured leading to a poor calibration of the sensor signal.
Figure 6.
Sensor response to different acetone concentrations as a function of the total flow rate supplied to the measurement chamber. The sensor response is considerably reduced decreasing the flow rate from 1 to 0.2 l/min.
4. Conclusions
Diabetes is a serious disease that affects a growing share of the world population. A portable and low cost diagnosis device by breath analysis could help the rapid identification and medical treatment of diabetic patients at the early stage especially in developing countries. Here, Si-doped WO3 chemo-resistive gas sensors have been fabricated by flame spray pyrolysis. These nanoparticles had excellent acetone sensing properties with a great potential for application in non-invasive medical diagnostic by breath analysis. In fact, the WO3 ε-phase thermal stability was enhanced greatly by Si-doping (up to 500 °C) allowing detection in the ppb range of acetone in ideal (dry air) and realistic (90% rh) breath conditions. However, gas sensing performances such as the sensor response and the response time are also dependent on the measurement system and conditions. An optimal operating temperature for acetone detection in terms of sensor response and analyte stability was found at 400 °C. In addition, decreasing the total gas flow rate decreased the sensor response. Hence, it is important to characterize and optimize the design of both detector material and measurement chamber in order to produce reliable and high performance portable sensors for breath acetone monitoring. In this respect, miniaturization of the measurement chamber could further decrease response and recovery time while improving the stability of the sensor response to variation in carrier gas flow rates. Furthermore, the effect of the humidity on such sensors in real breath conditions needs to be assessed as previously reported for heated chamber setups and simulated breath conditions.
Acknowledgments
The authors would like to thank Dr. Frank Krumeich (EMZ, ETH Zurich) for the microscopic analysis, Prof. Sotiris E. Pratsinis for fruitful discussions, the support of the European Research Council and the Swiss National Foundation, grant 200021_130582/1.
References
- [1].Cao WQ, Duan YX. Breath analysis: Potential for clinical diagnosis and exposure assessment. Clin. Chem. 2006;52:800–811. doi: 10.1373/clinchem.2005.063545. [DOI] [PubMed] [Google Scholar]
- [2].Pauling L, Robinson AB, Teranish R, Cary P. Quantitative Analysis of Urine Vapor and Breath by Gas-Liquid Partition Chromatography. Proc. Natl. Acad. Sci. U. S. A. 1971;68:2374–2376. doi: 10.1073/pnas.68.10.2374. [DOI] [PMC free article] [PubMed] [Google Scholar]
- [3].Manolis A. The Diagnostic Potential of Breath Analysis. Clin. Chem. 1983;29:5–15. [PubMed] [Google Scholar]
- [4].Wild SH, Roglic G, Green A, Sicree R, King H. Global prevalence of diabetes: Estimates for the year 2000 and projections for 2030. Diabetes Care. 2004;27:2569–2569. doi: 10.2337/diacare.27.5.1047. [DOI] [PubMed] [Google Scholar]
- [5].Henderson MJ, Karger BA, Wrenshall GA. Acetone in the Breath - a Study of Acetone Exhalation in Diabetic and Nondiabetic Human Subjects. Diabetes. 1952;1:188–193. doi: 10.2337/diab.1.3.188. [DOI] [PubMed] [Google Scholar]
- [6].Diskin AM, Spanel P, Smith D. Time variation of ammonia, acetone, isoprene and ethanol in breath: a quantitative SIFT-MS study over 30 days. Physiol. Meas. 2003;24:107–119. doi: 10.1088/0967-3334/24/1/308. [DOI] [PubMed] [Google Scholar]
- [7].Deng CH, Zhang J, Yu XF, Zhang W, Zhang XM. Determination of acetone in human breath by gas chromatography-mass spectrometry and solid-phase microextraction with on-fiber derivatization. J. Chromatogr. B. 2004;810:269–275. doi: 10.1016/j.jchromb.2004.08.013. [DOI] [PubMed] [Google Scholar]
- [8].Sulway MJ, Malins JM. Acetone in Diabetic Ketoacidosis. Lancet. 1970;2:736–740. doi: 10.1016/s0140-6736(70)90218-7. [DOI] [PubMed] [Google Scholar]
- [9].Cao WQ, Duan YX. Current status of methods and techniques for breath analysis. Crit. Rev. Anal. Chem. 2007;37:3–13. doi: 10.1080/10408347.2015.1055550. [DOI] [PubMed] [Google Scholar]
- [10].Sanchez JM, Sacks RD. GC analysis of human breath with a series-coupled column ensemble and a multibed sorption trap. Anal. Chem. 2003;75:2231–2236. doi: 10.1021/ac020725g. [DOI] [PubMed] [Google Scholar]
- [11].Lord H, Yu YF, Segal A, Pawliszyn J. Breath analysis and monitoring by membrane extraction with sorbent interface. Anal. Chem. 2002;74:5650–5657. doi: 10.1021/ac025863k. [DOI] [PubMed] [Google Scholar]
- [12].Phillips M, Herrera J, Krishnan S, Zain M, Greenberg J, Cataneo RN. Variation in volatile organic compounds in the breath of normal humans. J. Chromatogr. B. 1999;729:75–88. doi: 10.1016/s0378-4347(99)00127-9. [DOI] [PubMed] [Google Scholar]
- [13].Tricoli A, Pratsinis SE. Dispersed nanoelectrode devices. Nature Nanotech. 2010;5:54–60. doi: 10.1038/nnano.2009.349. [DOI] [PubMed] [Google Scholar]
- [14].Tricoli A, Righettoni M, Teleki A. Semiconductor Gas Sensors: Dry Synthesis and Application. Angew. Chem. Int. Ed. 2010;49:7632–7659. doi: 10.1002/anie.200903801. [DOI] [PubMed] [Google Scholar]
- [15].Eranna G, Joshi BC, Runthala DP, Gupta RP. Oxide materials for development of integrated gas sensors – A comprehensive review. Crit. Rev. Solid State Mat. Sci. 2004;29:111–188. [Google Scholar]
- [16].Graf M, Gurlo A, Barsan N, Weimar U, Hierlemann A. Microfabricated gas sensor systems with sensitive nanocrystalline metal-oxide films. J. Nanopart. Res. 2006;8:823–839. [Google Scholar]
- [17].Tricoli A, Graf M, Pratsinis SE. Optimal doping for enhanced SnO2 sensitivity and thermal stability. Adv. Funct. Mater. 2008;18:1969–1976. [Google Scholar]
- [18].Kuhhe S, Graf M, Tricoli A, Mayer F, Pratsinis SE, Hierlemann A. Wafer-level flame-spray-pyrolysis deposition of gas-sensitive layers on microsensors. J. Micromech. Microeng. 2008;18:035040. [Google Scholar]
- [19].Graf M, Frey U, Taschini S, Hierlemann A. Micro hot plate-based sensor array system for the detection of environmentally relevant gases. Anal. Chem. 2006;78:6801–6808. doi: 10.1021/ac060467d. [DOI] [PubMed] [Google Scholar]
- [20].Frey U, Graf M, Taschini S, Kirstein KU, Hierlemann A. A digital CMOS architecture for a micro-hotplate array. IEEE J. Solid-State Circuit. 2007;42:441–450. [Google Scholar]
- [21].Graf M, Barrettino D, Kirstein KU, Hierlemann A. CMOS microhotplate sensor system for operating temperatures up to 500 °C, Sens. Actuator B-Chem. 2006;117:346–352. [Google Scholar]
- [22].Tricoli A, Graf M, Mayer F, Kuhne S, Hierlemann A, Pratsinis SE. Micropatterning layers by flame aerosol deposition-annealing. Adv. Mater. 2008;20:3005–3010. [Google Scholar]
- [23].Teleki A, Pratsinis SE, Kalyanasundaram K, Gouma PI. Sensing of organic vapors by flame-made TiO2 nanoparticles, Sens. Actuator B-Chem. 2006;119:683–690. [Google Scholar]
- [24].Tricoli A, Righettoni M, Pratsinis SE. Minimal cross-sensitivity to humidity during ethanol detection by SnO2-TiO2 solid solutions. Nanotechnology. 2009;20:315502. doi: 10.1088/0957-4484/20/31/315502. [DOI] [PubMed] [Google Scholar]
- [25].Wang L, Teleki A, Pratsinis SE, Gouma PI. Ferroelectric WO3 nanoparticles for acetone selective detection. Chem. Mater. 2008;20:4794–4796. [Google Scholar]
- [26].Righettoni M, Tricoli A, Pratsinis SE. Thermally-stable, silica doped ε-WO3 for sensing of acetone in the human breath. Chem. Mater. 2010;22:3152–3157. [Google Scholar]
- [27].Righettoni M, Tricoli A, Pratsinis SE. Si:WO3 Sensors for Highly Selective Detection of Acetone for Easy Diagnosis of Diabetes by Breath Analysis. Anal. Chem. 2010;82:3581–3587. doi: 10.1021/ac902695n. [DOI] [PubMed] [Google Scholar]
- [28].Strobel R, Pratsinis SE. Flame aerosol synthesis of smart nanostructured materials. J. Mater. Chem. 2007;17:4743–4756. [Google Scholar]
- [29].Madler L, Roessler A, Pratsinis SE, Sahm T, Gurlo A, Barsan N, Weimar U. Direct formation of highly porous gas-sensing films by in-situ thermophoretic deposition of flame-made Pt/SnO2 nanoparticles. Sens. Actuator B-Chem. 2006;114:283–295. [Google Scholar]
- [30].Salje E. Structural Phase-Transitions in System WO3-NaWO3. Ferroelectrics. 1976;12:215–217. [Google Scholar]
- [31].Tanisaki S. Crystal Structure of Monoclinic Tungsten Trioxide at Room Temperature. J. Phys. Soc. Jpn. 1960;15:573–581. [Google Scholar]
- [32].Laine RM, Baranwal R, Hinklin T, Treadwell D, Sutorik A, Bickmore C, Waldner K, Neo SS. Making nanosized oxide powders from precursors by flame spray pyrolysis. Novel Synthesis and Processing of Ceramics. 1999;159-1:17–24. [Google Scholar]
- [33].Jossen R, Pratsinis SE, Stark WJ, Madler L. Criteria for flame-spray synthesis of hollow, shell-like, or inhomogeneous oxides. J. Am. Ceram. Soc. 2005;88:1388–1393. [Google Scholar]
- [34].Jossen R, Mueller R, Pratsinis SE, Watson M, Akhtar MK. Morphology and composition of spray-flame-made yttria-stabilized zirconia nanoparticles. Nanotechnology. 2005;16:S609–S617. doi: 10.1088/0957-4484/16/7/039. [DOI] [PubMed] [Google Scholar]
- [35].Madler L, Kammler HK, Mueller R, Pratsinis SE. Controlled synthesis of nanostructured particles by flame spray pyrolysis. J. Aerosol. Sci. 2002;33:369–389. [Google Scholar]
- [36].Barsan N, Weimar U. Understanding the fundamental principles of metal oxide based gas sensors; the example of CO sensing with SnO2 sensors in the presence of humidity. J. Phys.-Condes. Matter. 2003;15:R813–R839. [Google Scholar]
- [37].Lezzi AM, Beretta GP, Comini E, Faglia G, Galli G, Sberveglieri G. Influence of gaseous species transport on the response of solid state gas sensors within enclosures. Sens. Actuator B-Chem. 2001;78:144–150. [Google Scholar]
- [38].Aguir K, Lemire C, Lollman DBB. Electrical properties of reactively sputtered WO3 thin films as ozone gas sensor. Sens. Actuator B-Chem. 2002;84:1–5. [Google Scholar]
- [39].Lee AP, Reedy BJ. Temperature modulation in semiconductor gas sensing. Sens. Actuator B-Chem. 1999;60:35–42. [Google Scholar]
- [40].Barsan N, Schweizer-Berberich M, Gopel W. Fundamental and practical aspects in the design of nanoscaled SnO2 gas sensors: a status report. Fresenius J. Anal. Chem. 1999;365:287–304. [Google Scholar]
- [41].Frank K, Kohler H, Guth U. Influence of the measurement conditions on the sensitivity of SnO2 gas sensors operated thermo-cyclically. Sens. Actuator B-Chem. 2009;141:361–369. [Google Scholar]
- [42].Ryabtsev SV, Shaposhnick AV, Lukin AN, Domashevskaya EP. Application of semiconductor gas sensors for medical diagnostics. Sens. Actuator B-Chem. 1999;59:26–29. [Google Scholar]
- [43].Zhao J, Huo LH, Gao S, Zhao H, Zhao JG. Alcohols and acetone sensing properties of SnO2 thin films deposited by dip-coating. Sens. Actuator B-Chem. 2006;115:460–464. [Google Scholar]
- [44].Kim KW, Cho PS, Kim SJ, Lee JH, Kang CY, Kim JS, Yoon SJ. The selective detection of C2H5OH using SnO2-ZnO thin film gas sensors prepared by combinatorial solution deposition, Sens. Actuator B-Chem. 2007;123:318–324. [Google Scholar]
- [45].Jiang ZW, Guo Z, Sun B, Jia Y, Li MQ, Liu JH. Highly sensitive and selective butanone sensors based on cerium-doped SnO2 thin films, Sens. Actuator B-Chem. 2010;145:667–673. [Google Scholar]
- [46].Al-Hardan NH, Abdullah MJ, Aziz AA, Ahmad H, Low LY. ZnO thin films for VOC sensing applications. Vacuum. 2010;85:101–106. [Google Scholar]


