

Abstract
In both children and adults there is large variability in reading skill, with approximately 5–10% of individuals characterized as having reading disability; these individuals struggle to learn to read despite adequate intelligence and opportunity. Although it is well established that a substantial portion of this variability is attributed to the genetic differences between individuals, specifics of the connections between reading and the genome are not understood. This article presents data that suggest that variation in the COMT gene, which has previously been associated with variation in higher-order cognition, is associated with reading and reading-related skills, both at the level of brain and behavior. In particular, we found that the COMT Val/Met polymorphism at rs4680, which results in the substitution of the ancestral Valine (Val) by Methionine (Met), was associated with better performance on a number of critical reading measures and with patterns of functional neural activation that have been linked to better readers. We argue that this polymorphism, known for its broad effects on cognition, may modulate (likely through frontal lobe function) reading skill.
Introduction
Reading disability (RD) has been characterized as a brain-based difficulty in acquiring fluent reading skills, typically associated with phonological deficits, that affects significant numbers of children (Lyon et al. 2003)1. Evidence from epidemiological population studies suggest that RD symptomatology likely reflects normally-distributed variation in behavior (Jorm et al. 1986; Shaywitz et al. 1992; Stevenson, 1988), and thus might be more accurately viewed as a dimensional, rather than a discrete developmental disorder (Fletcher, 2009). This evidence motivates the study of neural and genetic correlates of reading skill across a broad spectrum of levels rather than limiting our approach to extreme variation in reading skill (e.g., RD).
The acquisition of reading skill is likely to be influenced by multiple genes and gene-environment co-actions. Moreover, the psychological texture of reading skill is complex because it weaves in not only reading-specific processes (e.g., decoding) but also more generic cognitive characteristics of the reader (e.g., working memory). Given the role of COMT in dopamine regulation and the observed associations between COMT and a variety of skills important for reading (e.g., attention, working memory), we have chosen to focus on the variation in this gene and its putative association with reading skill. The COMT gene codes for the Catechol-O-methyltransferase enzyme, which metabolizes released dopamine in the prefrontal cortex and, as such, is a strong regulator of prefrontal dopamine levels. Moreover, multiple loci within the COMT intronic and promoter regions have been found to modify gene expression and function (e.g., Chen et al. 2004). Given the role of the variation in COMT in prefrontal functioning and skill, we suggest that variability in the COMT genotype may modulate skilled reading development; that is, we suggest that variation in the COMT gene may be associated with reading skill acquisition through the connection between reading skills and higher-level cognitive skills, which, in turn, are connected to the activity in the prefrontal cortex.
Variation at codon 158 of the COMT gene (captured as rs4680), results in a valine (Val)-to-methionine (Met) substitution, which has been associated with increased performance on tasks that heavily recruit prefrontal regions and more efficient physiological response in prefrontal cortex (Egan, et al. 2001). Behaviorally, this polymorphism in adults and late adolescents has been associated with memory, executive function, attention, low-level auditory ERP response and reading comprehension (e.g., Chen et al. 2004; Lebedeva et al. 2009; Grigorenko et al. 2007). Extant research on COMT has largely focused on memory and/or executive function in typical and atypical (e.g., schizophrenic patients) individuals because of the role that prefrontal dopamine is thought to play in these functions and illnesses. Despite these positive associations, a recent meta-analysis (Barnett, 2008) of this particular COMT polymorphism yielded mixed results, indicating that there may be little role for this polymorphism in cognitive behavior. However, meta-analytic approaches depend upon the quality and the validity of the individual studies included. In fact, Barnett (2008) concludes that the COMT Val/Met polymorphism remains a viable candidate gene that may contribute to variation in cognitive function and that continued investigation of the relationship between properly characterized complex cognitive phenotypes and the variation in the COMT gene is important.
Although the literature examining the effects of this COMT polymorphism on functional MRI activation is relatively small, and thus far largely limited to studies of adults, multiple studies have found that Val carriers produce greater prefrontal activation than Met carriers despite comparable levels of working memory performance, indicating that cognitive processing may be less efficient in these individuals (e.g., In schizophrenic patients during an N-back task, Egan et al. 2001; In healthy adults in a verbal and spatial memory task, Bishop, 2008; In healthy adults in a word recall task, Schott et al. 2006; In healthy adults during mathematic and temporal transformations that tax working memory, Tan et al. 2007). However, other studies have found greater activity for Met carriers, including a recent study by Stokes et al. (2011) who found reduced activation in the right posterior cingulate cortex for healthy adults with the Val/Val genotype relative to Val/Met and Met/Met genotypes during an N-back task and a go-no-go task (Also see Stokes et al. 2011 and Mier et al. for a summary of Val/Met, Met/Met and Val/Val patterns of activation across reports/tasks). Stokes and colleagues (2011) and Tan and colleagues (2007) suggest that the difference in findings reflects the use of tasks or sub processes within tasks that have differential sensitivity to dopamine levels and/or function. Further another recent meta-analysis of the neural substrates associated with COMT (Mier et al. 2010) found that in general, executive cognition tasks favored Met carriers while emotional processing tasks favored Val carriers, further validating the pleiotropic effects of COMT variation.
Recently, our group established a complex association between variation in the COMT gene across multiple SNPs (using a haplotype analysis) and reading comprehension skill in incarcerated adolescents2 (Grigorenko et al. 2007). This relationship suggests that the action of the COMT gene is related to complex multi-layered tasks such as reading comprehension, which involves low-level skills such as pseudoword decoding, intermediate level skills such as lexical-semantic processing, and high-level skills such as executive functioning that are required for maintaining coherent text representations (Locascio et al. 2010; Landi, 2010). This article presents data from a study that follows up on this work by examining whether variability in COMT is associated with multiple aspects of reading skill (word reading, pseudoword reading, passage comprehension) and reading-related tasks (phonological awareness [PA], spelling and oral language skills) in young children and/or brain activation measured with functional MRI. Given that the COMT gene regulates dopamine in left frontal cortical regions that are altered in RD, particularly in beginning readers (Shaywitz et al. 2002), we hypothesize that variation in this gene may contribute to individual differences in reading skill and its acquisition. Specifically, we suggest that for young readers, learning to read should be viewed as acquiring a new expertise and, as such, prefrontal systems should play an important role. Therefore, we propose that the variation in COMT via its impact on prefrontal systems function will be associated with reading-related behavior indicators, and associated patterns of activation in brain.
Methods
Participants
Eighty-six individuals between the ages of 6 and 10, mean age = 8.28 were enrolled in this study; these participants were split into three groups based on COMT genotype (see group details below). Mean ages and gender for the three groups are as follows: Met/Met, Mean age = 8.35 (11 males, 12 females); Val/Met, mean age = 8.06 (24 males, 18 females); Val/Val, mean age = 8.40 (15 males, 6 females). These individuals participated as part of an ongoing study of individual differences in behavioral, neurobiological and genetic contributions to reading skill. Our participants were selected from the larger sample because they had usable MRI data (see MRI analysis) and usable DNA (see DNA collection and analysis). All participants had normal or corrected-to-normal vision and had normal hearing, assessed by an audiometer to be between −20 and 20 db. No participants had a history of neurobiological insult, psychiatric condition, or developmental disability other than RD (primary), ADHD and/or speech delay (secondary).
Behavioral assessments
Participants were all administered a standard battery of reading and language assessments as well as a screener for ADHD, and educational and neuropsychological history evaluations. Several assessments of reading, language and academic skills were used. Specifically, the three genetic groups (Val/Val, Val/Met, and Met/Met) were compared on several assessments from the Woodcock-Johnson Achievement battery (Woodcock et al. 2001) including: Word reading measures: Word Attack (pseudoword reading, or pseudoword decoding) and Reading Comprehension. Oral Language Measures: the Oral Comprehension and Oral Expression composites. Spelling was measured with the Spelling subtest. We also administered a measure of Phonological Awareness from the Comprehensive test of Phonological Processing (CTOPP, Wagner et al. 1999), which includes measures of elision and blending. Finally, we also measured IQ, in both the Performance and Verbal domains (the latter serves as a measure of expressive vocabulary as well) using the WASI (Psychological Corporation, 1999).
fMRI task
All participants were administered a neuroimaging task that was designed to look at word–level print processing. Specifically, children viewed pictures of common objects and printed words or pseudowords that either matched or did not match the object (e.g., they saw an image of a dress and saw the word ‘dress’ or a similar pseudoword ‘dreak’). Critically pictures came on the screen before the words and remained on the screen for 6 trials; this was done to ensure that picture processing was not part of what was being measured during the trials of interest. Real words were high frequency, 4–5 letter words, pseudowords were also 4–5 letters long. Participants were asked to press one button when the word matched the image and another when the image did not match the word; see Frost et al. 2009, Preston et al. 2010, Preston et al. 2011 for a highly detailed task description. Behavioral accuracy in this task was greater than 80% (M = 84%), which is consistent with performance reported in other analyses with this sample (see Frost et al. 2009). This task has been previously shown to discriminate good from poor readers as well as children with more general language problems (Frost et al. 2009, Preston et al. 2010, Preston et al. 2011).
fMRI data processing and analysis
Twenty axial-oblique anatomic images were acquired, parallel to the intercommissural line based on sagittal localizer images. At these same 20 slice locations, activation images were acquired using single shot, gradient echo, echo-planar acquisitions. High-resolution anatomical images were collected for 3D reconstruction. Images were sinc-interpolated to correct for slice acquisition time, motion- corrected with SPM2 (Friston et al. 1995) and spatially smoothed with a 5.15-mm FWHM Gaussian filter. Images were excluded if they exceeded a tolerance of 2 mm displacement or 2° rotation from the first image in the functional series, or if they exceeded an image-to-image change of 1 mm displacement or 1° rotation. Regression-based estimation was used for the hemodynamic response at each voxel and for each condition, without prior specification of a reference function (Miezin et al. 2000). These parameters estimated the mean response for each condition from −3 to +15 s relative to stimulus onset, and individual activation maps were created to estimate the mean difference between a baseline (0–3 sec before onset) and an activation period (3–8 sec post-onset). Prior to across subjects analysis, participants’ data were transformed to standardized reference space defined by the Montreal Neurological Institute (MNI) by mapping to the high resolution anatomic to the “Colin” brain, using linear and nonlinear registration parameters obtained with BioImage Suite (www.bioimagesuite.org; Papademetris et al. 2003).
The three genotype groups were compared on indicators of behavioral performance and initially across three fMRI conditions (printed words [match and non-match] and pseudowords) in a repeated-measures ANOVA; patterns of activation between the two groups did not differ between word and pseudoword conditions and thus these three conditions were collapsed. Planned contrasts within this ANOVA were used to compare groups for the main effect of print processing conditions (collapsed across words and pseudowords) at each voxel separately. The univariate p-values from this ANOVA then corrected for multiple comparisons using the False Discovery Rate [FDR] correction with q = 0.001, effectively thresholding the univariate p-values at 0.01, corrected for multiple comparisons (Genovese et al. 2002). No cluster threshold was applied in this analysis or for display purposes. We also ran an omnibus ANOVA to examine which regions overlapped for the overall effect of COMT and the individual group comparisons. For the most part regions that showed significant activation differences in the individual group comparisons we also significantly active in the Omnibus ANOVA (Appendix Table 4 and Appendix figure 1).
DNA collection and analysis
DNA was extracted from saliva samples collected using sterile Oragene kits (DNA Genotek) during behavioral testing sessions with participants using DNA Genotek’s protocol. After extraction of DNA from samples we used the Applied Biosystems Inc. (ABI) Taqman protocol for SNP genotyping. Specifically, the Assays-on-Demand™ SNP Genotyping Product containing forward and reverse primers as well as the probe for the SNP of interest was utilized. Taqman polymerase chain reaction (PCR) was used to amplify the region of DNA contained in the genomic region (COMT rs4680) under investigation. PCR was carried out using MJ Research Tetrad Thermocycler on a 384-well plate format. Taqman reactions include 50ng of genomic DNA, 2.5µl of ABI Taqman® Universal PCR Master Mix , 0.2µl of ABI 40X Assays-on-Demand SNP Genotyping Assay Mix (assay ID C__25746809_50), 2.0ul of sterile H2O and 0.5µl of Bovine Serum Albumin (BSA). The call rate for genotype identification was 87% (i.e., 28/209 from the entire study sample failed due to the quality of DNA).
Group details
Participants were genotyped (see details above) and grouped into three genotype groups: Val/ Val (n = 23), Val/Met (n = 42), and Met /Met (n = 21). There were no significant differences in age F (2, 83) = .915, p = .405) or gender (X2 = 2.09, p = .351) between the three COMT groups. With respect to race most all participants were of European Caucasian ancestry with the two African-American participants in the Met/ Met group and one in the Val/Met and only Caucasian participants in the Val/Val group3. With respect to handedness across the groups, the majority of participants were right handed with 27% left handed in the Met/Met group; 11% left handed in the Val/Met group and 9% in Val/Val group (X2 = 5.103, p = .277).
Results
Behavioral
Performance on behavioral assessments was first analyzed using a MANOVA with group as a fixed factor, followed by pair-wise comparisons for each assessment. The MANOVA was significant F(2,75), p=.03. Because of a few missing cells in the phonological awareness and IQ subtests, the group Ns for the MANOVA were Met/Met = 20; Val/ Met = 40; and Val/ Val = 19; findings reported in Table 1 show means and standard deviations for the two groups on each of the behavioral assessments (means are based on the full sample for most assessments, Ns are provided for each test). Table 2 shows statistical results from the MANOVA including F values, p values and effect sizes for the group comparisons and Table 3 shows the pairwise comparisons for each group relative to the other group in order to distinguish which group comparisons are driving the overall group effect. For both Met/Met vs. Val/Val and Val/Met vs. Val/Val we observed significant differences for Phonological Awareness and Spelling, and a marginal effect for Decoding. There were no significant differences between Met/Met and Val/Met groups, though for some of our tasks there was a trend for means to be higher for Met/Met in the reading and reading related tasks. There were no significant differences between any of the groups in Oral Language skills, Passage Comprehension, Performance IQ or Verbal IQ. These findings suggest that Met/Met and Val/Met carriers had superior performance relative to Val/Val carriers on reading related skills (PA, Spelling), and marginally better performance for Decoding but not on more general language skills (Oral Language, Comprehension) or IQ. Note that superior performance for the individuals possessing Met/Met relative to Val/Val is consistent with previous behavioral data as noted above, though none of these studies examined reading or reading related skills; this study is the first to use this approach to investigate reading and language skills and their relationship to COMT.
Table 1.
Means and standard deviations for the two groups on our behavioral assessments
| Test | Group | N | Mean | SD |
|---|---|---|---|---|
| WordAttack | Met/Met | 23 | 110.17 | 13.90 |
| Val/Met | 42 | 110.60 | 13.71 | |
| Val/Val | 21 | 103.71 | 11.93 | |
| PassageComp | Met/Met | 23 | 106.39 | 16.98 |
| Val/Met | 42 | 106.52 | 13.88 | |
| Val/Val | 21 | 100.71 | 13.40 | |
| OralComprehension | Met/Met | 23 | 117.17 | 14.10 |
| Val/Met | 42 | 115.98 | 12.24 | |
| Val/Val | 21 | 116.81 | 11.89 | |
| OralExpression | Met/Met | 23 | 113.52 | 14.38 |
| Val/Met | 42 | 114.41 | 10.61 | |
| Val/Val | 21 | 116.48 | 11.80 | |
| PhonoAwareness | Met/Met | 23 | 114.32 | 17.80 |
| Val/Met | 42 | 108.49 | 13.94 | |
| Val/ Val | 21 | 99.05 | 9.95 | |
| Spelling | Met/Met | 23 | 110.39 | 19.67 |
| Val/Met | 42 | 108.71 | 19.92 | |
| Val/Val | 21 | 96.29 | 16.52 | |
| PIQ | Met/Met | 22 | 104.77 | 14.82 |
| Val/Met | 42 | 110.81 | 17.81 | |
| Val/Val | 21 | 108.81 | 15.19 | |
| VIQ | Met/Met | 22 | 106.77 | 16.32 |
| Val/Met | 42 | 112.29 | 14.84 | |
| Val/Val | 21 | 107.57 | 15.37 | |
Table 2.
F values, p values and effect sizes (r) for the three group comparison (MANOVA) on our behavioral assessments. Significant and marginal effects (based on effect size are bolded).
| Test | F | p | R |
|---|---|---|---|
| WordAttack | 2.070 | 0.133 | 0.412 |
| PassageComp | .994 | .375 | 0.212 |
| OralComprehension | .115 | 0.681 | .067 |
| OralExpression | .386 | .681 | .110 |
| PhonoAwareness | 5.818 | .004 | .859 |
| Spelling | 3.953 | .023 | .694 |
| PIQ | .983 | .379 | .215 |
| VIQ | .848 | .432 | .191 |
Table 3.
pairwise t values from the 3 group comparison (MANOVA) on our behavioral assessments. Significant and marginal effects (based on p value, are bolded).
| Test | Group | p |
|---|---|---|
| WordAttack | Met/Met vs. Val /Met | .999 |
| Met/Met vs. Val/Val | .092 | |
| Val/Met vs. Val/Val | .059 | |
| PassageComp | Met/Met vs. Val /Met | .946 |
| Met/Met vs. Val/Val | .257 | |
| Val/Met vs. Val/Val | .181 | |
| OralComprehension | Met/Met vs. Val /Met | .874 |
| Met/Met vs. Val/Val | .772 | |
| Val/Met vs. Val/Val | .633 | |
| OralExpression | Met/Met vs. Val /Met | .661 |
| Met/Met vs. Val/Val | .383 | |
| Val/Met vs. Val/Val | .573 | |
| PhonoAwareness | Met/Met vs. Val /Met | .141 |
| Met/Met vs. Val/Val | .001 | |
| Val/Met vs. Val/Val | .020 | |
| Spelling | Met/Met vs. Val /Met | .752 |
| Met/Met vs. Val/Val | .014 | |
| Val/Met vs. Val/Val | .014 | |
| PIQ | Met/Met vs. Val /Met | .170 |
| Met/Met vs. Val/Val | .573 | |
| Val/Met vs. Val/Val | .497 | |
| VIQ | Met/Met vs. Val /Met | .206 |
| Met/Met vs. Val/Val | .631 | |
| Val/Met vs. Val/Val | .502 | |
fMRI
Met/Met vs. Val/Val
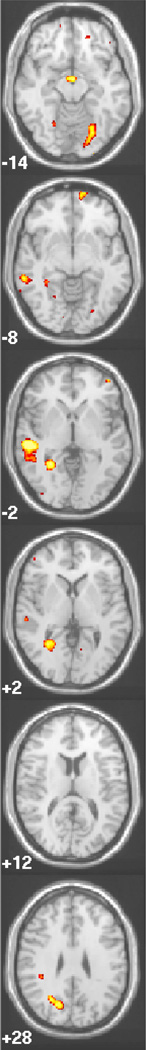
Comparisons of the two homozygous groups revealed many regions of differential brain activation with the Met/Met group showing several regions of greater activation relative to the Val/Val group. Moreover, the pattern of neural activation observed for Met/Met was more consistent with previously identified patterns of neural activity in good readers relative to poor readers (e.g., Landi et al. 2009; Pugh et al. 2000; Pugh et al. 2008). Specifically individuals in the Met/ Met group showed greater activation in a large region covering the left occipitotemporal junction (OT) and fusiform gyrus, sometimes referred to as the visual word for area (VWFA); the left left middle temporal gyrus (MTG). In addition they also showed greater activation in a region of right frontal cortex and right parietal cortex, consistent with the idea that the frontal cortex may be involved in the relationship between COMT and reading (Figure 1; Appendix Table 1).
Figure 1.

Patterns of activation are shown for Met/ Met >Val/Val, Met/Met>Val/Val and Val/Met>Val/Val in response to printed stimuli. Areas in yellow show greater activity for genotype listed first, Areas in purple show greater activity for the genotype listed second Z coordinates are listed in the bottom left corner, and pictures are presented in radiological convention (left, right reversed)
Met/Met vs. Val/Met
Likewise, as shown in Figure 1, the comparison of Met/Met and Val/Met groups indicated several regions of differential brain activation; in this case, with Met/Met carriers showing significantly greater activation relative to individuals with the Val/Met genotype. The areas of greater activation for Met/Met relative to Val/Met overlap with those observed to be more active for Met/Met relative to Val/Val. In particular, high activation in many of these regions is typically observed in skilled readers, including left OT, Left STG and left MTG, (Figure 1; Appendix Table 2).
Val/Met vs. Val/Val
The comparison of Val/Met to Val/Val revealed many fewer regions of differential activation and the pattern of regional activation differences is primarily isolated to the Left precentral gyrus and Right occipital temporal gyrus with additional differences in extrastriate regions. Val/ Val carriers also showed several areas of greater activity relative to Val/Met carriers, including in the parahippocampal gyrus and in several small regions of the frontal cortex and in the cerebellum.
Covariate Analysis
Because COMT regulates dopamine levels and the degree to which these levels are modulated varies by gender, we chose to include gender as a covariate. Similarly, because the COMT Val/Met polymorphism has been associated with ADHD (Gotheff et al. 2006), diagnosis of ADHD was included as a covariate as well. Additionally, because of its known effect on hemispheric laterality, handedness was also included as a covariate. Finally, because of the relatively large age range in our study we also included age. To examine the role that gender, handedness, ADHD and age might play in our behavioral and/or our fMRI findings, we conducted two ANCOVAs, the first on all of our statistically significant behavioral variables, the second on our regions of interest (all regions in which group activations significantly differed). We first conducted the analysis with all covariates at once and if a significant effect for any covariate was identified or if the effect of group became non-significant we ran each covariate separately to determine which covariate was modifying our results. For the behavioral data none of the covariates modified our effects (either entered in combination or independently). For the MRI data, we found small effects in two regions for one of our group comparisons; specifically, for the comparison of Val/Met > Val/Val the inclusion of all of the covariates made the middle occipital effect marginal (p=.07); This was also true for each of the covariates entered on their own (p values for the effect of COMT group ranged from p=.07 – .09) except handedness which did not modify observed effects of interest‥ Thus the middle occipital effect in this contrast may not be robust.
Discussion
We present an initial report on the relationship between a relatively common genetic mutation, the COMT Val/Met polymorphism found at SNP rs4680, and reading and reading related skills. Associations were found between variation in the COMT gene and performance on behavioral measures; specifically, pairwise comparisons of each genotype revealed significantly better performance for Met/Met relative to Val/Val and Val/Met relative to Val/Val on several reading related skills, namely Phonological Awareness and Spelling as well as a marginal effect of better performance on Decoding (Word Attack), but no significant effects or trends for other skills we measured (e.g., comprehension, oral language, IQ). We suggest that these particular skills were more strongly associated with frontal lobe function (relative to the other skills measured) because these skills, which emphasize phonological processing, decoding and orthographic awareness are of particular importance for children in this age range who are just beginning to acquire these skills. Moreover, we also observed strong associations between COMT and patterns of brain activation (BOLD); specifically we found that Met/Met relative to Val/Val and Met/Met relative to Val/Met carriers presented more like better readers (identified in our previous work, e.g., Pugh et al. 2000; Landi et al. 2010). That is, in both cases the Met/Met carriers had greater activation in the OT region and in temporal regions of the left hemisphere. Moreover Met/Met carriers had greater activation in left prefrontal regions, consistent with the role of COMT in modulating prefrontal function. The comparison of Val/Met to Val/Val revealed fewer regions that distinguished the group, and although the Val/Met carriers showed greater activation in some reading related regions, they did not show the same global pattern of “looking like better readers”. This is somewhat in conflict with the behavioral findings, which demonstrated behavioral differences between these groups. Upon further inspection, we observed that at a more liberal activation threshold (p<.05, FDR corrected) many more regions associated with reading including the OT were indeed more strongly activated for the Val/Met relative to the Val/Val group.
It is noteworthy that many previous fMRI studies of COMT Val/Met genotype have often identified greater activation for Val/Val carriers particularly in frontal regions, which has been associated with decreased efficiency (Bertolino et al. 2004; Bishop et al. 2008; Blasi et al. 2005; Caldu et al. 2007; Egan et al. 2001; Kempton et al. 2008; Mattay et al. 2003). In our study the Val/ Val group generally showed reduced activation, particularly in areas of interest for reading, including a left frontal region; however, as discussed above several studies have also found greater activity for Met carriers, in a variety of regions including frontal sites (Drabant et al. 2006; Smolka et al. 2007; Smolka et al. 2005; Stokes et al. 2011). This discrepancy from the literature might be explained by two factors: first, the nature of our task (reading) and second the regions involved. The existing work that has identified greater activation for Val/Val has been focused on executive function (EF), attention and memory; these tasks and their associated patterns of regional activations are quite different from our assessments and in-scanner tasks, which primarily involve word reading. In particular, work on memory and EF routinely identifies increased activation in prefrontal regions as indicating reduced efficiency, however in studies of reading, increased activity in reading and language related areas is associated with superior performance. The second factor may be the age of our participants; the majority of the imaging work investigating COMT variation has been done with adults and not with young children. Although it is difficult to predict how exactly this would affect the data, it is known that tonic and phasic levels of dopamine in the cortex change throughout the aging process. Indeed, Wahlstrom and colleagues (2007) found that superior performance in children and adolescents was associated with the heterozygous Val/Met genotype in contrast to most of the work on adults which has demonstrated superior performance for individuals with the Met/Met genotype (see also Wahlstrom et al. 2010 for a review of this work and related findings). Moreover, two existing studies of effects of COMT genotype on brain in children (though not on reading) indicate that 11–12 year old children with the Met/Met genotype have increased gray matter volume and increased functional activity in the hippocampus during and emotional processing task and (Mechelli et al. 2009) and that children between the ages of 9 and 16 who are Met/Met carriers have greater regional perfusion (measured by arterial spin-labeling) than Val/Val homozygotes in both cortical and sub-cortical regions including (frontal and temporal cortices, insula, caudate, brainstem, lateral cerebellum). Although these tasks and methods are different from those used in the current study, these findings suggest that patterns of activation for Met/Met vs. Val/ Met and Val/Val carriers may differ based on task, regions being explored, and participant age.
With regard to the association between this polymorphism and our behavioral data, we argue that, based on the literature, this polymorphism has broad cognitive effects and may modulate both acquisition and realization of reading skill via its impact on frontal lobe function. More specifically, we believe that the link to frontal lobe function may be via the metacognitive skill of phonological awareness (PA), which is strongly predictive of reading skill in the early grades (see Frost et al. 2009); this hypothesis is supported by our behavioral data, which shows that Met carriers have better PA. An alternative hypothesis is this polymorphism affects reading via fronto-striatal networks; recent work from our lab (Preston et al. 2010 & Pugh et al. in press) implicate the thalamus and putamen as important in reading and related skills (and these regions are apparent in the data presented here as well; Appendix Tables 1–3). In our earlier work, we have further hypothesized that these regions are critical because of the sensori-motor procedural learning that takes place when children acquire phonological awareness and then reading (c.f Ullman & Pierpont, 2005). Specific mechanisms aside, because the Val/Met polymorphism represents a common variant in the population, it may account for a meaningful amount of the variability in reading and other domain specific abilities (again, via domain general mechanisms associated with cognition) in the general population. Thus, we suggest that COMT may be more relevant in the general population and associated distribution of reading skill than any single rare mutation, which can be a powerful causal factor in a single family or a few families, but is unlikely to be generalizable to the general population.
Despite its limitations (i.e., sample size in particular), this study contributes to the growing literature that stresses the importance of considering common genetic variants in understanding the etiology of cognitive differences, especially in samples drawn from the general population. Although such variants might not target a particular cognitive skill or process, because of their critical role in the brain function, they appear to be pleiotropic in their impact, affecting multiple skills or components of these skills. While these findings should be viewed with caution, they contribute to the literature by demonstrating the complexity of the COMT Val/Met polymorphism in its relationship to multiple cognitive skills. To understand this complexity, it is important to carry out multi-level modeling, bringing genetic, brain, and behavior data into vertical structures allowing investigations of the direct and indirect effects of genetic variants on characteristics of brain and behavior functions. Although such modeling cannot be carried out in this work due to sample size limitations, the current results provide evidence for the importance of such multi-level investigations.
Appendix
Table 1.
For all regions showing significant differences between the two groups (Met/Met > Val/Met), Brodman Area (BA), volume in mm3, MNI coordinates at peak, p-value for peak activation and directionality of the observed effect.
| region | BA | vol | X | Y | Z | p-value | direction |
|---|---|---|---|---|---|---|---|
| precuneus | 7 | 12616 | 28 | −54 | 16 | <0.0001 | 1>2 |
| Superior Temporal Gyrus | 21/22 | 6400 | 56 | −28 | −1 | <0.0001 | 1>2 |
| Parahippocampa Gyrus | 19 | 5080 | 28 | −51 | −2 | 0.0002 | 1>2 |
| Middle Occipital Gyrus | 18 | 1496 | −18 | −86 | −15 | 0.001 | 1>2 |
| Parahippocampa Gyrus | 30 | 1048 | −22 | −42 | −6 | 0.0017 | 1>2 |
| Lingual Gyrus | 18 | 952 | −10 | −64 | 2 | 0.0023 | 1>2 |
| Precentral Gyrus | 6 | 944 | −34 | −14 | 44 | 0.0006 | 1>2 |
| Superior Temporal Gyrus | 42 | 664 | 70 | −24 | 10 | 0.0005 | 1>2 |
| Superior Parietal Lobule | 7 | 584 | −44 | −62 | 54 | 0.0002 | 1>2 |
| Insula | 13 | 584 | −42 | −36 | 24 | 0.0028 | 1>2 |
| Superior Frontal Gyrus | 10 | 504 | −10 | 68 | −6 | 0.0007 | 1>2 |
| Culmen | 480 | 24 | −60 | −30 | 0.0011 | 1>2 | |
| Precuneus | 7 | 408 | −20 | −82 | 50 | 0.0018 | 1>2 |
| Middle Frontal Gyrus | 46 | 376 | 52 | 29 | 30 | 0.0008 | 1>2 |
| Postcentral Gyrus | 43 | 368 | 70 | −14 | 20 | 0.0029 | 1>2 |
| Lingual Gyrus | 18 | 328 | 6 | −86 | −6 | 0.0034 | 1>2 |
| Culmen | 296 | 12 | −42 | −24 | 0.0035 | 1>2 | |
| Middle Temporal Gyrus | 20 | 272 | −64 | −46 | −16 | 0.0012 | 1>2 |
| Inferior Frontal Gyrus | 47 | 216 | −42 | 22 | −14 | 0.005 | 1>2 |
| Middle Temporal Gyrus | 21 | 144 | −64 | −30 | 0 | 0.0049 | 1>2 |
| Precentral Gyrus | 6 | 120 | 20 | −16 | 54 | 0.0042 | 1>2 |
| Superior Frontal Gyrus | 10 | 112 | 30 | 62 | −4 | 0.0067 | 1>2 |
| Culmen | 36 | 104 | −12 | −46 | −24 | 0.0064 | 1>2 |
| Angular Gyrus | 39 | 88 | −54 | −62 | 36 | 0.0051 | 1>2 |
| Lentiform Nucleus | 80 | 30 | −16 | −6 | 0.0037 | 1>2 | |
| Inferior Frontal Gyrus | 11 | 1416 | 12 | 36 | −22 | −0.0002 | 2>1 |
| Middle Frontal Gyrus | 11 | 520 | −20 | 44 | −12 | −0.0005 | 2>1 |
| Cuneus | 19 | 296 | 12 | −96 | 24 | −0.0003 | 2>1 |
| Inferior Frontal Gyrus | 10 | 168 | 48 | 48 | 0 | −0.0013 | 2>1 |
| Cuneus | 17 | 88 | 10 | −98 | 0 | −0.0068 | 2>1 |
Met/Met= 1, Val/Val= 2
Table 2.
For all regions showing significant differences between the two groups (Met/Met > Val/Val), Brodman Area (BA), volume in mm3, MNI coordinates at peak, p-value for peak activation and directionality of the observed effect.
| region | BA | vol | X | Y | Z | p-value | direction |
|---|---|---|---|---|---|---|---|
| Fusiform Gyrus | 19 | 2048 | −24 | −70 | −14 | 0.0008 | 1>2 |
| Cerebellar Tonsil | 19 | 1664 | 6 | −56 | −43 | 0.0004 | 1>2 |
| Inferior Parietal Lobule | 40 | 1480 | 40 | −36 | 32 | 0.0001 | 1>2 |
| Medial Frontal Gyrus | 6 | 1040 | 18 | −16 | 54 | 0.0006 | 1>2 |
| Precentral Gyrus | 4 | 992 | −32 | −20 | 46 | 0.0002 | 1>2 |
| Parahippocampa Gyrus | 30 | 480 | 32 | −56 | 2 | 0.0029 | 1>2 |
| Precuneus | 7 | 344 | 16 | −46 | 54 | 0.0023 | 1>2 |
| Inferior Occipital Gyrus | 18 | 328 | 40 | −86 | −3 | 0.0039 | 1>2 |
| Paracentral Lobule | 6 | 320 | −6 | −30 | 54 | 0.0044 | 1>2 |
| Middle Temporal Gyrus | 37 | 312 | 64 | −58 | −6 | 0.0008 | 1>2 |
| Superior Temporal Gyrus | 22 | 288 | 30 | −54 | 16 | 0.0011 | 1>2 |
| Inferior Frontal Gyrus | 47 | 280 | −46 | 38 | −15 | 0.0029 | 1>2 |
| Middle Frontal Gyrus | 10 | 280 | −44 | 54 | −2 | 0.0006 | 1>2 |
| Fusiform Gyrus | 37 | 248 | 38 | −52 | −20 | 0.0047 | 1>2 |
| Inferior Occipital Gyrus | 18 | 208 | −38 | −88 | −16 | 0.0034 | 1>2 |
| Precuneus | 7 | 208 | 24 | −60 | 56 | 0.0041 | 1>2 |
| Superior Temporal Gyrus | 160 | 56 | −28 | −1 | 0.0048 | 1>2 | |
| Declive | 18 | 144 | 4 | −64 | −30 | 0.0045 | 1>2 |
| Precuneus | 7 | 136 | −20 | −70 | 40 | 0.0046 | 1>2 |
| Fusiform Gyrus | 37 | 136 | 36 | −40 | −9 | 0.0048 | 1>2 |
| Inferior Frontal Gyrus | 47 | 120 | 52 | 22 | −8 | 0.0036 | 1>2 |
| Inferior Frontal Gyrus | 45 | 112 | 58 | 20 | 10 | 0.0041 | 1>2 |
| Superior Frontal Gyrus | 8 | 96 | 8 | 50 | 44 | 0.0055 | 1>2 |
| Superior Temporal Gyrus | 38 | 88 | −24 | 22 | −34 | 0.0017 | 1>2 |
| Fusiform Gyrus | 19 | 80 | 24 | −62 | −12 | 0.0059 | 1>2 |
| Inferior Frontal Gyrus | 47 | 520 | −34 | 14 | −19 | −0.0001 | 2>1 |
| Uncus | 512 | 2 | −8 | −40 | −0.0004 | 2>1 | |
| Inferior Frontal Gyrus | 47 | 376 | 20 | 10 | −22 | −0.0017 | 2>1 |
| Uncus | 288 | −4 | −8 | −20 | −0.0031 | 2>1 | |
| Inferior Frontal Gyrus | 11 | 264 | 20 | 38 | −24 | −0.001 | 2>1 |
| Caudate | 240 | −22 | −32 | 24 | −0.0025 | 2>1 | |
| Caudate | 104 | 24 | −36 | 22 | −0.004 | 2>1 |
Met/Met= 1, Val/Val= 2
Table 3.
For all regions showing significant differences between the two groups (Val/Met> Val/Val), Brodman Area (BA), volume in mm3, MNI coordinates at peak, p-value for peak activation and directionality of the observed effect.
| region | BA | vol | X | Y | Z | p-value | direction |
|---|---|---|---|---|---|---|---|
| Precentral Gyrus | 6 | 1104 | −32 | −16 | 64 | 0.001 | 1>2 |
| Fusiform Gyrus | 19 | 272 | 10 | −58 | −44 | 0.003 | 1>2 |
| Middle Occipital Gyrus | 18 | 256 | 40 | −88 | 0 | 0.0023 | 1>2 |
| Uncus | 1544 | −2 | −10 | −18 | <0.0001 | 1>2 | |
| Inferior Frontal Gyrus | 47 | 704 | 20 | 12 | −24 | −0.0003 | 2>1 |
| Uncus | 384 | −4 | −12 | −36 | −0.0028 | 2>1 | |
| Insula | 13 | 352 | −32 | −38 | 18 | −0.0013 | 2>1 |
| Insula | 13 | 192 | 34 | −8 | 24 | −0.0039 | 2>1 |
| Inferior Frontal Gyrus | 47 | 168 | −34 | 16 | −18 | −0.0026 | 2>1 |
| Superior Frontal Gyrus | 10 | 152 | −10 | 60 | −6 | −0.0025 | 2>1 |
| Parahippocampal Gyrus | 30 | 144 | −8 | −34 | −8 | −0.0053 | 2>1 |
| Superior Frontal Gyrus | 11 | 136 | 16 | 58 | −15 | −0.0022 | 2>1 |
| Thalamus | 96 | −12 | −28 | 20 | −0.0072 | 2>1 |
Val/Met = 1, Val/Val= 2
Table 4.
For all regions showing significant differences between among the groups (omnibus ANOVA), Brodman Area (BA), volume in mm3, MNI coordinates at peak, and the p-value for peak activation.
| region | BA | vol | X | Y | Z | p-value |
|---|---|---|---|---|---|---|
| Superior Temporal Gyrus | 3240 | 56 | −28 | −1 | 0.0001 | |
| Parahippocampa Gyrus | 19 | 1800 | 32 | −50 | −4 | 0.0006 |
| Precuneus | 7 | 1448 | 22 | −56 | 54 | 0.0015 |
| Precuneus | 7 | 1352 | 18 | −70 | 30 | 0.0005 |
| Lingual Gyrus | 18 | 1200 | −24 | −74 | −14 | 0.002 |
| Uncus | 1016 | −2 | −10 | −18 | 0.0002 | |
| Culmen | 832 | 28 | −54 | 16 | 0.0001 | |
| Declive | 808 | 6 | −56 | −43 | 0.0012 | |
| Precentral Gyrus | 4 | 680 | −32 | −18 | 46 | 0.0005 |
| Inferior Frontal Gyrus | 11 | 648 | 12 | 36 | −22 | 0.0011 |
| Inferior Parietal Lobule | 40 | 632 | 40 | −36 | 32 | 0.0005 |
| Precuneus | 7 | 544 | −20 | −70 | 40 | 0.0017 |
| Uncus | 34 | 488 | 20 | 10 | −24 | 0.001 |
| Fusiform Gyrus | 19 | 416 | 24 | −62 | −12 | 0.0013 |
| Superior Frontal Gyrus | 10 | 384 | −10 | 66 | −6 | 0.0007 |
| Insula | 13 | 320 | −34 | −38 | 18 | 0.0016 |
| Inferior Frontal Gyrus | 47 | 312 | −34 | 14 | −19 | 0.0004 |
| Superior Parietal Lobule | 7 | 304 | −44 | −62 | 54 | 0.0005 |
| Uncus | 296 | 2 | −8 | −40 | 0.0016 | |
| Precentral Gyrus | 6 | 256 | −32 | −16 | 64 | 0.0041 |
| Precentral Gyrus | 6 | 240 | 20 | −16 | 54 | 0.0017 |
| Middle Frontal Gyrus | 11 | 200 | −20 | 44 | −12 | 0.0019 |
| Superior Temporal Gyrus | 42 | 168 | 70 | −24 | 10 | 0.0021 |
| Declive | 136 | 24 | −60 | −30 | 0.0046 | |
| Middle Temporal Gyrus | 37 | 112 | 64 | −58 | −6 | 0.0024 |
| Cuneus | 19 | 104 | 12 | −96 | 24 | 0.0014 |
| Insula | 13 | 104 | −42 | −34 | 24 | 0.0062 |
| Middle Frontal Gyrus | 46 | 88 | 52 | 29 | 30 | 0.0033 |
Appendix Figure 1.
Omnibus ANOVA: overall effect of COMT
Footnotes
This prevalence depends, in part, on definitional criteria applied (i.e., discrepancy--poor reading, usually bottom 25%, and “normal” or above normal IQ; achievement--poor reading despite IQ; or Response to Intervention--poor reading despite adequate pedagogical treatment), thus prevalence estimates can vary from 5–20%.
Note that this finding was obtained in the context of studying reading comprehension performance and self reported characteristics of maternal upbringing; this was not a case-control study of reading comprehension.
Behavioral assessments and fMRI analyses were run with and without the two African American participants in the Met carrier groups and the pattern of significant findings remained the same.
References
- Barnett JH, Scoriels L, Munafò MR. Meta-analysis of the cognitive effects of the catechol-O-methyltransferase gene Val158/108Met polymorphism. Biological Psychiatry. 2008;64:137–144. doi: 10.1016/j.biopsych.2008.01.005. [DOI] [PubMed] [Google Scholar]
- Bertolino A, Rubino V, Sambataro F, Blasi G, Latorre V, Fazio L, et al. Prefrontal-hippocampal coupling during memory processing is modulated by COMT val158met genotype. Biological Psychiatry. 2006b;60:1250–1258. doi: 10.1016/j.biopsych.2006.03.078. [DOI] [PubMed] [Google Scholar]
- Bishop SJ, Fossella J, Croucher CJ, Duncan J. COMT val158met genotype affects recruitment of neural mechanism supporting fluid intelligence. Cerebral Cortex. 2008;18:2132–2140. doi: 10.1093/cercor/bhm240. [DOI] [PMC free article] [PubMed] [Google Scholar]
- Breitenstein C, Jansen A, Deppe M, et al. Hippocampus activity differentiates good from poor learners of a novel lexicon. NeuroImage. 2005;25:958–968. doi: 10.1016/j.neuroimage.2004.12.019. [DOI] [PubMed] [Google Scholar]
- Blasi G, Mattay VS, Bertolino A, Elvevag B, Callicott JH, Das S, et al. Effect of catechol- O-methyltransferase val158metgenotype on attentional control. Journal of Neuroscience. 2005;25:5038–5045. doi: 10.1523/JNEUROSCI.0476-05.2005. [DOI] [PMC free article] [PubMed] [Google Scholar]
- Caldu X, Vendrell P, Bartres-Faz D, Clemente I, Bargallo N, Jurado MA, et al. Impact of the COMT Val108/158 Met and DAT genotypes on prefrontal function in healthy subjects. NeuroImage. 2007;37:1437–1444. doi: 10.1016/j.neuroimage.2007.06.021. [DOI] [PubMed] [Google Scholar]
- Chen J, Lipska B, Halim N, Quang DM, Matsumoto M, Melhem S, Kolachana BS, Hyde TM, Herman M, Apud J, Egan M, Kleinman JE, Weinberger DR. Functional analysis of genetic variation in catechol-omethyltransferase (COMT): Effects of mRNA, protein, and enzyme activity in postmortem human brain. American Journal of Human Genetics. 2004;75:807–821. doi: 10.1086/425589. [DOI] [PMC free article] [PubMed] [Google Scholar]
- Davis MH, Di Betta AM, Macdonald MJE, Gaskell MG. Learning and consolidation of novel spoken words. Journal of Cognitive Neuroscience. 2008;21:803–820. doi: 10.1162/jocn.2009.21059. [DOI] [PMC free article] [PubMed] [Google Scholar]
- Drabant EM, Hariri AR, Meyer-Lindenberg A, Munoz KE, Mattay VS, Kolachana BS, Egan MF, Weinberger DR. Catechol O-methyltransferase ValÂ1-sup-5-sup-8Met genotype and neural mechanisms related to affective arousal and regulation. Archives of General Psychiatry. 2006;63:1396–1406. doi: 10.1001/archpsyc.63.12.1396. [DOI] [PubMed] [Google Scholar]
- Egan MF, Goldberg TE, Kolachana BS, Callicott JH, Mazzanti CM, Straub RE, et al. Effect of COMT Val108/158 Met genotype on frontal lobe function and risk for schizophrenia. Proceedings of the National Academy of the Sciences. 2001;98:6917–6922. doi: 10.1073/pnas.111134598. [DOI] [PMC free article] [PubMed] [Google Scholar]
- Fletcher J. Dyslexia: The evolution of a scientific concept. Journal of the International Neuropsychological Society. 2009;15:501–508. doi: 10.1017/S1355617709090900. [DOI] [PMC free article] [PubMed] [Google Scholar]
- Friston KJ, Ashburner J, Frith CD, Poline J-B, Heather JD, Frackowiak RSJ. Spatial registration and normalization of images. Human Brain Mapping. 1995;2:165–189. [Google Scholar]
- Frost SJ, Landi N, Mencl WE, Sandak R, Fulbright RK, Tejada ET, Jacobsen L, Grigorenko EL, Constable RT, Pugh KR. Phonological awareness predicts activation patterns for print and speech. Annals of Dyslexia. 2009;59:78–97. doi: 10.1007/s11881-009-0024-y. [DOI] [PMC free article] [PubMed] [Google Scholar]
- Genovese CR, Lazar NA, Nichols T. Thresholding of statistical maps in functional neuroimaging using the false discovery rate. Neuroimage. 2002;15:870–878. doi: 10.1006/nimg.2001.1037. [DOI] [PubMed] [Google Scholar]
- Grigorenko EL, Deyoung CG, Getchell M, Haeffel GJ, Klinteberg BAF, Koposov RA, Oreland L, Pakstis AJ, Ruchkin VV, Yrigollen CM. Exploring interactive effects of genes and environments in etiology of individual differences in reading comprehension. Developmental Psychopathology. 2007;19:1089–1103. doi: 10.1017/S0954579407000557. [DOI] [PubMed] [Google Scholar]
- Jorm AF, Share DL, Maclean R, Matthews R. Cognitive factors at school entry predictive of specific reading retardation and general reading backwardness: A research note. Journal of Child Psychology and Psychiatry. 1986;27:45–54. doi: 10.1111/j.1469-7610.1986.tb00620.x. [DOI] [PubMed] [Google Scholar]
- Kempton MJ, Haldane M, Jogia J, Christodoulou T, Powell J, Collier D, Williams SC, Frangou S. The effects of gender and COMT Val158Met polymorphism on fearful facial affect recognition: a fMRI study. International Journal Neuropsychopharmacol. 2008:1–11. doi: 10.1017/S1461145708009395. [DOI] [PubMed] [Google Scholar]
- Landi N. An examination of the relationship between reading comprehension, higher-level and lower-level reading sub-skills in adults. Reading and Writing. 2010;23:701–717. doi: 10.1007/s11145-009-9180-z. [DOI] [PMC free article] [PubMed] [Google Scholar]
- Lebedeva LS, Korovaitseva GI, Lezheiko TV, Kaleda VG, Abramova LI, Barkhatova AN, Golimbet VE. Influence of genetic variants modulating dopamine activity on brain processing of auditory information (the P300 paradigm) Human Physiology. 2009;35:21–24. [PubMed] [Google Scholar]
- Locascio G, Mahone EM, Eason SH, Cutting LE. Executive dysfunction among children with reading comprehension deficits. Journal of Learning Disabilities. 2010;43:441–454. doi: 10.1177/0022219409355476. [DOI] [PMC free article] [PubMed] [Google Scholar]
- Lyon G, Shaywitz S, Shaywitz B. A definition of dyslexia. Annals of Dyslexia. 2003;53:1–14. [Google Scholar]
- Mattay VS, Goldberg TE, Fera F, Hariri AR, Tessitore A, Egan MF, Kolachana B, Callicott JH, Weinberger DR. Catechol O-methyltransferase val158-met genotype and individual variation in the brain response to amphetamine. Proceedings of the National academy of the Sciences. 2003;100:6186–6191. doi: 10.1073/pnas.0931309100. Acad. Sci. U. S. A. 100, 6186–6191. [DOI] [PMC free article] [PubMed] [Google Scholar]
- Mechelli A, Tognin S, McGuire PK, Prata D, Sartori G, Fusar-Poli P, De Brito S, Hariri AR, Viding E. Genetic vulnerability to affective psychopathology in childhood: a combined voxel-based morphometry and functional magnetic resonance imaging study. Biological Psychiatry. 2009;66:231–237. doi: 10.1016/j.biopsych.2009.01.033. [DOI] [PubMed] [Google Scholar]
- Mier D, Kirsh P, Mayer- Lindenberg A. Neural Substrates of Pleiotropic action of genetic variation in COMT: a meta-analysis. Molecular Psychiatry. 2010;15:918–927. doi: 10.1038/mp.2009.36. [DOI] [PubMed] [Google Scholar]
- Miezin FM, Maccotta L, Ollinger JM, Petersen SE, Buckner RL. Characterizing the haemodynamic response: Effects of presentation rate, sampling procedure, and the possibility of ordering brain activity based on relative timing. Neuroimage. 2000;11:735–759. doi: 10.1006/nimg.2000.0568. [DOI] [PubMed] [Google Scholar]
- Papademetris X, Jackowski A, Schultz RT, Staib LH, Duncan JS. Computing 3D non-rigid brain registration using extended robust point matching for composite multisubject fMRI analysis. Medical Image Computing and Computer Aided Intervention. 2003:788–795. [Google Scholar]
- Plomin R, Kovas Y. Generalist genes and learning disabilities. Psychological Bulletin. 2005;131:592–617. doi: 10.1037/0033-2909.131.4.592. [DOI] [PubMed] [Google Scholar]
- Pugh KR, Frost SJ, Sandak R, Landi N, Rueckl JG, Constable RT, Seidenberg MS, Fulbright RK, Katz L, Mencl WE. Effects of stimulus difficulty and repetition on printed word identification: An fMRI comparison of nonimpaired and reading-disabled adolescent cohorts. Journal of Cognitive Neuroscience. 2008;20:1146–1160. doi: 10.1162/jocn.2008.20079. [DOI] [PMC free article] [PubMed] [Google Scholar]
- Pugh KR, Landi N, Preston JL, Mencl WE, Austin A, Sibley D, Fulbright RK, Seidenberg MS, Grigorenko E, Constable RT, Molfese P, Frost SJ. The relationship between phonological and sensorimotor processing skills and the neurocircuitry for reading in emergent readers. Brain and Language. in press doi: 10.1016/j.bandl.2012.04.004. [DOI] [PMC free article] [PubMed] [Google Scholar]
- Preston JL, Frost S, Mencl WE, Fulbright RK, Landi N, Grigorenko E, Jacobsen L, Pugh KR. Early and late talkers: School-age language, literacy and neurolinguistic differences. Brain. 2010;133:2185–2195. doi: 10.1093/brain/awq163. [DOI] [PMC free article] [PubMed] [Google Scholar]
- Schott BH, Seidenbecher CI, Fenker DB, Lauer CJ, Bunzeck N, Bernstein HG, et al. The dopaminergic midbrain participates in human episodic memory formation: evidence from genetic imaging. Journal of Neuroscience. 2006;26:1407–1417. doi: 10.1523/JNEUROSCI.3463-05.2006. [DOI] [PMC free article] [PubMed] [Google Scholar]
- Shaywitz SE, Escobar MD, Shaywitz BA, Fletcher JM, Makuch RW. Evidence that dyslexia may represent the lower tail of a normal distribution of reading ability. New England Journal of Medicine. 1992;326:145–150. doi: 10.1056/NEJM199201163260301. [DOI] [PubMed] [Google Scholar]
- Shaywitz BA, Shaywitz SE, Pugh KR, Mencl WE, Fulbright RK, Skudlarski P, Constable RT, Marchione KE, Fletcher JM, Lyon GR, Gore JC. Disruption of posterior brain systems for reading in children with developmental dyslexia. Biological Psychiatry. 2002;52:101–110. doi: 10.1016/s0006-3223(02)01365-3. [DOI] [PubMed] [Google Scholar]
- Smolka MN, Schumann G, Wrase J, Grusser SM, Flor H, Mann K, et al. Catechol-O-methyltransferase val158met genotype affects processing of emotional stimuli in the amygdala and prefrontal cortex. Journal of Neuroscience. 2005;25:836–842. doi: 10.1523/JNEUROSCI.1792-04.2005. [DOI] [PMC free article] [PubMed] [Google Scholar]
- Smolka MN, Buhler M, Schumann G, Klein S, Hu XZ, Moayer M, Zimmer A, Wrase J, Flor H, Mann K, Braus DF, Goldman D, Heinz A. Gene–gene effects on central processing of adverse stimuli. Molecular Psychiatry. 2007;12:307–317. doi: 10.1038/sj.mp.4001946. [DOI] [PubMed] [Google Scholar]
- Stevenson J. Which aspects of reading disability show a “hump” in their distribution? Applied Cognitive Psychology. 1988;2:77–85. [Google Scholar]
- Stokes PR, Rhodes RA, Grasby PM, Mehta MA. The effects of the COMT val (108/158)met polymorphism on BOLD activation during working memory, planning, and response inhibition: a role for the posterior cingulate cortex? Neuropsychopharmacology. 2011;36:763–71. doi: 10.1038/npp.2010.210. [DOI] [PMC free article] [PubMed] [Google Scholar]
- Tan HY, Chen Q, Goldberg TE, Mattay VS, Meyer-Lindenberg A, Weinberger DR, Callicot JH. Catechol-O-methyltransferase Val158Met modulation of prefrontal-parietal-striatal brain systems during arithmetic and temporal transformations in working memory. Journal of Neuroscience. 2007;27:13393–13401. doi: 10.1523/JNEUROSCI.4041-07.2007. [DOI] [PMC free article] [PubMed] [Google Scholar]
- The Psychological Corporation. Wechsler Abbreviated Scale of Intelligence. San Antonio: Harcourt Brace & Co; 1999. [Google Scholar]
- Ullman MT, Pierpont EI. Specific language impairment is not specific to language: The procedural deficit hypothesis. Cortex. 2005;41:399–433. doi: 10.1016/s0010-9452(08)70276-4. [DOI] [PubMed] [Google Scholar]
- Wagner RK, Torgesen JK, Rashotte CA. Comprehensive Test of Phonological Processing. Austin, TX: Pro-Ed; 1999. [Google Scholar]
- Wahlstron D, White T, Luciana M. Neurobehavioral evidence for changes in dopamine system activity during adolescence. Neuroscience Biobehavioral Reviews. 2010;34:631–648. doi: 10.1016/j.neubiorev.2009.12.007. [DOI] [PMC free article] [PubMed] [Google Scholar]
- Wahlstrom D, White T, Hooper CJ, Vrshek-Schallhorn S, Oetting WS, Brott MJ, Luciana M. Association of the Catechol-O-methyltransferase (COMT) gene to prefrontally-mediated cognitions in adolescents. Biological Psychiatry. 2007;61(5):626–632. doi: 10.1016/j.biopsych.2006.05.045. [DOI] [PubMed] [Google Scholar]
- Woodcock RW, McGrew KS, Mather N. Woodcock-Johnson III NU tests of achievement. Rolling Meadows, IL: Riverside Publishing; 2001. [Google Scholar]