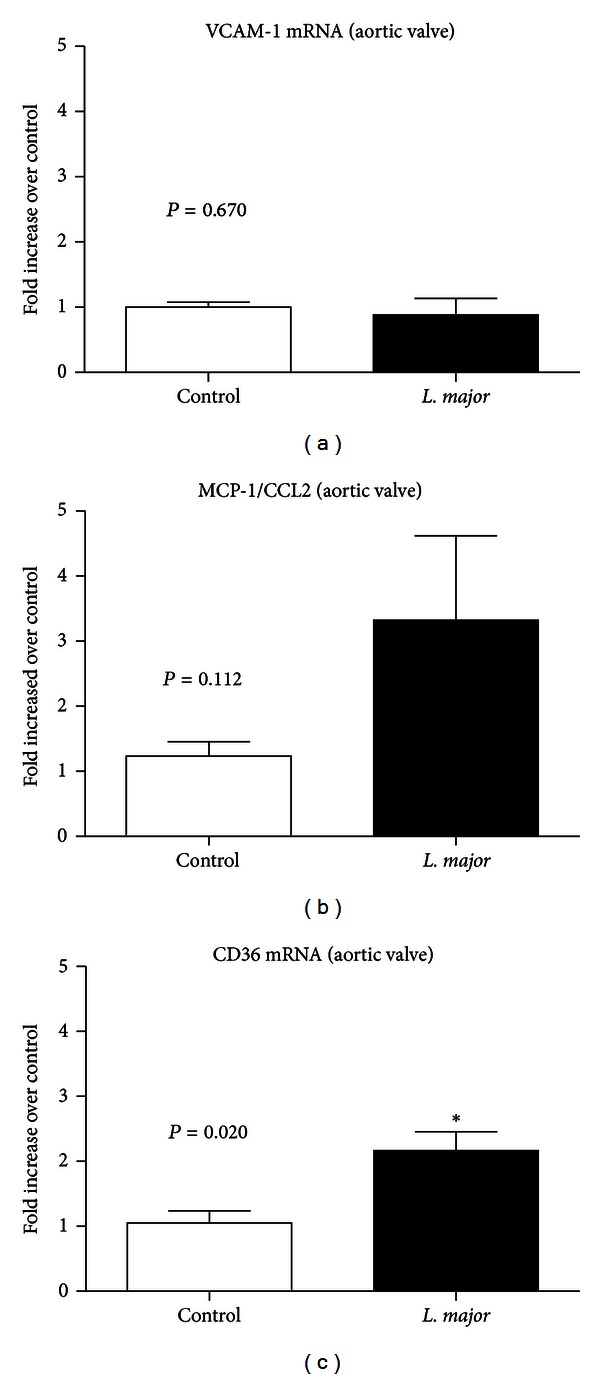
Figure 4.

Relative increase of (a) VCAM-1, (b) MCP1/CCL2, and (c) CD36RNA expression in the aortic valve of non-infected and infected apoE KO mice, 6 weeks after infection. Bars = average and vertical lines = standard error, n = 4/group. *P < 0.05. The values of apoE KO control and L. major groups were, respectively, VCAM = 1.01 ± 0.07 and 0.89 ± 0.21; CD36 = 1.05 ± 0.19 and 2.16 ± 0.20; MCP-1 = 1.22 ± 0.22 and 2.75 ± 0.83.
