

Abstract
Cajal-Retzius cells are a class of neurons believed to play critical roles during cortical development. However, their network computational functions remain poorly understood. Although work in the neocortex and hippocampus has shown that Cajal-Retzius cells receive predominantly, if not exclusively, spontaneous GABAA receptor-mediated input, the cellular sources originating these events remain unclear. However, a precise definition of the presynaptic GABAergic interneurons contacting Cajal-Retzius cells is important to understand the microcircuits and network patterns controlling their activation. Here, we have taken advantage of electrophysiological and anatomical techniques applied to mouse hippocampal slices in vitro to directly address this question. Our paired recording experiments indicate that Cajal-Retzius cells receive small-amplitude, kinetically slow synaptic input from stratum lacunosum-moleculare interneurons, anatomically identified as neurogliaform cells. In addition, a convergence of optogenetic, electrophysiological, and pharmacological experiments shows that Cajal-Retzius cells receive GABAergic input from oriens lacunosum-moleculare cells and that this input has different physiological properties (i.e., larger amplitude and faster kinetics) from the one provided by neurogliaform cells. Last, we show that GABAergic evoked synaptic input onto Cajal-Retzius cells may either increase their excitability and trigger action potentials or inhibit spontaneous firing by depolarization block. We propose that the specific type of response depends on both the membrane potential of Cajal-Retzius cells and the kinetics of the received GABAergic input. In conclusion, we have unraveled a novel hippocampal microcircuit with complex GABAergic synaptic signaling, which we suggest may play a role in the refinement of the hippocampal network and connections during development.
Introduction
Cajal-Retzius cells are a major cellular source of reelin and play critical roles in directing cellular migration and cortical layer formation during brain development (Soriano and Del Río, 2005). However, their precise position within neocortical or hippocampal circuits are poorly understood, and their computational functions remain obscure.
Work in the neocortex and hippocampus has concurred that most, if not all, spontaneous synaptic input received by Cajal-Retzius cells in vitro is GABAergic. In fact, GABAA receptor antagonists completely silence spontaneous events recorded on these cells (neocortex: Kilb and Luhmann, 2001; Soda et al., 2003; Cosgrove and Maccaferri, 2012; hippocampus: Marchionni et al., 2010). In addition, the functional significance of GABAergic input is further highlighted by the fact that both exogenous application (neocortex: Mienville, 1998; Achilles et al., 2007; hippocampus: Marchionni et al., 2010) and synaptic release (neocortex: Cosgrove and Maccaferri, 2012) of GABA to Cajal-Retzius cells generate depolarizing responses, pointing to a critical role in controlling their recruitment. In fact, GABAA receptor-mediated currents have a reversal potential depolarized to the resting voltage. This scenario is attributable to maintained elevated intracellular chloride levels (Mienville, 1998; Achilles et al., 2007), via the NKCC1 transporter (and lack of the KCC2 transporter; Pozas et al., 2008).
The identity of the presynaptic cells releasing GABA onto Cajal-Retzius cells is still unclear. Work in the neocortex has suggested the existence of at least two separate inputs based on their selective physiological and pharmacological properties (Kirmse et al., 2007). However, paired recordings between layer I interneurons and Cajal-Retzius cells failed to reveal unitary events, thus suggesting the lack (or a very low degree) of connectivity between these cell types (Soda et al., 2003). In contrast, application of the group I mGluR agonist (RS)-3,5-dihydroxyphenylglycine (DHPG) in neocortical slices was shown to increase massively the frequency of spontaneous GABAergic postsynaptic currents by activating a network of interneurons located in the lower layers (Cosgrove and Maccaferri 2012). Based on correlative evidence, these neurons were suggested by Cosgrove and Maccaferri (2012) to be somatostatin (Sst)-expressing Martinotti cells. Additionally, field stimulation of the subplate in the presence of glutamate receptor antagonists triggers GABAergic events, indicating the presence of subplate → Cajal-Retzius cell synapses (Myakhar et al., 2011).
Although the layered structure of the hippocampus presents experimental advantages to address this type of connectivity questions, no data are currently available. Cajal-Retzius cells of the CA1 hippocampus are mostly located in stratum lacunosum-moleculare, which receives layer-specific GABAergic input from several types of interneurons (Klausberger and Somogyi, 2008). Both neurogliaform (for review, see Armstrong et al., 2012) and oriens lacunosum-moleculare (O-LM) (Maccaferri et al., 2000; Maccaferri, 2005) cells provide a very dense innervation of this layer and have been proposed to generate critical feedforward and feedback inputs regulating stratum lacunosum-moleculare integrative processes (Elfant et al., 2008; for review, see Capogna, 2011; Maccaferri, 2011).
Here, we provide novel evidence that GABAergic input to hippocampal Cajal-Retzius cells is provided by neurogliaform and O-LM interneurons. Our results also suggest that this output may functionally impact Cajal-Retzius cell excitability in a cell-type-specific manner.
Materials and Methods
Animals.
For most of our experiments, we used slices obtained from CXCR4–EGFP mice. These animals contain a transgene with the coding sequence of EGFP, with a polyadenylation signal, inserted into the RP23–9A20 mouse genomic bacterial artificial chromosome at the ATG transcription initiation codon of the CXCR4 receptor gene, so that expression of the reporter mRNA/protein is driven by the regulatory sequences of the mouse gene (www.gensat.org). We took advantage of this mouse line because Cajal-Retzius cells express CXCR4 (Stumm et al., 2002, 2003). Therefore, EGFP labeling facilitates the identification of Cajal-Retzius cells in slices prepared from these mice (Marchionni et al., 2010, 2012; Cosgrove and Maccaferri, 2012).
To optogenetically activate O-LM cells, which express Sst (Maccaferri et al., 2000), we took advantage of Sst–IRES–Cre mice (strain STOCK Ssttm2.1(cre)Zjh/J, stock number 013044; The Jackson Laboratory; Taniguchi et al., 2011) because, in these animals, Cre recombinase expression is driven by the endogenous promoter/enhancer elements of the Sst locus. These mice were bred with a strain that conditionally expresses an improved channelrhodopsin-2/EYFP fusion protein [ChR2(H134R)–EYFP] after Cre-mediated removal of the floxed STOP cassette [strain B6;129S-Gt(ROSA)26Sortm32(CAG-COP4*H134R/EYFP)Hze/J, stock number 012569; The Jackson Laboratory; Madisen et al., 2012]. Slices obtained from the resulting litters [Sst–IRES–Cre; ChR2(H134R)–EYFP mice] were used for the experiments requiring light activation of O-LM cells.
Mice of either sex were used. The age of the animals was in the range of postnatal days P10–P19 [CXCR4–EGFP mice: P10, n = 2; P11, n = 7; P12, n = 11; P13, n = 13; P14, n = 14; P15, n = 7; P16, n = 1; P19, n = 1; Sst–IRES–Cre; ChR2(H134R)–EYFP mice: P14, n = 3; P15, n = 3; P18, n = 1; P19, n = 1]. Within our datasets, we did not find any significant correlation between the postnatal age of the animals used to prepare slices and the measured amplitude/kinetics of synaptic events (spontaneous, evoked, or unitary). Similarly, both inhibitory and excitatory responses to stratum radiatum stimulation and the membrane potential dependency of our conductance-clamp results were not dependent on the age of the mice used to prepare slices. Therefore, we pooled data from animals of all the postnatal ages in our range. The number of animals used and their average ± SE postnatal days is indicated for every experimental dataset in Results. The postnatal age of the mice associated with specific traces shown in the illustrations is mentioned in the legends.
Slice preparation.
Mice were deeply anesthetized using isoflurane in compliance with the guidelines provided by the Institutional Animal Care and Use Committee of Northwestern University and the National Institutes of Health. After deep anesthesia, animals were quickly decapitated, and the brain was removed from the skull in a small container filled with chilled solution of the following composition (in mm): 130 NaCl, 24 NaHCO3, 3.5 KCl, 1.25 NaH2PO4, 1 CaCl2, 2 MgCl2, and 10 glucose (saturated with 95% O2, 5% CO2 at pH 7.4). A vibrating microtome (Leica VT 1000 S) was used to cut sections of 350 μm in chilled solution. Slices were then stored in an incubation chamber at 34–35°C for at least 30 min and then stored at room temperature until use.
Electrophysiological recordings.
Conventional patch-clamp recordings were performed in whole-cell and cell-attached configurations. Slices were superfused with preheated solution of the following composition (in mm): 130 NaCl, 24 NaHCO3, 3.5 KCl, 1.25 NaH2PO4, 2 CaCl2, 1 MgCl2, and 10 glucose (saturated with 95% O2, 5% CO2 at pH 7.4 and maintained at a constant temperature of 30–32°C).
Cells were observed and selected for recording by means of 60× infrared water-immersion objective applied to a direct microscope (either Scientifica or Olympus) equipped with oblique illumination Olympus optics and an infrared camera system (Till Photonics). Cajal-Retzius cells were recognized by their typical shape and fluorescence in the CXCR4–EGFP mouse. For optogenetic studies, we used animals in which Cajal-Retzius cells were not labeled by EGFP. In these specific experiments, we preselected cells based on both their firing pattern and appearance in the slice. Stratum lacunosum-moleculare interneurons were chosen because of their location in that layer, preferably close to the hippocampal fissure, as in the study by Zsiros and Maccaferri (2005), and firing patterns. O-LM interneurons were preselected based on the appearance of their main dendrites in the slice and firing patterns.
Pipettes were pulled from borosilicate thin glass capillaries and filled with the appropriate filtered solution to a 3–5 MΩ final resistance, as detailed below. Recordings were performed using a Multiclamp 700 amplifier (Molecular Devices). Data were filtered at 3 kHz and digitized at 10–20 kHz using a Digidata analog-to-digital board and the Clampex 9 program suite (Molecular Devices). Voltage-clamp recordings were performed at a holding potential of −60 mV, whereas cell-attached recordings were performed at a holding potential of 0 mV. Series resistances were monitored by injecting a 5/10 mV step in voltage clamp but not compensated.
Pipette solutions.
We used different types of solutions, as follows. The solution for current-clamp recordings from interneurons contained the following: 105 mm K-methylsulfate, 10 mm NaCl, 20 mm KCl, 0.3 mm GTP-Na3, 4 mm ATP-Mg, 16 mm KHCO3, and 0.3–0.5% biocytin, equilibrated with 95% O2, 5% CO2 to a pH 7.3. The solution for voltage- and current-clamp recordings from Cajal-Retzius cells contained the following: 125 mm KCl, 10 mm NaCl, 0.3 mm GTP-Na3, 4 mm ATP-Mg, 16 mm KHCO3, 10 mm QX-314-Cl, and 0.3–0.5% biocytin, equilibrated with 95% O2, 5% CO2 to a pH 7.3. QX-314-Cl was omitted for the experiments of Figures 5, 8, and 12. The solution for cell-attached recordings from Cajal-Retzius cells contained the following (in mm): 130 NaCl, 24 NaHCO3, 3.5 KCl, 1.25 NaH2PO4, 2 CaCl2, 1 MgCl2, and 10 glucose (saturated with 95% O2, 5% CO2 at pH 7.4). In a few experiments of Figure 11, to record stratum lacunosum-moleculare-evoked postsynaptic currents from the same cell evaluated previously in cell-attached conditions, we also passed into whole-cell configuration, similarly to what done by Woodruff et al. (2009).
Figure 5.

uPSC from stratum lacunosum-moleculare interneurons are purely mediated by GABAA receptors. A, Firing pattern (current pulses, −75/75 pA) of a presynaptic interneuron (left, blue) and unitary response (right; ctrl, control, red trace; gbz = 12.5 μm gabazine, black trace) to a train of spikes of a connected postsynaptic Cajal-Retzius cell (right, P13). Notice the similarity of the firing pattern with the one shown in Figure 2 (middle) and the complete abolishment of the postsynaptic response by gabazine. B, As in A but from a different cell pair (P14). Current pulses for the firing pattern were −100/100 pA. Notice the firing pattern similarity with the one shown in Figure 2 (right).
Figure 8.

Light stimulation of the axons of Sst-expressing neurons in stratum lacunosum-moleculare triggers action potential-dependent postsynaptic currents mediated by GABAA receptors. A, Top, Typical firing pattern identifying the recorded Cajal-Retzius cells (current pulses, −15/40 pA). Bottom, A short blue light pulse (blue trace) induces synaptic currents (red; ctrl, control) in the postsynaptic Cajal-Retzius cell. These events were totally blocked by TTX (500 nm; black traces, P15). B, Similar to A, but the effect of gabazine (gbz; 12.5 μm) is shown (P18).
Figure 12.

A, Injection of a synaptic conductance with experimentally derived kinetic properties into Cajal-Retzius cells results in decreased/increased excitability depending on the membrane potential. Top, Experimental traces during the injection of the synaptic conductance (slow, slow kinetics derived from the experimental record of Fig. 11) and constant amplitude current pulses shifting in time to assess excitability. Several sweeps are superimposed; one trace is highlighted in red to allow the association with its appropriate current step (P14). The dotted line indicates −45 mV. The summary bar graph reveals an inhibitory response to the conductance injection with no excitation. Bottom, As in the top, but the cell was held at more hyperpolarized potentials (dotted line indicates −50 mV, P13). Notice in the summary graph the presence of a clear excitatory response. B, Same as in A but after the injection of a fast conductance, derived from stratum oriens stimulation (Fig. 9). Notice the presence of a clear excitatory response under both depolarized (P14) and hyperpolarized (P13) conditions.
Figure 11.

Inhibition versus excitation of Cajal-Retzius cells after stimulation of stratum lacunosum-moleculare reveals a functional dichotomy. A, The excitability of some Cajal-Retzius cells is inhibited by stratum lacunosum-moleculare stimulation via GABAA receptors. Top, Examples of recordings from a Cajal-Retzius cell in cell-attached configuration (c-a, black trace, red arrows indicate the three-stimulus pulses, P14) and under whole-cell conditions (P15): note the slow kinetics of the synaptic current (w-c, red trace, different cell). The summary bar plot from several recordings show the clear inhibitory effect of stratum lacunosum-moleculare stimulation on the frequency of spontaneous firing in control conditions (NBQX, 25 μm; d-AP-5, 50 μm). Bottom, The inhibitory effect is lost after the addition of gabazine (12.5 μm). The cell-attached recording shown is from the same cell shown in control conditions. The summary bar graph confirms the lack of effect of stratum lacunosum-moleculare stimulation on the spontaneous frequency. B, Stimulation of stratum lacunosum-moleculare may also increase excitability and spontaneous firing in Cajal-Retzius cells. The top insets show examples of recordings from a Cajal-Retzius cell in cell-attached configuration (c-a, black trace, red arrows indicate the three stimulus pulses, P13) and under whole-cell conditions: note the slow kinetics of the synaptic current (w-c, red trace, different cell, P10). The summary plot from several recordings is shown at the bottom. C, Addition of gabazine completely blocks both spontaneous and evoked firing (same cell as in B). D, Cajal-Retzius cells responding to stimulation of stratum lacunosum-moleculare with inhibition versus excitation have different rates of spontaneous firing. Summary graph quantifying the effect of stratum lacunosum-moleculare stimulation as a function of prestimulation baseline frequency. Filled circles indicate recordings associated with increased poststimulus firing (excitatory responses, ratio > 1), whereas open circles identify cells responding with cessation of spontaneous firing (inhibitory responses, ratio = 0). One recording with baseline frequency at 0 Hz, which produced action currents after stimulation, is identified by the infinity symbol. Notice the L-shape of the plot and the overwhelming association of excitatory responses with low baseline frequencies in contrast to inhibitory responses mostly associated with higher spontaneous activity.
Analysis of synaptic events.
For spontaneous postsynaptic currents, events were first collected using the template-based analysis feature of Clampfit and then reviewed by visual inspection. For unitary events from paired recordings, postsynaptic currents were averaged after alignment using the presynaptic spike as trigger. The decay kinetic properties of the unitary events were analyzed as described by Maccaferri et al. (2000): the time constant of the monoexponential fit or the weighted average of the two time constants obtained from biexponential fits (Banks et al. 1998) was used for the analysis. If neither monoexponential or biexponential functions could adequately fit the decay of the postsynaptic event, the time to 63% of decay was used. For stratum-oriens-evoked postsynaptic currents, events were first averaged and then analyzed similarly to unitary events.
Events were analyzed using the Clampfit 9.0 (Molecular Devices), Origin Pro7.0 (OriginLab), Prism 3.0 (GraphPad Software), and Microsoft Excel suites of programs.
Optogenetic stimulation of neurons.
Blue light was transmitted to the slice from a collimated LED (royal blue, 455 nm wavelength; Thorlabs) attached to the epifluorescence port of an Olympus BX51WI direct microscope. Light flashes of 1–5 ms duration were reflected by a mirror to 60× objective (1.0 numerical aperture) every 2 min.
Anatomical methods.
Biocytin-filled cells were visualized using a slightly modified version of the protocol described by Lübke et al. (2000). Slices were fixed overnight in 4% paraformaldehyde in 0.1 m phosphate buffer (PB). Endogenous peroxidase activity was quenched using a 3% H2O2 solution for 15 min. Slices were incubated overnight at 4°C in avidin-biotinylated–HRP complex (Vectastain ABC Elite kit) with 0.1% Triton X-100 in PB, followed by a peroxidase reaction with 3′3-diaminobenzidine tetrahydrochloride as a chromogen, and intensified with 1% NiNH4SO4 and 1% CoCl2. Cells were then checked for contrast under light microscopy and briefly postfixed with 0.1% OsO4 in PB (1–3 min). Slices were then mounted on slides with Moviol (Hoescht) and coverslipped. After drying, cells were reconstructed using a drawing tube and digitized using the NeuronJ plugin of NIH ImageJ (Meijering et al., 2004).
Time windows used for the statistical analysis of synaptic events and action currents.
For the pharmacological experiments of Figure 10, control values were obtained during the initial 5 min in control conditions (t = 0–5 min) and compared with values calculated in the presence of the drug (2 min after its application, t = 7–12 min).
Figure 10.

Activation of group I metabotropic glutamate receptors in stratum oriens increases the frequency of spontaneous isolated GABAergic currents (NBQX, 25 μm; d-AP-5, 50 μm) in Cajal-Retzius cells. A, Top, Sample traces of spontaneous activity in control conditions (a) and in the presence of DHPG (10 μm; b) recorded from a Cajal-Retzius cell in a naive slice (control slice, P13; same scale bars for a and b). The red bar indicates the expanded section in the bottom insets. Middle, Bottom, Time course of the normalized frequency and amplitude of spontaneous events, respectively. Notice the large increase of event frequency and the small, nonsignificant effect on the amplitude. B, As in A, but experiments were performed in surgically modified slices with a cut to disconnect stratum oriens from the other layers (reduced slice, P13). Notice the lack of effect both on event frequency and amplitude.
Firing rates shown in the plots of Figures 11 and 12 were calculated as described by Abeles (1982). For the statistical comparison of the data shown in Figure 11, we used prestimulus frequencies calculated in a 20 ms period (t = 40–60 ms) and poststimulus frequencies obtained in time windows of identical duration (early poststimulus, t = 90–110 ms; late poststimulus, t = 400–420 ms). Baseline frequencies of individual recordings shown in the scatter plot were measured using the entire prestimulus period (t = 0–60 ms). The effect of stratum lacunosum-moleculare stimulation was quantified for individual cells of the same plot as follows. First, the peak effect of stimulation was identified in a time course plot binned at 5 ms intervals, and then this poststimulus frequency value was divided by the prestimulus baseline frequency. For the data of Figure 12, when a slow conductance was injected, we compared preinjection frequencies calculated in a 20 ms period (t = 40–60 ms) versus later time windows of the same duration (t = 60–80 ms and t = 100–120 ms). When a fast conductance was injected, because of the decreased jitter of the response, we used time windows of 10 ms (preinjection, t = 50–60 ms vs t = 60–70 ms and t = 100–110 ms).
Statistical methods.
Data are presented as mean ± SE. Significance level was selected as 0.05, and nonparametric tests were used as appropriate. Specific tests are indicated in the text.
Drugs.
Drugs were from Ascent Scientific or Abcam (d-AP-5, DHPG, NBQX, and gabazine) and Alomone Labs (QX-314-Cl).
Results
Cajal-Retzius cells of hippocampal CA1 stratum lacunosum-moleculare receive spontaneous synaptic input that is completely abolished by GABAA receptor antagonists (Marchionni et al., 2010). When recorded in voltage-clamp configuration, spontaneous GABAergic events had an average amplitude of 113 ± 12 pA (n = 14 cells from n = 5 mice of 12.6 ± 0.4 postnatal days of age), with a large variability (Fig. 1). The observed variability could be intrinsic to the GABA releasing presynaptic terminals, reflect their location along the somatodendritic axis of the cell, and/or indicate the presence of multiple sources of inputs with distinct properties.
Figure 1.

Spontaneous GABAergic currents in Cajal-Retzius cells. A, Pharmacologically isolated GABAergic currents in visually identified Cajal-Retzius cells of the CXCR4–EGFP mouse hippocampus. Trace recorded at Vholding = −60 mV with chloride-loaded intracellular solution (P14). The inset shows an example of an EGFP-positive cell, showing the characteristic “tadpole” morphology of a Cajal-Retzius cell. B, Cumulative distribution plot of events recorded from an individual cell (P14): notice the large variability of the events. C, Summary plots obtained from n = 14 cells. Ionotropic glutamatergic transmission blocked throughout via NBQX (25 μm) and d-AP-5 (50 μm).
Stratum lacunosum-moleculare interneurons as a source of local GABAergic input to Cajal-Retzius cells: properties of unitary postsynaptic currents
Because stratum lacunosum-moleculare is prominently innervated by local interneurons (Fig. 2), we decided to test the hypothesis that these neurons provide part of the GABAergc input received by Cajal-Retzius cells by taking advantage of interneuron → Cajal-Retzius cell paired recordings (Fig. 3, data from n = 15 mice of 11.9 ± 0.3 postnatal days of age). In 14 cases, anatomical recovery was sufficient to define them as neurogliaform-like cells based on their dendritic and axonal structures. In two cases, only the dendritic arborization was recovered, which was multipolar and consistent with what is usually shown by neurogliaform-like cells; in one other case only the axon was recovered. In eight cases, the structure of the recorded cells was not recovered, but the firing pattern was similar to what shown by anatomically recovered neurogliaform-like cells (Fig. 2). In one last case, neither the cell structure nor the firing pattern were recovered/recorded.
Figure 2.

Morphological properties and firing patterns of stratum lacunosum-moleculare interneurons. A, Anatomical reconstructions of three neurogliaform-like cells with local axonal arborization. Somatodendritic arborization in blue, axon in black. Stratum lacunosum-moleculare (l-m) in gray, stratum radiatum (r) and moleculare (m) in white. B, Firing patterns of the above reconstructed neurons. Notice the similarity to the ones shown in electrically coupled neurogliaform cells of stratum lacunosum-moleculare by Zsiros and Maccaferri (2005). Notice the large afterhyperpolarizations and regular firing of the cells in the left and right panels, and the more irregular pattern of the middle neuron. Current pulses were as follows (left to right): −75/75 pA, −75/175 pA, and −75/125 pA. Slices were prepared from P10 (left) and P12 (middle and right) animals.
Figure 3.
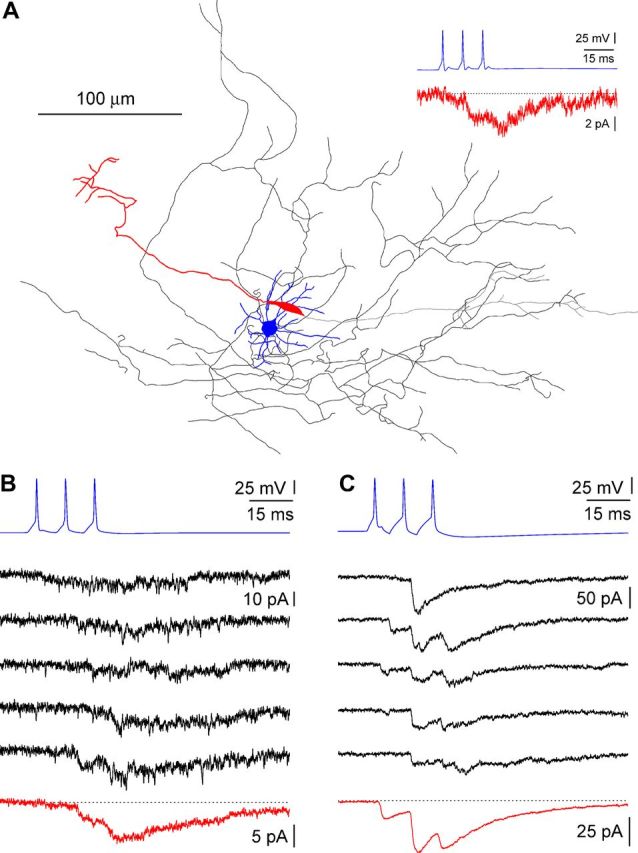
Synaptic signaling between stratum lacunosum-moleculare interneurons and Cajal-Retzius cells. A, Anatomical reconstruction of a neurogliaform → Cajal-Retzius cell connected pair (P12). Somatodendritic arborization of the interneuron in blue, axon in black. Somatodendritic structure of the Cajal-Retzius cell in red, axon in gray. The inset shows the averaged postsynaptic response of the Cajal-Retzius cell (red) to a train of action potentials in the interneuron (blue). B, C, Examples of uPSCs recorded on Cajal-Retzius cells in different pairs. B, Postsynaptic currents in response to a train of action potentials in the interneuron (blue) generate a very weak signal, barely recognizable in single sweeps (black) but clearly identifiable in an averaged trace (red, P12). C, Identical to B, but notice the larger postsynaptic responses already recognizable in single trials (P12).
As shown in Figure 3, a train of three action potentials triggered by current injection in the presynaptic neurons induced unitary responses that appeared as either an increased membrane noise of the recorded current or a clearly recognizable postsynaptic current. The amplitude of unitary postsynaptic currents (uPSCs) was 5 ± 1 pA (n = 26) for the first response and 11 ± 2 pA (n = 26) at the peak of the third response (Fig. 4). Overall, kinetic properties were slow. The average rise time of the first response was 3.4 ± 0.4 ms (n = 17), and the decay time constant of the compound response was 30.3 ± 2.9 ms (n = 23). Application of gabazine fully blocked unitary responses, indicating that they were mediated by GABAA receptors (n = 4; data not shown). However, in this set of experiments, the presence of a GABAB receptor-mediated component could not be evaluated because the voltage-clamp intracellular solution used for the Cajal-Retzius cells of the pairs contained QX-314, which blocks GABAB receptor-mediated postsynaptic currents (Nathan et al., 1990). Therefore, we repeated a similar set of measurements using QX-314-free recording pipettes. As is shown in Figure 5, under these experimental conditions, no outward current was detectable either in control conditions or after application of gabazine (n = 4 pairs from 4 animals of 11.8 ± 0.5 postnatal days of age). Thus, our experiments indicate that GABA released by hippocampal stratum lacunosum-moleculare local interneurons generates small-amplitude and slow kinetic responses on Cajal-Retzius cells, entirely mediated by GABAA receptors. This result also suggests that these neurons are unlikely to be the source of the larger-amplitude and kinetically faster events that occur spontaneously on Cajal-Retzius cells. We directly addressed this point by comparing the amplitude of the first unitary response recorded in connected pairs with the largest spontaneous event recorded in the absence of firing in the Cajal-Retzius cell of the pair (the postnatal age of the mice used in this dataset was 12 ± 0.3 d, n = 15). As shown in Figure 6, we could consistently record spontaneous events of much larger amplitude and faster kinetics than neurogliaform-originated responses. The amplitude of the largest spontaneous events observed was 237 ± 41 pA, which compared with 5 ± 1 pA for the unitary response to the first spike (p < 0.05, Wilcoxon's matched-pairs signed-rank test, n = 23). The ratio between these amplitudes was 66 ± 12 (n = 23). Furthermore, the rise time of the observed largest spontaneous event was much faster than the one measured for the first unitary response (0.7 ± 0.3 ms compared with 3.4 ± 0.4 ms, respectively; p < 0.05, Wilcoxon's matched-pairs signed-rank test, n = 17). The ratio of these values was 0.2 ± 0.1 (n = 17). This set of experiments also rules out technical limits as factors contributing to the small amplitude and slow kinetics of the recorded unitary events, because larger and faster currents were recorded in the same cells.
Figure 4.

Basic physiological properties of uPSC recorded in Cajal-Retzius cells in response to a three-spike train generated in presynaptic stratum lacunosum-moleculare interneurons. A, Schematic representation of the location of the soma (blue circles) of the tested interneurons along the hippocampus. B, Action potential of interneurons (blue) and postsynaptic currents recorded in Cajal-Retzius cells (red, P12). The double arrow indicates how amplitudes of the first (A1) and last (A3) response were measured, and the fit of the decay of the compound response is shown by the black line (for this example, τ decay was 25 ms). C, Summary plots for different measured uPSC parameters. Left to right, Amplitude of the first response (A1), relationship between amplitude of the first (A1) and third (A3) response (dotted line is the identity line), rise time of the first response (20–80% rt), and the decay time constant (τ decay) of the compound response.
Figure 6.

Large-amplitude and kinetically fast spontaneous synaptic currents coexist with small-amplitude, kinetically slow evoked unitary events. A, Simultaneous recording from a synaptically connected pair (P12). In the absence of firing of the interneuron (blue), the postsynaptic Cajal-Retzius cell receives a barrage of spontaneous activity. The amplitude of the largest spontaneous event (Amax) is measured for comparison with the first evoked unitary response. B, C, Firing pattern of the presynaptic interneuron (B) (blue; current pulses, −100/−75/−50/−25/100 pA) and unitary responses (C) (red, A1: amplitude of the postsynaptic response to the first action potential). D, Summary graphs highlighting the differences between amplitude and rise time of the first unitary response versus the largest spontaneous event. Left to right, Amplitude values (A1 and Amax), amplitude ratios (Amax/A1), rise time values (rt1, rise time of first unitary response; rtmax, rise time of the largest spontaneous response), and rise time ratios (rtmax/rt1). Notice the large differences spanning sometimes more than one order of magnitude.
Functional properties of O-LM cell-originated GABAergic input to Cajal-Retzius cells
Therefore, we decided to test the hypothesis that O-LM interneurons contribute postsynaptic currents with larger amplitudes and faster kinetics. Despite precedents in the literature reporting unitary currents generated by O-LM cells onto pyramidal cells (Maccaferri et al., 2000) and neurogliaform interneurons (Elfant et al., 2008), our attempts to record O-LM → Cajal-Retzius cell unitary events were unsuccessful (data not shown). The most parsimonious explanation is probably that the dendritic membrane surface of Cajal-Retzius cells is much more limited in its extension when compared with the entire apical tuft of pyramidal neurons or the multipolar dendritic arborization of neurogliaform interneurons.
We decided to readdress this issue by taking advantage of a different approach based on verifying a series of constraints that would be required by the specific cellular properties of O-LM cells. First, O-LM cells express the neuropeptide Sst (Maccaferri et al., 2000). Therefore, if O-LM cells contact Cajal-Retzius cells, then optogenetic stimulation of axons belonging to Sst-expressing interneurons in stratum lacunosum-moleculare should generate postsynaptic currents. Second, O-LM cells are defined by the origin and termination of their axon in stratum oriens and lacunosum-moleculare, respectively (Sik et al., 1995). Therefore, in the absence of glutamatergic transmission, direct electrical stimulation of stratum oriens should generate GABAergic postsynaptic responses on Cajal-Retzius cells. Third and last, O-LM cells express high levels of group I metabotropic glutamate receptors on their somatodendritic membranes (Baude et al., 1993; Ferraguti et al., 2004), which increase their spontaneous firing (McBain et al., 1994; van Hooft et al., 2000). Therefore, application of an agonist of these receptors on stratum oriens should increase the frequency of spontaneous postsynaptic currents observed on Cajal-Retzius cells.
To test the first prediction, we took advantage of a mouse line that expresses a ChR2 variant in Sst-positive interneurons (for details, see Materials and Methods) at levels sufficient to generate action potentials. We recorded from ChR2(H134R)-EYFP-expressing horizontal interneurons (Maccaferri, 2005) in stratum oriens exhibiting firing patterns typical of O-LM cells (data from mice of 14.3 ± 0.3 postnatal days age, n = 3). In nine of nine cells, we could trigger action potentials with short light pulses, and in all interneurons tested, we could record light-activated currents in voltage-clamp configuration (Fig. 7). Light stimulation of stratum lacunosum-moleculare with a short pulse of light revealed evoked postsynaptic currents in Cajal-Retzius cells (Fig. 8, data from n = 5 animals, 16.2 ± 1.0 postnatal days of age), which were identified by their characteristic firing pattern (n = 9) and, in some cases, also by post hoc recovery of their structure (n = 6). The events had an amplitude of 106 ± 15 pA, a rise time of 1.6 ± 0.3 ms (n = 9), and were fully blocked by TTX (n = 4) and gabazine (n = 4). Next, we verified the second prediction by recording the synaptic responses produced by electrical stimulation of stratum oriens with single and multiple pulses in the constant presence of ionotropic glutamate receptor blockers (data from five mice of 15.2 ± 1.0 postnatal days of age). As shown in Figure 9, we observed events with rise-time kinetics similar to the ones obtained with optogenetic stimulation but very different from what found in unitary connections mediated by neurogliaform cells. The rise time of stratum oriens-evoked postsynaptic currents (oPSCs) was 1.0 ± 0.2 ms (n = 14) compared with 1.6 ± 0.3 ms (n = 9) for light-evoked events (p > 0.05, Kruskal–Wallis with Dunn's post hoc test) and with 3.4 ± 0.4 ms (n = 17) for neurogliaform-evoked unitary events (p < 0.05, Kruskal–Wallis with Dunn's post hoc test). The amplitude of the response to the first pulse of oPSCs was 43 ± 12 pA (n = 14) and 69 ± 14 pA (n = 14) to the third. The decay time at the end of the third pulse was 23.7 ± 2.4 ms (n = 14).
Figure 7.

Camera lucida reconstruction of O-LM interneurons and channelrhodopsin-dependent currents and firing. A, Two examples of anatomical reconstructions of O-LM cells (left to right, P13 and P14, respectively) from unsuccessful paired recordings in CXCR4–EGFP mice (top; l-m, stratum lacunosum-moleculare; r, stratum radiatum; p, stratum pyramidale; o, stratum oriens). Bottom, Firing patterns of the above shown cells. Notice the presence of a sag in the hyperpolarizing response. In both cases, −100/50 pA current pulses were used. B, Left, Post hoc reconstruction of an O-LM cell (P15) from the Sst-IRES-Cre; ChR2(H134R)-EYFP mouse (l-m, stratum lacunosum-moleculare; r, stratum radiatum; p, stratum pyramidale; o, stratum oriens). C, Firing induced by a short (1 ms) blue light pulse (blue trace) in the cell shown in B. Several sweeps are superimposed. D, Light-induced currents in the same cell are shown in the top. The light pulse is shown in blue. The firing pattern (current pulses were −100/50 pA) is shown in the bottom. Notice the similarity with the firing patterns shown in A.
Figure 9.

Electrical field stimulation of stratum oriens evokes GABAA receptor-mediated postsynaptic currents in Cajal-Retzius cells in the presence of ionotropic glutamate receptors (NBQX, 25 μm; d-AP-5, 50 μm). A, Two different examples (left and right) of postsynaptic currents (P19 in both cases). Several sweeps are superimposed: notice the trial-to-trial variability and the different amplitudes. In both cases, failures are present. B, Response to a three-pulse stimulation protocol similar to the one used in the paired recordings of Figure 4. Notice the presence of failures also in this example (P15). C, Responses of the same cell shown in B to stratum oriens stimulations in control condition (ctrl; red trace) and after the addition of gabazine (gbz; 12.5 μm; black trace). D, Summary graphs for different parameters of the evoked postsynaptic current after the three-pulse protocol (red circles) similar to Figure 4. Left to right, Amplitude of the first response (A1), relationship between amplitude of the first (A1) and third (A3) response (dotted line is the identity line), rise time of the first response (20–80% rt), and the decay time constant (τ decay) of the compound response. The amplitude and rise time values measured for light-evoked currents (Fig. 8) are plotted as blue circles for comparison.
Thus, these results strongly converge in indicating that O-LM cells provide direct GABAergic input to Cajal-Retzius cells with different properties from the one originating from neurogliaform interneurons. As a last test of our predictions, we decided to increase firing in O-LM cells by exposing slices to the group I mGluR agonist DHPG (10 μm), in the presence of antagonists of ionotropic glutamate receptors (data from n = 3 animals of 13.3 ± 0.3 postnatal days of age). As shown in Figure 10, DHPG application increased the frequency of synaptic events from 154 ± 56 mHz in control conditions to 657 ± 147 mHz in the presence of the drug (n = 9, p < 0.05, Wilcoxon's matched-pairs signed-rank test). However, the amplitude of the spontaneous currents did not change significantly (133 ± 22 pA during the baseline vs 89 ± 9 pA during DHPG application, n = 9, p > 0.05, Wilcoxon's matched-pairs signed-rank test). This result was dependent on the integrity of the slice because surgical cuts disconnecting stratum oriens from stratum lacunosum-moleculare (reduced slice), and hence eliminating the effect of O-LM cells, prevented DHPG-induced increase of spontaneous events. In reduced slices (data from n = 3 mice of 14.0 ± 0.6 postnatal days of age), the control frequency was 100 ± 22 mHz, which compared with 160 ± 51 mHz in the presence of DHPG (n = 8, p > 0.05, Wilcoxon's matched-pairs signed-rank test). Under the same conditions, no significant effects were seen on event amplitudes (148 ± 10 pA in control vs 123 ± 16 pA during drug application, n = 8, p > 0.05, Wilcoxon's matched-pairs signed-rank test). In conclusion, our data strongly suggest that Cajal-Retzius cells receive direct GABAergic input both from neurogliaform and O-LM interneurons.
Inhibitory/excitatory effect of evoked GABAergic input depends on postsynaptic current kinetics and target cell membrane potential
What is the functional effect of these specific connections on the excitability of Cajal-Retzius cells? We reasoned that the firing of neurogliaform cells may be synchronized by gap junctions (Price et al., 2005; Zsiros and Maccaferri, 2005), and hence we decided to study responses to field stimulation of stratum lacunosum-moleculare, which is densely innervated by these neurons. As illustrated by Figure 11, we observed two different types of responses.
In the first group (n = 12 recordings of 21, data from n = 7 animals of 14.4 ± 0.4 postnatal days of age), we observed a clear inhibition of spontaneous firing. In five of these cells, we then passed from cell-attached configuration into whole-cell recordings. As shown in Figure 11, the postsynaptic response was slow, consistent with being mediated primarily by neurogliaform cells. A few cases in which faster kinetics were observed were not included in the analysis. In five additional recordings of this group, we maintained the cell-attached configuration and bath applied gabazine to verify that the effect was mediated by GABAA receptors. In control conditions, stimulation of stratum lacunosum-moleculare decreased spontaneous firing frequency from 9.7 ± 1.9 to 0.0 ± 0.0 Hz (n = 12, p < 0.05, Friedman's test with Dunn's post hoc test; for the time windows used for this analysis, see Materials and Methods) and then returned to baseline values (9.7 ± 1.7 Hz, n = 12, p > 0.05, Friedman's test with Dunn's post hoc test). In contrast, in the presence of gabazine, stimulation was ineffective and did not inhibit spontaneous firing. Under these experimental conditions, the frequency of spontaneous action currents was 12.5 ± 1.6 Hz before versus 7.5 ± 2.7 Hz after stimulation (n = 5, p > 0.05, Friedman's test with Dunn's post hoc test) and 11 ± 1.9 Hz in the recovery period (n = 5, p > 0.05, Friedman's test with Dunn's post hoc test).
The second group of recordings (n = 9 recordings of 21, data from n = 7 animals of 13.1 ± 0.6 postnatal days of age) revealed clear excitatory responses. Stimulation of stratum lacunosum-moleculare transiently increased the frequency of action currents from 3.7 ± 1.6 to 25.2 ± 6.0 Hz (n = 9, p < 0.05, Friedman's test with Dunn's post hoc test), which then returned to a frequency of 3.0 ± 1.4 Hz, similar to before stimulation (n = 9, p < 0.05, Friedman's test with Dunn's post hoc test). As shown in Figure 11, in a subset of experiments (n = 3), we passed from cell-attached to whole-cell conditions to verify the actual presence of an evoked postsynaptic current. In n = 5 different recordings, we maintained cell-attached configuration and bath perfused gabazine. In the presence of the drug, no action current could be recorded, before or after stimulation.
An additional observation suggested to us a possible explanation for the opposite results between the two groups. When we compared the basal spontaneous frequency of action currents of cells that responded to stimulation with inhibition versus excitation, we noticed a clear difference. Cells that were inhibited had a higher frequency of basal spontaneous activity compared with cells that were excited by stimulation. The value of action current frequency for the former group was 10.6 ± 1.4 Hz compared with 2.8 ± 1.2 Hz for the latter (Mann–Whitney test, p < 0.05, n = 21). This result could be easily explained by a different membrane potential in the two groups: more depolarized in the cells that respond to stimulation with inhibition and more hyperpolarized in the cells that respond with excitation. Under the former circumstances, depolarizing GABAergic input could lead to depolarizing block, whereas the latter more hyperpolarized cells would maintain their ability to generate action potentials. An additional result corroborating this interpretation is that gabazine had no significant effect on baseline spontaneous firing in cells that responded to stimulation with inhibition. In this group, baseline frequency was 10.6 ± 1.4 Hz in control conditions (n = 12) compared with 12.3 ± 1.9 Hz (n = 5) in the presence of gabazine (p > 0.05, Mann–Whitney U test; for the time windows used to estimate these frequencies, see Materials and Methods and figure legends). In contrast, gabazine had a very strong effect on baseline frequency in cells that responded to stimulation with excitation. Baseline frequency of spontaneous action currents was 2.8 ± 1.2 Hz (n = 9) in the absence of the drug versus 0.0 ± 0.0 (n = 5) after its application (p < 0.05, Mann–Whitney U test). Together, these results suggest that cells that are depolarized generate spontaneous firing driven by intrinsic properties (hence not blocked by gabazine), whereas action currents observed in Cajal-Retzius cells that are more hyperpolarized are entirely synaptically driven and, therefore, sensitive to gabazine.
Next, we reasoned that, if the membrane potential was the critical determinant of the inhibitory versus excitatory response to synaptic inputs, then we should observe similar membrane potential-dependent inhibitory/excitatory responses under dynamic clamp conditions, after the injection of experimentally recorded waveforms. We monitored membrane excitability by triggering action potentials with trains of 10-ms-long depolarizing current pulses of fixed amplitudes, injected at 10 Hz frequency, superimposed on the synaptic conductance. We injected a kinetically slow synaptic waveform conductance (taken from the experiments of Fig. 11), with a reversal potential of −30 mV (according to experimental estimates of EGABA in Cajal-Retzius cells; Mienville, 1998; Achilles et al., 2007). As shown in Figure 12, when the membrane potential was maintained at relatively depolarized levels (approximately −45 mV, similar to what observed immediately after breakthrough in whole-cell condition; Marchionni et al., 2010, their Fig. 11), the injection of a synaptic waveform did not lead to immediate increased firing (basal frequency before the conductance injection was 7.2 ± 0.6 vs 8.2 ± 0.6 Hz immediately after, n = 17, p > 0.05, Friedman's test with Dunn's multiple comparison post hoc correction, data from n = 5 mice of 13.6 ± 0.5 postnatal days of age). However, a clear inhibition of spiking was evident at later times (0.3 ± 0.3 Hz, n = 17, p < 0.05, Friedman's test with Dunn's multiple comparison post hoc correction). In contrast, when the recorded Cajal-Retzius cell was maintained at a relative hyperpolarized membrane potential (approximately −50 mV, data from n = 4 animals of 13.2 ± 0.6 postnatal days of age), clear excitation was observed immediately after the injection of the synaptic conductance. Basal frequency before the conductance injection was 8.6 ± 0.4 versus 35.8 ± 3.7 Hz immediately after (n = 14, p < 0.05, Friedman's test with Dunn's multiple comparison post hoc correction). Excitation was followed by inhibition at later times (0.0 ± 0.0 Hz, n = 14, p < 0.05, Friedman's test with Dunn's multiple comparison post hoc correction). These results mimic very well what was observed experimentally in Figure 11 and support the idea that a kinetically slow excitatory conductance may be very effective to drive Cajal-Retzius cells into depolarization block, when their membrane potential is in a depolarized state. In contrast, it can still provide excitation if the resting membrane potential of the cell is sufficiently hyperpolarized.
We took further advantage of this approach to test whether a conductance with the same reversal potential and amplitude, but faster kinetics, could produce different results. In an additional set of experiments, we tested the effect of a synaptic waveform experimentally recorded from stratum oriens stimulation, therefore likely to reflect the input provided by O-LM cells. Under these conditions, excitation was consistently observed at both depolarized and hyperpolarized membrane potentials, followed by a period of inhibition. When cells were held at approximately −45 mV (data from n = 6 mice of 13.0 ± 0.4 postnatal days of age), prestimulation frequency of firing was 7.0 ± 0.8 Hz, immediately followed by excitation (as indicated by a frequency of 45.5 ± 5.8 Hz, n = 17, p < 0.05, Friedman's test with Dunn's multiple comparison post hoc correction) and later inhibition (0.7 ± 0.3 Hz, n = 17, p < 0.05, Friedman's test with Dunn's multiple comparison post hoc correction). Similar results were obtained when cells were held more hyperpolarized (approximately −50 mV, data from n = 6 mice of 13.0 ± 0.4 postnatal days of age). Under these experimental conditions, basal frequency (7.9 ± 0.7 Hz) was followed by immediate excitation (74.1 ± 7.5 Hz, n = 15, p < 0.05, Friedman's test with Dunn's multiple comparison post hoc correction) and later inhibition (01.3 ± 0.5 Hz, n = 15, p < 0.05, Friedman's test with Dunn's multiple comparison post hoc correction).
Discussion
This work unravels a novel hippocampal microcircuit and reveals neurogliaform interneurons and O-LM cells as presynaptic sources of GABAergic input to Cajal-Retzius cells (Fig. 13). In addition, we identify a functional dichotomy of the responses of Cajal-Retzius to GABAergic synaptic input, which may have important consequences for their computational roles. In fact, our results suggest that the complex integration of the functional state of Cajal-Retzius cells (depolarized or hyperpolarized) with the specific presynaptic cellular sources of their GABAergic input may determine whether this signaling will result in inhibition versus excitation.
Figure 13.

Cajal-Retzius cells within the hippocampal circuit. The main conclusions of this work and relevant previous reports in the literature are summarized in a diagram. We have identified two novel presynaptic sources of GABAergic input to Cajal-Retzius cells (C-R): neurogliaform cells (NG; synapse indicated by 1) and O-LM cells (O-LM; synapse indicated by 2). Results of our work, together with previous results in the literature suggest that the disynaptic loop from pyramidal cells (P) to O-LM cells (synapse 6, facilitating; Ali and Thomson, 1998; Losonczy et al., 2002) and from O-LM cells to Cajal-Retzius cells (present work; synapse 2) may be particular efficient in activating Cajal-Retzius cells. Notice that, at the same time, O-LM cells have been reported to provide GABAergic input to neurogliaform cells (synapse 3; Elfant et al., 2008) and pyramidal neurons (synapse 5; Maccaferri et al., 2000). Also, neurogliaform cells have been shown to be the source of GABAA,slow-mediated synaptic input to pyramidal neurons (for review, see Capogna and Pearce, 2011). L-M, Stratum lacunosum-moleculare; R, stratum radiatum; P, stratum pyramidale; O, stratum oriens; A, alveus.
Significance of GABAergic input to Cajal-Retzius cells
Although Cajal-Retzius cells express functional ionotropic glutamate receptors (neocortex: Lu et al., 2001; hippocampus: Marchionni et al., 2010), several studies have shown that their spontaneous synaptic input is mediated exclusively by GABAA receptors (Kilb and Luhmann, 2001; Soda et al., 2003; Marchionni et al., 2010; Cosgrove and Maccaferri, 2012). In addition, electrophysiological (Mienville, 1998; Achilles et al., 2007; Marchionni et al., 2010) and immunohistochemical work (Pozas et al., 2008) converge in suggesting that Cajal-Retzius cells maintain a reversal potential for GABA that generates depolarizing responses throughout development.
We show that Cajal-Retzius cells receive GABAergic input from specific feedforward (neurogliaform) and feedback interneurons (O-LM cells) with distinct physiological characteristics. The unitary events originating from local stratum lacunosum-moleculare interneurons display rise time and decay kinetics similar to the previously described GABAA,slow synaptic currents recorded in rodent pyramidal cells (Pearce, 1993; for review, see Capogna and Pearce, 2011), which were eventually attributed to GABA released by neurogliaform cells (hippocampus: Price et al., 2005; Karayannis et al., 2010; neocortex: Tamás et al., 2003; Szabadics et al., 2007). However, in contrast to unitary events mediated by both GABAA and GABAB receptors in pyramidal cells (Tamás et al., 2003; Price et al., 2005), our experiments indicate, in Cajal-Retzius cells, the exclusive involvement of GABAA receptors. Thus, because of the depolarized EGABA in Cajal-Retzius cells (Mienville, 1998; Achilles et al., 2007; Marchionni et al., 2010), our work suggests that signaling at neurogliaform → Cajal-Retzius cell connections is purely depolarizing. The amplitude of the majority of the unitary currents recorded in our sample was surprisingly small (Fig. 3). Under our recording conditions (EGABA = ∼0 mV, Vholding = −60 mV), we measured an average amplitude of the first unitary response to a train of spikes of ∼5 pA. Assuming a physiological EGABA of approximately −30 mV (Mienville, 1998; Achilles et al., 2007) and a membrane input resistance of ∼1.5 GΩ (Marchionni et al., 2010), this would translate in an ∼4 mV depolarization from a resting potential of −60 mV. However, Cajal-Retzius cells also receive spontaneous events of much larger amplitude and faster kinetics (Marchionni et al., 2010; Figs. 1, 6), which would translate in much larger depolarizations, most likely large enough to trigger an action potential.
Although we were unable to obtain direct paired recordings between O-LM and Cajal-Retzius cells, a convergence of results using different techniques indicate that at least part of these larger-amplitude and kinetically faster events originate from O-LM interneurons (Figs. 8–10). For example, in some recordings, stimulation intensity was low enough that both failures and relatively large responses (of the order of magnitude of hundreds of picoamperes; Fig. 9) could be observed. Furthermore, although application of DHPG greatly increased the frequency of spontaneous events, its effect on amplitudes was modest and nonsignificant. This is likely to indicate that DHPG-induced firing in O-LM cells generated additional events of average amplitude similar to the one measured during the predrug baseline (∼100 pA).
Together, our results suggest that, although the summation/integration of postsynaptic currents generated by several presynaptic neurogliaform cells is required to impact significantly the membrane potential of Cajal-Retzius cells, fewer presynaptic O-LM cells are needed to drive Cajal-Retzius cells to firing thresholds.
It is also important to note that our work cannot exclude other types of interneurons as a source of GABAergic input to Cajal-Retzius cells. In fact, although neurogliaform and O-LM cells provide dense innervation of stratum lacunosum-moleculare, additional cells have been also shown to target this hippocampal layer (Klausberger and Somogyi, 2008).
Implications for the network functions of Cajal-Retzius cells
We propose that pyramidal cells may activate Cajal-Retzius cells via a disynaptic feedback pathway involving pyramidal → O-LM cells and O-LM → Cajal-Retzius cells synapses. In fact, our results indicate that O-LM cells produce kinetically fast postsynaptic currents, which would be predicted to generate suprathreshold activity in Cajal-Retzius cells. What could be the result of the activation of Cajal-Retzius cells? Although several studies have proposed that these neurons release glutamate (del Río et al., 1995; Hevner et al., 2003; Soda et al., 2003; but see Imamoto et al., 1994; Pesold et al., 1998), an unequivocal demonstration of their functional output is still lacking. Therefore, at this stage, we may only speculate that the neurotransmitter released by Cajal-Retzius cells may regulate temporoammonic–CA1 synapses (Marchionni et al., 2010) and perhaps contribute to their maturation at early developmental stages. Future work determining the functional output of Cajal-Retzius cells is essential to clarify this issue.
In contrast, our results also highlight a more complex role for GABAergic input to Cajal-Retzius cells originating from local stratum lacunosum-moleculare interneurons. In most cases, our structural and/or electrophysiological findings identified these presynaptic neurons as feedforward neurogliaform cells. Depending on the membrane potential of the recorded Cajal-Retzius cell, kinetically slow input (Pearce, 1993) likely to originate from neurogliaform interneurons (Capogna and Pearce, 2011) could result in either inhibition or excitation.
The precise determination of the resting membrane potential in postnatal Cajal-Retzius cells has been technically difficult because whole-cell recording conditions progressively hyperpolarize these neurons (neocortex: Mienville and Pesold, 1999; hippocampus: Marchionni et al., 2010, 2012). Nevertheless, Zhou and Hablitz (1996) reported a developmentally regulated increase of membrane potentials from approximately −40 mV at P0 to approximately −60 mV at P10 in neocortical Cajal-Retzius cells (but see Mienville and Pesold, 1999). Non-invasive techniques have also yielded contrasting results. Mienville (1998) and Mienville and Pesold (1999) reported depolarized (∼45 mV) membrane potentials using perforated-patch recordings, whereas Achilles et al. (2007), by measuring the reversal potential of NMDA receptor channels recorded in cell-attached mode, estimated more hyperpolarized resting potentials (approximately −80 mV). In the hippocampus, we have observed spontaneously active Cajal-Retzius cells under cell-attached configuration, with firing frequencies ranging from 0 to 20 Hz (Marchionni et al., 2010). However, it is difficult to translate these measurements into precise membrane potential values. In fact, the differential sensitivity to gabazine of spontaneous firing in Cajal-Retzius cells with lower versus higher control frequencies (Fig. 11) suggests that cells at the lower end of this distribution do possess a resting potential and are exclusively driven by spontaneous depolarizing synaptic events, whereas the ones firing at higher rates have a more depolarized potential and are mostly driven by intrinsic properties (Fig. 11).
Either a bimodal or unimodal distribution (with a large variance) of the membrane potential of Cajal-Retzius cells themselves could explain the dichotomy of the inhibitory/excitatory responses to stratum lacunosum-moleculare. In this latter case, one might expect in the middle range smaller or even “neutral” responses, but this was not the case for our experiments (see the L-shaped plot of Fig. 11, without a progressive transition from excitation to inhibition with increasing baseline frequencies). The measurement of membrane potential from a very large number of Cajal-Retzius cells with non-invasive techniques will be required to directly build an accurate distribution and resolve this question.
In any case, the level of membrane potential of Cajal-Retzius cells could reflect various factors. For example, it could be related to the specific ontogenetic origin of the cell, because several areas have been shown to contribute to Cajal-Retzius cell generation (Bielle et al., 2005). However, the direct comparison of the electrophysiological properties of neocortical Cajal-Retzius cells of different ontogenetic origins failed to report any differences (Sava et al., 2010). Alternatively, it could reflect the dynamic regulation of specific membrane properties. BK-type calcium-dependent potassium channels expressed by Cajal-Retzius cells are powerfully modulated by chemokines, in particular by CXCL12, via the CXCR4 receptor (Marchionni et al., 2010, 2012). We are currently testing the hypothesis that the endogenous levels of CXCL12 in the slice may determine the membrane potential and functional state of the cell under recording. However, independently of what the final mechanism(s) will turn out to be, it is nevertheless important to note that our data predict that modulation by chemokine of the membrane potential in Cajal-Retzius cells would determine the functional effect of GABAergic input from neurogliaform to Cajal-Retzius cells, thus adding another layer of complexity to their computational properties.
Conclusions
In summary, this work has reveled two previously unknown cellular sources of GABAergic input to Cajal-Retzius cells, namely neurogliaform and O-LM cells, and a functional dichotomy of Cajal-Retzius cells in their responses to specific GABAergic inputs. We propose that these new elements are important determinants of computational functions of Cajal-Retzius cells during the development of the hippocampal network and, potentially, even at more mature stages (Supèr et al., 1998).
Footnotes
This work was supported by National Institute of Neurological Disease and Stroke Grant NS 064135 (G.M.). We thank Dr. Alfonso J. Apicella for help with and discussion of the optogenetic experiments.
The authors declare no competing financial interests.
References
- Abeles M. Quantification, smoothing, and confidence limits for single-units' histograms. J Neurosci Methods. 1982;5:317–325. doi: 10.1016/0165-0270(82)90002-4. [DOI] [PubMed] [Google Scholar]
- Achilles K, Okabe A, Ikeda M, Shimizu-Okabe C, Yamada J, Fukuda A, Luhmann HJ, Kilb W. Kinetic properties of Cl uptake mediated by Na+-dependent K+–2Cl cotransport in immature rat neocortical neurons. J Neurosci. 2007;27:8616–8627. doi: 10.1523/JNEUROSCI.5041-06.2007. [DOI] [PMC free article] [PubMed] [Google Scholar]
- Ali AB, Thomson AM. Facilitating pyramid to horizontal oriens-alveus interneurone inputs: dual intracellular recordings in slices of rat hippocampus. J Physiol. 1998;507:185–199. doi: 10.1111/j.1469-7793.1998.185bu.x. [DOI] [PMC free article] [PubMed] [Google Scholar]
- Armstrong C, Krook-Magnuson E, Soltesz I. Neurogliaform and ivy cells: a major family of nNOS expressing GABAergic neurons. Front Neural Circuits. 2012;6:23. doi: 10.3389/fncir.2012.00023. [DOI] [PMC free article] [PubMed] [Google Scholar]
- Banks MI, Li TB, Pearce RA. The synaptic basis of GABAA, slow. J Neurosci. 1998;18:1305–1317. doi: 10.1523/JNEUROSCI.18-04-01305.1998. [DOI] [PMC free article] [PubMed] [Google Scholar]
- Baude A, Nusser Z, Roberts JD, Mulvihill E, McIlhinney RA, Somogyi P. The metabotropic glutamate receptor (mGluR1 alpha) is concentrated at perisynaptic membrane of neuronal subpopulations as detected by immunogold reaction. Neuron. 1993;11:771–787. doi: 10.1016/0896-6273(93)90086-7. [DOI] [PubMed] [Google Scholar]
- Bielle F, Griveau A, Narboux-Nême N, Vigneau S, Sigrist M, Arber S, Wassef M, Pierani A. Multiple origins of Cajal-Retzius cells at the borders of the developing pallium. Nat Neurosci. 2005;8:1002–1012. doi: 10.1038/nn1511. [DOI] [PubMed] [Google Scholar]
- Capogna M. Neurogliaform cells and other interneurons of stratum lacunosum-moleculare gate entorhinal-hippocampal dialogue. J Physiol. 2011;589:1875–1883. doi: 10.1113/jphysiol.2010.201004. [DOI] [PMC free article] [PubMed] [Google Scholar]
- Capogna M, Pearce RA. GABA A, slow: causes and consequences. Trends Neurosci. 2011;34:101–112. doi: 10.1016/j.tins.2010.10.005. [DOI] [PubMed] [Google Scholar]
- Cosgrove KE, Maccaferri G. mGlu1α-dependent recruitment of excitatory GABAergic input to neocortical Cajal-Retzius cells. Neuropharmacology. 2012;63:486–493. doi: 10.1016/j.neuropharm.2012.04.025. [DOI] [PMC free article] [PubMed] [Google Scholar]
- del Río JA, Martínez A, Fonseca M, Auladell C, Soriano E. Glutamate-like immunoreactivity and fate of Cajal-Retzius cells in the murine cortex as identified with calretinin antibody. Cereb Cortex. 1995;5:13–21. doi: 10.1093/cercor/5.1.13. [DOI] [PubMed] [Google Scholar]
- Elfant D, Pál BZ, Emptage N, Capogna M. Specific inhibitory synapses shift the balance from feedforward to feedback inhibition of hippocampal CA1 pyramidal cells. Eur J Neurosci. 2008;27:104–113. doi: 10.1111/j.1460-9568.2007.06001.x. [DOI] [PubMed] [Google Scholar]
- Ferraguti F, Cobden P, Pollard M, Cope D, Shigemoto R, Watanabe M, Somogyi P. Immunolocalization of metabotropic glutamate receptor 1alpha (mGluR1alpha) in distinct classes of interneuron in the CA1 region of the rat hippocampus. Hippocampus. 2004;14:193–215. doi: 10.1002/hipo.10163. [DOI] [PubMed] [Google Scholar]
- Hevner RF, Neogi T, Englund C, Daza RA, Fink A. Cajal-Retzius cells in the mouse: transcription factors, neurotransmitters, and birthdays suggest a pallial origin. Brain Res Dev Brain Res. 2003;141:39–53. doi: 10.1016/s0165-3806(02)00641-7. [DOI] [PubMed] [Google Scholar]
- Imamoto K, Karasawa N, Isomura G, Nagatsu I. Cajal–Retzius neurons identified by GABA immunohistochemistry in layer I of the rat cerebral cortex. Neurosci Res. 1994;20:101–105. doi: 10.1016/0168-0102(94)90027-2. [DOI] [PubMed] [Google Scholar]
- Karayannis T, Elfant D, Huerta-Ocampo I, Teki S, Scott RS, Rusakov DA, Jones MV, Capogna M. Slow GABA transient and receptor desensitization shape synaptic responses evoked by hippocampal neurogliaform cells. J Neurosci. 2010;30:9898–9909. doi: 10.1523/JNEUROSCI.5883-09.2010. [DOI] [PMC free article] [PubMed] [Google Scholar]
- Kilb W, Luhmann HJ. Spontaneous GABAergic postsynaptic currents in Cajal-Retzius cells in neonatal rat cerebral cortex. Eur J Neurosci. 2001;13:1387–1390. doi: 10.1046/j.0953-816x.2001.01514.x. [DOI] [PubMed] [Google Scholar]
- Kirmse K, Dvorzhak A, Henneberger C, Grantyn R, Kirischuk S. Cajal Retzius cells in the mouse neocortex receive two types of pre- and postsynaptically distinct GABAergic inputs. J Physiol. 2007;585:881–895. doi: 10.1113/jphysiol.2007.145003. [DOI] [PMC free article] [PubMed] [Google Scholar]
- Klausberger T, Somogyi P. Neuronal diversity and temporal dynamics: the unity of hippocampal circuit operations. Science. 2008;321:53–57. doi: 10.1126/science.1149381. [DOI] [PMC free article] [PubMed] [Google Scholar]
- Losonczy A, Zhang L, Shigemoto R, Somogyi P, Nusser Z. Cell type dependence and variability in the short-term plasticity of EPSCs in identified mouse hippocampal interneurones. J Physiol. 2002;542:193–210. doi: 10.1113/jphysiol.2002.020024. [DOI] [PMC free article] [PubMed] [Google Scholar]
- Lu SM, Zecevic N, Yeh HH. Distinct NMDA and AMPA receptor-mediated responses in mouse and human Cajal-Retzius cells. J Neurophysiol. 2001;86:2642–2646. doi: 10.1152/jn.2001.86.5.2642. [DOI] [PubMed] [Google Scholar]
- Lübke J, Egger V, Sakmann B, Feldmeyer D. Columnar organization of dendrites and axons of single and synaptically coupled excitatory spiny neurons in layer 4 of the rat barrel cortex. J Neurosci. 2000;20:5300–5311. doi: 10.1523/JNEUROSCI.20-14-05300.2000. [DOI] [PMC free article] [PubMed] [Google Scholar]
- Maccaferri G. Stratum oriens horizontal interneurone diversity and hippocampal network dynamics. J Physiol. 2005;562:73–80. doi: 10.1113/jphysiol.2004.077081. [DOI] [PMC free article] [PubMed] [Google Scholar]
- Maccaferri G. Modulation of hippocampal stratum lacunosum-moleculare microcircuits. J Physiol. 2011;589:1885–1891. doi: 10.1113/jphysiol.2010.201079. [DOI] [PMC free article] [PubMed] [Google Scholar]
- Maccaferri G, Roberts JD, Szucs P, Cottingham CA, Somogyi P. Cell surface domain specific postsynaptic currents evoked by identified GABAergic neurones in rat hippocampus in vitro. J Physiol. 2000;524:91–116. doi: 10.1111/j.1469-7793.2000.t01-3-00091.x. [DOI] [PMC free article] [PubMed] [Google Scholar]
- Madisen L, Mao T, Koch H, Zhuo JM, Berenyi A, Fujisawa S, Hsu YW, Garcia AJ, 3rd, Gu X, Zanella S, Kidney J, Gu H, Mao Y, Hooks BM, Boyden ES, Buzsáki G, Ramirez JM, Jones AR, Svoboda K, Han X, Turner EE, Zeng H. A toolbox of Cre-dependent optogenetic transgenic mice for light-induced activation and silencing. Nat Neurosci. 2012;15:793–802. doi: 10.1038/nn.3078. [DOI] [PMC free article] [PubMed] [Google Scholar]
- Marchionni I, Takács VT, Nunzi MG, Mugnaini E, Miller RJ, Maccaferri G. Distinctive properties of CXC chemokine receptor 4-expressing Cajal-Retzius cells versus GABAergic interneurons of the postnatal hippocampus. J Physiol. 2010;588:2859–2878. doi: 10.1113/jphysiol.2010.190868. [DOI] [PMC free article] [PubMed] [Google Scholar]
- Marchionni I, Beaumont M, Maccaferri G. The chemokine CXCL12 and the HIV-1 envelope protein gp120 regulate spontaneous activity of Cajal-Retzius cells in opposite directions. J Physiol. 2012;590:3185–3202. doi: 10.1113/jphysiol.2011.224873. [DOI] [PMC free article] [PubMed] [Google Scholar]
- McBain CJ, DiChiara TJ, Kauer JA. Activation of metabotropic glutamate receptors differentially affects two classes of hippocampal interneurons and potentiates excitatory synaptic transmission. J Neurosci. 1994;14:4433–4445. doi: 10.1523/JNEUROSCI.14-07-04433.1994. [DOI] [PMC free article] [PubMed] [Google Scholar]
- Meijering E, Jacob M, Sarria J-C, Steiner P, Hirling H, Unser M. Design and validation of a tool for neurite tracing and analysis in fluorescence microscopy images. Citometry A. 2004;58:167–176. doi: 10.1002/cyto.a.20022. [DOI] [PubMed] [Google Scholar]
- Mienville JM. Persistent depolarizing action of GABA in rat Cajal-Retzius cells. J Physiol. 1998;512:809–817. doi: 10.1111/j.1469-7793.1998.809bd.x. [DOI] [PMC free article] [PubMed] [Google Scholar]
- Mienville JM, Pesold C. Low resting potential and postnatal upregulation of NMDA receptors may cause Cajal-Retzius cell death. J Neurosci. 1999;19:1636–1646. doi: 10.1523/JNEUROSCI.19-05-01636.1999. [DOI] [PMC free article] [PubMed] [Google Scholar]
- Myakhar O, Unichenko P, Kirischuk S. GABAergic projections from the subplate to Cajal-Retzius cells in the neocortex. Neuroreport. 2011;22:525–529. doi: 10.1097/WNR.0b013e32834888a4. [DOI] [PubMed] [Google Scholar]
- Nathan T, Jensen MS, Lambert JD. The slow inhibitory postsynaptic potential in rat hippocampal CA1 neurones is blocked by intracellular injection of QX-314. Neurosci Lett. 1990;110:309–313. doi: 10.1016/0304-3940(90)90865-7. [DOI] [PubMed] [Google Scholar]
- Pearce RA. Physiological evidence for two distinct GABAA responses in rat hippocampus. Neuron. 1993;10:189–200. doi: 10.1016/0896-6273(93)90310-n. [DOI] [PubMed] [Google Scholar]
- Pesold C, Impagnatiello F, Pisu MG, Uzunov DP, Costa E, Guidotti A, Caruncho HJ. Reelin is preferentially expressed in neurons synthesizing gamma-aminobutyric acid in cortex and hippocampus of adult rats. Proc Natl Acad Sci U S A. 1998;95:3221–3226. doi: 10.1073/pnas.95.6.3221. [DOI] [PMC free article] [PubMed] [Google Scholar]
- Pozas E, Paco S, Soriano E, Aguado F. Cajal-Retzius cells fail to trigger the developmental expression of the Cl(−)extruding co-transporter KCC2. Brain Res. 2008;1239:85–91. doi: 10.1016/j.brainres.2008.08.058. [DOI] [PubMed] [Google Scholar]
- Price CJ, Cauli B, Kovacs ER, Kulik A, Lambolez B, Shigemoto R, Capogna M. Neurogliaform neurons form a novel inhibitory network in the hippocampal CA1 area. J Neurosci. 2005;25:6775–6786. doi: 10.1523/JNEUROSCI.1135-05.2005. [DOI] [PMC free article] [PubMed] [Google Scholar]
- Sava BA, Dávid CS, Teissier A, Pierani A, Staiger JF, Luhmann HJ, Kilb W. Electrophysiological and morphological properties of Cajal-Retzius cells with different ontogenetic origins. Neuroscience. 2010;167:724–734. doi: 10.1016/j.neuroscience.2010.02.043. [DOI] [PubMed] [Google Scholar]
- Sik A, Penttonen M, Ylinen A, Buzsáki G. Hippocampal CA1 interneurons: an in vivo intracellular labeling study. J Neurosci. 1995;15:6651–6665. doi: 10.1523/JNEUROSCI.15-10-06651.1995. [DOI] [PMC free article] [PubMed] [Google Scholar]
- Soda T, Nakashima R, Watanabe D, Nakajima K, Pastan I, Nakanishi S. Segregation and coactivation of developing neocortical layer 1 neurons. J Neurosci. 2003;23:6272–6279. doi: 10.1523/JNEUROSCI.23-15-06272.2003. [DOI] [PMC free article] [PubMed] [Google Scholar]
- Soriano E, Del Río JA. The cells of cajal-retzius: still a mystery one century after. Neuron. 2005;46:389–394. doi: 10.1016/j.neuron.2005.04.019. [DOI] [PubMed] [Google Scholar]
- Stumm RK, Rummel J, Junker V, Culmsee C, Pfeiffer M, Krieglstein J, Höllt V, Schulz S. A dual role for the SDF-1/CXCR4 chemokine receptor system in adult brain: isoform-selective regulation of SDF-1 expression modulates CXCR4-dependent neuronal plasticity and cerebral leukocyte recruitment after focal ischemia. J Neurosci. 2002;22:5865–5878. doi: 10.1523/JNEUROSCI.22-14-05865.2002. [DOI] [PMC free article] [PubMed] [Google Scholar]
- Stumm RK, Zhou C, Ara T, Lazarini F, Dubois-Dalcq M, Nagasawa T, Höllt V, Schulz S. CXCR4 regulates interneuron migration in the developing neocortex. J Neurosci. 2003;23:5123–5130. doi: 10.1523/JNEUROSCI.23-12-05123.2003. [DOI] [PMC free article] [PubMed] [Google Scholar]
- Supèr H, Martínez A, Del Río JA, Soriano E. Involvement of distinct pioneer neurons in the formation of layer-specific connections in the hippocampus. J Neurosci. 1998;18:4616–4626. doi: 10.1523/JNEUROSCI.18-12-04616.1998. [DOI] [PMC free article] [PubMed] [Google Scholar]
- Szabadics J, Tamás G, Soltesz I. Different transmitter transients underlie presynaptic cell type specificity of GABAA, slow and GABAA, fast. Proc Natl Acad Sci U S A. 2007;104:14831–14836. doi: 10.1073/pnas.0707204104. [DOI] [PMC free article] [PubMed] [Google Scholar]
- Tamás G, Lorincz A, Simon A, Szabadics J. Identified sources and targets of slow inhibition in the neocortex. Science. 2003;299:1902–1905. doi: 10.1126/science.1082053. [DOI] [PubMed] [Google Scholar]
- Taniguchi H, He M, Wu P, Kim S, Paik R, Sugino K, Kvitsani D, Fu Y, Lu J, Lin Y, Miyoshi G, Shima Y, Fishell G, Nelson SB, Huang ZJ. A resource of Cre driver lines for genetic targeting of GABAergic neurons in cerebral cortex. Neuron. 2011;71:995–1013. doi: 10.1016/j.neuron.2011.07.026. [DOI] [PMC free article] [PubMed] [Google Scholar]
- van Hooft JA, Giuffrida R, Blatow M, Monyer H. Differential expression of group I metabotropic glutamate receptors in functionally distinct hippocampal interneurons. J Neurosci. 2000;20:3544–3551. doi: 10.1523/JNEUROSCI.20-10-03544.2000. [DOI] [PMC free article] [PubMed] [Google Scholar]
- Woodruff A, Xu Q, Anderson SA, Yuste R. Depolarizing effect of neocortical chandelier neurons. Front Neural Circuits. 2009;3:15. doi: 10.3389/neuro.04.015.2009. [DOI] [PMC free article] [PubMed] [Google Scholar]
- Zhou FM, Hablitz JJ. Postnatal development of membrane properties of layer I neurons in rat neocortex. J Neurosci. 1996;16:1131–1139. doi: 10.1523/JNEUROSCI.16-03-01131.1996. [DOI] [PMC free article] [PubMed] [Google Scholar]
- Zsiros V, Maccaferri G. Electrical coupling between interneurons with different excitable properties in the stratum lacunosum-moleculare of the juvenile CA1 rat hippocampus. J Neurosci. 2005;25:8686–8695. doi: 10.1523/JNEUROSCI.2810-05.2005. [DOI] [PMC free article] [PubMed] [Google Scholar]