

Abstract
Objective
The goal of pharmacogenomics is the translation of genomic discoveries to individualized patient care. Recent advances in the means to survey human genetic variation are fundamentally transforming our understanding of the genetic basis of interindividual variation in therapeutic response. The goal of this study was to systematically evaluate high-throughput genotyping technologies for their ability to assay variation in pharmacogenetically important genes (pharmacogenes). These platforms are either being proposed for or are already widely used for clinical implementation; therefore, knowledge of coverage of pharmacogenes on these platforms would serve to better evaluate current or proposed pharmacogenetic association studies.
Method
Among the genes included in our study are drug metabolizing enzymes, transporters, receptors, and drug targets, of interest to the entire pharmacogenetic community. We considered absolute and LD-informed coverage, minor allele frequency spectrum and functional annotation for a Caucasian population. We also examined the effect of linkage disequilibrium, effect size and cohort size on power to detect SNP associations.
Results
In our analysis of 253 pharmacogenes, we found that no platform showed more than 85% coverage of these genes (after accounting for LD). Furthermore the lack of coverage showed a dramatic increase at minor allele frequencies of less than 20%. Even after accounting for LD, only 30% of missense polymorphisms (which are enriched for low frequency alleles) were covered by HapMap with still lower coverage on the other platforms.
Conclusion
We have conducted the first systematic evaluation of the Axiom Genomic Database, Omni 2.5M and the DMET chip. This study is the first to utilize the 1000 Genomes Project to present a comprehensive evaluative framework. Our results provide a much-needed assessment of microarray-based genotyping and next-generation sequencing technologies’ ability to survey fully the variation in genes of particular interest to the pharmacogenetics community. Our findings demonstrate the limitations of genome-wide methods and the challenges of implementing pharmacogenomic tests into the clinical context.
Keywords: Pharmacogenomics, microarray, genotyping, sequencing, coverage, LD, minor allele frequency, SNP function
Introduction
Pharmacogenomics is primarily aimed at identifying genetic variation that influences interindividual differences in drug response and has widespread clinical relevance. Its application promises to enable targeted drug administration, to improve therapeutic outcome, to predict disease risk, and to inform drug development. Pharmacogenomic insights have improved our understanding of the underlying pathways and mechanisms behind adverse drug reactions. Such adverse reactions account for approximately 100,000 deaths per year in the United States (1), and dramatically increase health care cost. Advances made over the last 30 years in molecular biology, molecular medicine and genomics, have had a major impact on the development of pharmacogenomics (2). With the rapid advances in our ability to conduct high-throughput scans of human genetic variation (3) and the consequent deluge of genomic information readily available (4), the promise of personalized medicine is tantalizingly close. However, the relative paucity of guidelines on the appropriate utilization of these resources and the lack of critical appraisal on the advantages and pitfalls of high throughput technology may limit the impact of pharmacogenomics on clinical practice.
To date, most pharmacogenetic association studies have employed a candidate gene approach in which potentially functional single nucleotide polymorphisms (SNPs) in a gene thought to relate to drug response or toxicity are correlated to a phenotype. Such studies have led to clinically important discoveries, such as the use of thiopurine methyltransferase (TPMP) genotyping for the dosing of 6-mercaptopurine (6-MP) and of UDP-glucuronosyltransferase 1A1 (UGT1A1) for the dosing of irinotecan (5). These discoveries have led to the incorporation of pharmacogenetic information into drug labeling by the U.S. Food and Drug Administration (6)(see supplementary Table 1). However, the advent of genome-wide methods and next generation sequencing technology has allowed investigators to more comprehensively assess the contribution of genetic variation to variability in drug response.
Public databases, such as The HapMap Project (www.HapMap.org), hold extensive genotype information in major world populations for genes that affect disease susceptibility and therapeutic outcome. HapMap contains approximately 4 million SNPs in 11 world populations (release #27, Feb. 2009). HapMap is frequently used as the reference SNP set into which many genome-wide association (GWA) studies are imputed. However, the sufficiency of HapMap data relative to full resequence data for pharmacogenomic studies has not been systematically evaluated, especially in light of the complexity of certain pharmacogenetically relevant genes (pharmacogenes). For example, certain members of a pharmacogenetically important gene family (e.g. the P450 CYP genes) lie in highly homologous regions that may complicate their interrogation by high-throughput methods. Furthermore, the less thorough coverage of rarer variation in pharmacogenes may reduce power to detect association in pharmacogenetic studies.
High-throughput genotyping platforms, which can now genotype more than 5 million SNPs, are becoming more common in pharmacogenetic studies. Next generation sequencing (NGS) technology promises to revolutionize pharmacogenomics by enabling genetic studies of drug response phenotypes at unprecedented resolution. Recent pharmacogenetic GWA studies have shown the role of SLCO1B1 variants and statin induced myopathy (7). Other high-profile GWA studies identified the genetic variants associated with warfarin dosing (8–10). The release of the DMET 1.0 SNP chip by Affymetrix aims to fill the gap in pharmacogene coverage by selectively targeting drug metabolism genes. A recent study has shown the utility of the DMET chip with the discovery of SNPs within CYP4F2, associated with warfarin dosing (11). However, questions remain on what proportion of drug-related variation has been captured by these studies.
A systematic analysis of some of the most widely used genotyping platforms (Affymetrix 6.0 array, Illumina Human1M array, Illumina Omni 2.5 M array, DMET array), the new Affymetrix Axiom Genomic Database, as well as of HapMap on the extent of coverage on pharmacogenes using whole-genome sequencing data as a gold standard has never been conducted. The Affymetrix Axiom Genomic Database (http://www.affymetrix.com/support/technical/sample_data/axiom_db/axiomdb_data.affx) was created through a screening pipeline that analyzed millions of SNPs from public databases and putatively novel SNPs. This database was used to construct the predesigned and custom genotyping chip arrays offered by Affymetrix and contains approximately 11 million SNPs. Similarly, Illumina has developed a new generation of genotyping platforms (e.g., Omni 2.5M) that facilitate customization and interrogate many more millions of markers than earlier chips. We, therefore, compiled a list of 253 pharmacogenes, cataloged the genetic variation found in genes based on sequence data from the most recent release of the 1000 Genome Project (12) in the Caucasian population (CEU), and determined the level of coverage investigators may hope to obtain by using either high throughput platforms or SNP selection using CEU HapMap genotype data in pharmacogenetic association studies. We believe our study is highly relevant and timely, as the widespread clinical use of pharmacogenomic testing is being proposed for development and implementation (13).
Methods
Development of Gene List and Genotype Data
Pharmacogenes were chosen using the PharmGKB (http://www.pharmgkb.org/) resource, which has an extensive catalog of genes related to disease risk and drug response, and the FDA website for all genes that have been included in drug label changes. In addition, we supplemented this list to include most members of the relevant drug metabolizing enzyme families and genes included in the Pharmacogenetic Effects Database (http://bidd.cz3.nus.edu.sg/phg/), resulting in 253 genes (supplementary Table 2). While this is certainly not an exhaustive list of all pharmacogenes, we feel it comprises the most important gene classes, including drug metabolizing enzymes, transporters, receptors, and drug targets, of interest to the entire pharmacogenomic community. A similar method was used to compile genes important in pharmacogenetics (14). Analyses were performed on the whole dataset as well as subsets: VIP genes (as defined by PharmGKB), pharmacokinetic genes (PK), and pharmacodynamic genes (PD).
Generating genotypes from 1000 Genomes data
We retrieved 1000 Genomes data (July 2010 release) for the available 57 CEPH Utah (CEU) samples. This data included FASTQ files (15) (containing sequences and single-byte encoded quality scores associated with nucleotides in a sequence), SNP calls (VCF) and Binary Alignment MAP (BAM) files (16) from ftp://ftp-trace.ncbi.nih.gov/1000genomes/, as well as FASTA files for the human genome reference assembly from ftp://ftp.ensembl.org/pub/current_fasta/homo_sapiens/dna/.
We have previously built a technical infrastructure (see http://genemed1.bsd.uchicago.edu/pharmacodb/thougen/architect.php for a description) for investigating important genes using 1000 Genomes data (17). We have extended this resource to the larger list of pharmacologically important genes.
Each 1000 Genomes SNP is mapped to dbSNP (v. 129) to determine if it is a known or novel SNP, and the functional annotations of known SNPs were extracted. SNPs were classified as one of the following: intronic, 3′ or 5′ UTR, splice site, synonymous coding, non-synonymous coding SNPs.
We downloaded rs names and physical positions (build 36) for all HapMap SNPs that fall within or near (+/− 50kb) the genes of interest, and for all SNPs on the genotyping products we investigated (Illumina Human1M BeadChip, Illumina Omni 2.5M, Affymetrix Genome-wide Human SNP Array 6.0, DMET Plus, and Affymetrix Axiom Genomic Database).
Assessing 1000 Genome SNP coverage in HapMap and commercial genotyping platforms
We sought to quantify how well the genetic variation in our pharmacogenes was interrogated using either common SNP genotyping arrays or using SNPs contained in HapMap. We used the genotype data available from the 1000 Genomes project to serve as our reference dataset. For each combination of gene and genotyping platform (Affymetrix 6.0 array, Illumina Human1M array, Illumina Omni 2.5M, DMET array, the Affymetrix Axiom Genomic Database, and HapMap II and III (18)), we determined the rs numbers and positions of each SNP that lay either in or within 50kb of the gene’s transcription start and stop sites. We then determined how well these SNPs tagged the 1000 Genome SNPs for each gene. For a given genotyping platform, we forced the SNPs present on the platform in the gene region to be tag SNPs. Using pairwise tagging, we determined the set of 1000 Genome SNPs that could be tagged by these SNPs at an r2 level of 0.8. We summarized the characteristics of the tagged and directly interrogated SNPs based on minor allele frequency (MAF) and functional annotation. Note, that while we allowed SNPs as much as 50kb outside the gene to be used for tagging, we were not interested in tagging SNPs that were located outside the gene’s transcription boundaries.
The rationale for using an r2 threshold is that in an association study a SNP in high linkage disequilibrium (LD) with the causal variant may be identified even when the true functional variant is not genotyped, and thus acts as a proxy for the causal SNP. When using a genotyping array to interrogate genes of interest, SNPs in the gene along with those near it are tested. In addition, when selecting SNPs to tag a gene, it is common practice to extend SNP picking beyond the gene boundaries until LD has decreased sufficiently to make inference about the location of any associated variant unambiguous. For these reasons, we considered genic SNPs from 1000 Genomes to be tagged if they are either present in the product being considered or in LD at or above the r2 threshold with a SNP in or +/− 50kb the gene’s transcription boundaries. We also tested this assumption in our analysis on power related to effect size and sample size (see Results)
Statistical Analysis
All statistical analysis was conducted in R and Graphpad Prism (Version 5.04). Comparisons between the platforms for each MAF bin were conducted with two-way ANOVA with t-test comparisons between groups within the same MAF.
Results
In this study, we looked at 253 genes to determine how well the 1000 Genomes SNP reference data was covered by HapMap, Illumina Human 1M BeadChip, Illumina Omni 2.5M, Affymetrix Genome-wide Human SNP Array 6.0, the Affymetrix Axiom Genomic Database, and the Affymetrix DMET plus. We assessed coverage both as the percentage of 1000 Genomes SNPs present in each product (absolute coverage), and also as the percentage of 1000 Genomes SNPs that are in at least an r2 threshold of 0.8 with SNPs in each product.
Overall SNP Coverage
Figure 1 shows the percentage of SNPs in 1000 Genomes (both absolute coverage (1A) and coverage after accounting for LD, r2=0.8 (1B)) found in all pharmacogenes and each subset of these genes at different minor allele frequency (MAF) bins for each platform. Because DMET 1.0 platform targeted only a subset of the genes we identified as pharmacogenes, we correct the coverage percentage to only include SNPs found in those genes that DMET targeted, and hence the total SNP count used to calculate both absolute and LD tagged coverage is lower for this platform. In general, all the datasets covered greater percentages of common SNPs as opposed to rare SNPs. Accounting for LD (r2 = 0.8) increased the percentage of SNPs found in all datasets, with the highest percentage of coverage (85%) seen within HapMap. No significant differences in mean coverage of all pharmacogenes exist between HapMap, Illumina 1M and the Axiom platform (absolute or accounting for LD). The Affymetrix 6.0, Omni 2.5 M and the DMET platforms show significantly poorer coverage relative to these other platforms at the higher MAF bins. This pattern holds true for both Affymetrix 6.0 and DMET platforms for the subdivided datasets also, except in the case of the PD genes. In this set, Illumina 1M and Illumina Omni 2.5 M also show significantly lower coverage at higher MAF bins. Regardless of MAF or LD, no platform showed above 85% coverage of SNPs found in the 1000 Genomes data.
Figure 1. Percentage of SNP coverage by platform.

The plots show the A) absolute and B) LD-informed coverage of SNPs (using r2 level of 0.8) found in each platform as a percentage of the SNPs found in 1000G. The first row shows all pharmacogenes, while the subsequent rows show subsets of these genes.
In terms of absolute and LD-informed coverage per gene, Figure 2 shows a heat map plot of each platform for the genic region of the PharmGKB VIP genes. After accounting for LD tagging in the extended 50kB region, both Axiom and HapMap have approximately 20% of all pharmacogenes covered at 70% or greater. Excluding the DMET array (which does not have genome-wide coverage), the proportion of 253 genes with no SNPs found on the platform after accounting for extended LD are: 13%, 8%, 6%, 5%, and 5%, for Affymetrix 6.0, Axiom, HapMap, Illumina 1M, and Omni 2.5M respectively. A list of these genes can be found in the supplemental material.
Figure 2. Heat plot of the absolute and LD-informed coverage in the VIP Genes.
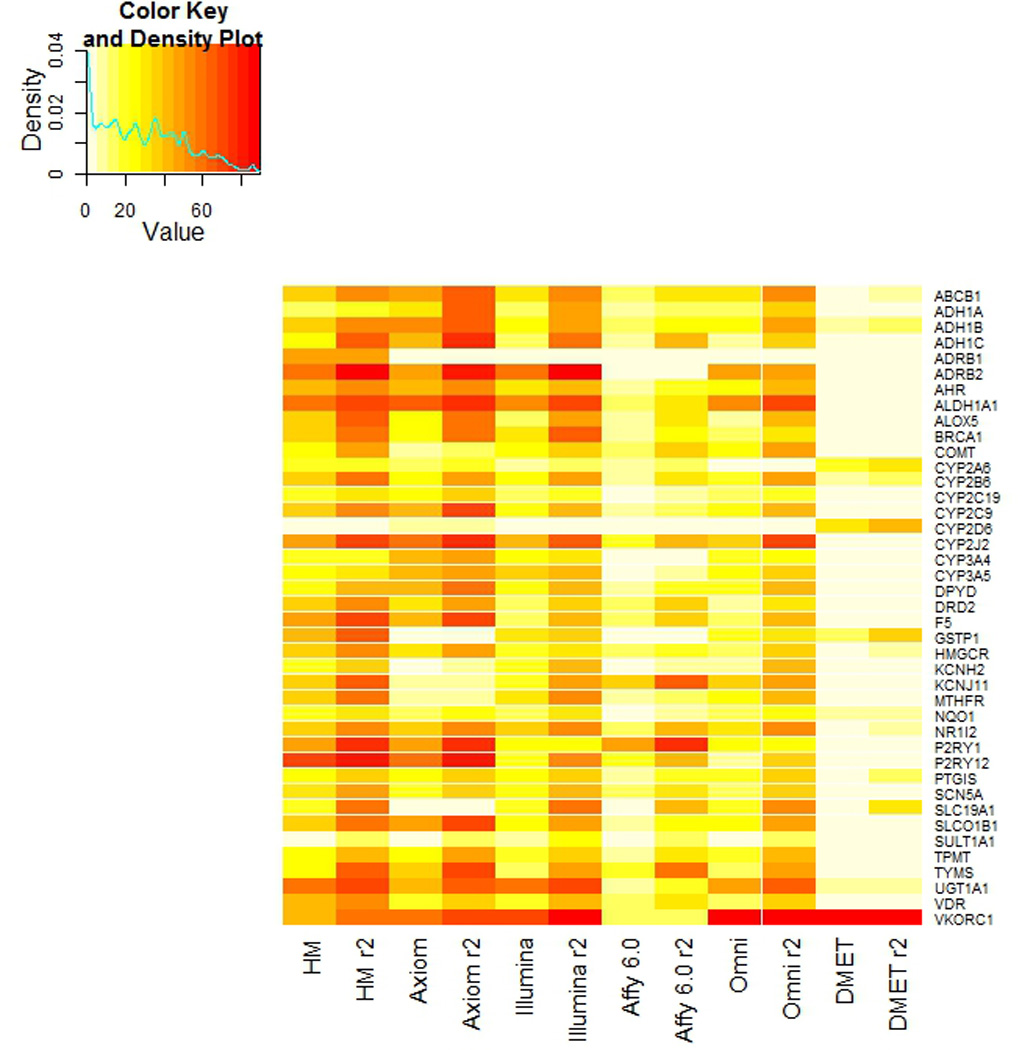
The heat plot shows both the both the absolute and LD-informed coverage of the PharmGKB VIP genes.
Figure 3 shows the distribution of coverage for each platform. By accounting for LD, the frequency distribution shifts to increased coverage, so that many genes are above 70% coverage. However even after accounting for LD, Axiom (which showed the greatest shift in the coverage distribution) has only 72 (of 253) genes that are above the 70% threshold in coverage.
Figure 3. Histograms of percentage of coverage for each platform.

Each graph shows the number of genes at specific percent coverage bins for each platform. Each graph also shows the change in distribution once we account for LD.
Coverage by SNP annotation
SNP coverage assessed by SNP annotation (Figure 4) shows that the highest absolute and LD-informed coverage is found in intronic variants (except in the case of DMET and Illumina 1M), with HapMap showing the greatest coverage in all annotation classes. No single annotation class showed over 80% coverage, with coding variation showing the lowest coverage of any class (except in the case of DMET). Even after accounting for LD, only 30% of missense polymorphisms (which are enriched for low frequency alleles) were covered by HapMap with still lower coverage on the other platforms.
Figure 4. Coverage of each platform by gene annotation.

Power to detect associations in pharmacogenes
While differences in coverage of the pharmacogenes exist between platforms, it is possible that such differences may not necessarily translate into differences in power to detect causal variants of different effect sizes. Furthermore, the use of a predefined and arbitrary threshold for LD (in this case, 0.8) implies that a SNP that is in lower LD with a tag SNP would not be detectable even if an association may indeed be detectable, though at lower power. Thus, in addition to coverage, the power of a set of tag SNPs (e.g., as provided by each platform), defined as the probability of finding a statistically significant association given that it exists, may be evaluated for a given study, and the performance of the various platforms may thus be compared.
Consider the case in which a single SNP, in LD r2 with the causative SNP, is typed. For disease model (or in pharmacogenetic studies, this would be equivalent to a drug response phenotype or a dichotomous side effect phenotype), we assume that risk varies additively (on the log scale) with the number of instances of the risk allele. We further assume the same number N of cases and controls in the study. Let p be the frequency of the causal allele in the population (thus, also in controls, approximately). The allele frequency pc in cases is given by:
where γ is the increase in relative risk with each copy of the causal allele. The causal allele frequency p* in the sample set, given the equal number of cases and controls, is given by:
The non-centrality parameter for a one-degree of freedom test of allelic association provides the power for a SNP.
Thus, the power is a function of the parameter N (in our case, equal to the number of cases or controls), the allele frequency p, and the effect size γ.
Several consequences are immediately evident from the expression for power. First, assuming the same effect size and causal allele frequency, the number of (control or case) samples N required in order to detect an indirect association (r2) with equal power as a study that requires Ndirect number of (control of case) samples to detect a direct association is given by the following expression (as has been previously established (19)):
Second, if the following expression (hereafter designated as “power term”)
is large (e.g., much greater than 100/0.8), the power (e.g., corresponding to power term = 100) to detect an association may be obtained with a lower LD than 0.8 between causal SNP and tag SNP. We note, however, that for a fixed size N and (causal) allele frequency p, the coverage (as measured by r2) is the single determinant of power to detect the association.
Using the observed minor allele frequency for SNPs identified by the 1000 Genomes Project and annotated to our pharmacogenes, figure 5A and B shows the power to detect an association from the relationship between the power term (as defined above) and minor allele frequency at different sample sizes and effect sizes. As illustrated by figure 5A, the gain in power from increasing the effect size may reach an optimum that depends on the MAF of the causal SNP (see the optimal difference in the power term near MAF = 0.20 between OR=3 and OR=10). Furthermore, the minor allele frequency of the causal SNP must increase from 0.05 to 0.08 to be detected by a proxy SNP at the r2 threshold of 0.80 (at OR=3); the two horizontal lines show the power term at 100 and at 125, representing the change in r2 (from 1, indicating perfect LD, to 0.8) between the proxy SNP and causal variant. Figure 5B shows the resulting change in power from a change in sample size (from N=1000 to 2000, for OR=3) as a function of the MAF of the causal SNP.
Figure 5.
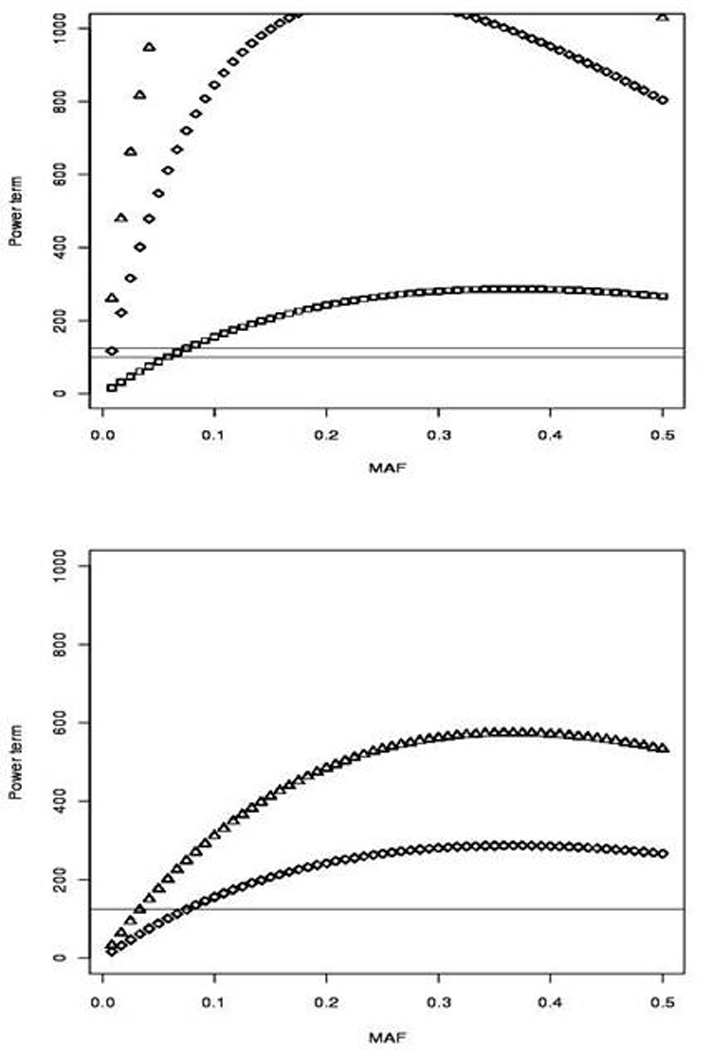
Effect of sample size (N) and causal variant effect size on power to detect an association in pharmacogenes. Panel A illustrates the increase in power from an increase in effect size (shown here are OR = 3, 10, and 20) at various MAF (calculated using the SNPs annotated to pharmacogenes in our study). Panel B shows the gain in power from an increase in sample size (N=1000 to N=2000, OR=3). The y axis is given by the power term (defined as the non-centrality parameter divided by r2).
Discussion
Currently, pharmacogenomic association studies have begun to rely more heavily on commercial SNP genotyping platforms to find novel associations. While GWA methods allow for unbiased evaluation of the entire genome, many of the genotyping platforms available do not provide uniform coverage of all chromosomes or chromosomal regions (20). In addition, several candidate gene studies have used HapMap as a resource to obtain tagging SNPs to comprehensively evaluate genetic variation in genes of interest (21) and HapMap is routinely used as the SNP set into which many GWA studies are imputed.. Therefore, evaluating which HapMap and high-throughput genotyping platforms contain sufficient genotypic information to successfully capture all the variation found in resequencing data for pharmacogenes, would provide investigators with much needed knowledge of coverage. This question is of utmost importance in pharmacogenetic association studies in which (both candidate gene and genome-wide) associated SNPs may be a proxy for the true causal variant (22, 23). However, if the platforms cannot sufficiently capture the variation in these genes, we may fail to identify some of the causative variants that influence the phenotype.
Previous studies have explored the coverage of different genotyping platforms to HapMap phase I and II data (24) and dbSNP. Evaluating the coverage of genotyping platforms to HapMap as the reference source, investigators found that approximately 80–90% of the SNPs in HapMap CEU population were covered in these platforms at an r2 of 0.8. Similar results were obtained when using dbSNPs data as the references source (25–27). These studies showed that the Illumina Hap550 BeadChip showed consistently higher coverage than the Affymetrix 500K chip. Pharmacogenetic genes in particular have also been evaluated either as a handful of genes (28) or as SNPs deemed functional for coverage on genotyping platforms (29). Tantoso et al. compared the coverage of genes in HapMap to coverage in the National Institute of Environmental Health Sciences resequencing database (NIEHS SNPs) and found that 55% of the CEU sequence variants were present or tagged by HapMap. Peters et al. found that 73% of the SNPs listed as VIP SNPs in the PharmGKB database were assessed either directly or indirectly (r2 of 0.8) by the DMET genotyping platform and outperformed both the Illumina 1M and the Affymetrix 6.0 chip in terms of both direct and indirect coverage. While this study did not account for all the variation in these genes, it does bring to light the failure of the higher density SNP chips and HapMap to cover regions of high sequence homology such as seen in drug metabolizing enzyme gene families. Li et al. investigated 1594 pharmacogenetic genes for coverage (using HapMap as the reference) and found that only 25% of these genes had greater than 80% coverage of known SNPs (20). Our study showed an even lower number of genes with adequate coverage, with no more than 9% of our pharmacogenes with greater than 80% coverage on any of the platforms evaluated. As expected, most of the loss of SNP coverage (both in our study and those referenced) was seen at the rarer MAF bins (e.g., MAF < 0.05), with increased coverage after accounting for LD. Given that the goal of HapMap was to catalog common genetic variation (MAF ≥ 0.05), we would not expect exceptional coverage at low MAFs. However even after accounting for LD, no platform showed greater than approximately 85% of common variation. Since we did not reach this level of coverage until a MAF of 20%, much of what we would consider common variation would not be accounted for on these platforms.
Differences in the coverage of pharmacogenes by high-throughput platforms may not necessarily result in differences in power to detect causal variants of different effect sizes. Thus, we investigated the power to detect an association given our assumption of an r2 threshold (i.e., 0.8) as well as the effect size and minor allele frequency of the causative SNP. Figure 5 illustrates the impact of increased effect size or increased sample size on the power to detect a causal SNP. In particular, the figure demonstrates that detecting an association (with the same level of power using a hypothesized tag SNP in perfect LD with the causal SNP) at the given r2 threshold of 0.8 may be achieved at a required MAF for a proxy SNP that decreases with increased effect size. While pharmacogenetic GWA studies are known for their large effect sizes (30, 31), these are more commonly seen with rare alleles. For example, the association of Steven-Johnson Syndrome and carbamazepine with the HLA-A*3101 allele was found at OR = 26 (32). However, the MAF of the HLA-A*3101 allele is approximately 0.02 in the study population making the study underpowered for detection with a proxy SNP at an r2 of less than 0.8, even at this very large effect. Most pharmacogenetic studies show an effect size between 3 and 5, which, from our power analyses, would likely require a proxy SNP to be in LD of at least 0.8 to be detected. An example of such an association in pharmacogenomics is clopidogrel response associated with the CYP2C19*2 allele. This association has an effect size of approximately 3 (33) and was first detected in an Amish cohort which identified a proxy SNP to CYP2C19*2 in a GWA study (34). This proxy SNP was at LD of 0.87 with the causative allele. Given the MAF of CYP2C19*2 in the Amish populations (0.17), this association could only be found with a proxy SNP in LD of 0.8 of greater. It should be noted that both these associations have led to changes in the drug labels of the corresponding drugs and represent truly translational pharmacogenomics.
Figure 5B shows the impact of a change in sample size (from N=1000 to 2000) on power. However, it must be noted that many pharmacogenomic association studies have relatively small sample sizes (as compared to disease association studies). Under the assumption of a smaller sample size, detecting the causative SNP in a pharmacogene would require coverage of the SNP on the GWAs platform, sequencing of the gene or imputing to the 1000 Genomes dataset.
We considered a gene family that is particularly important in pharmacogenomics, CYP2C to demonstrate the coverage of different platforms for a gene family. Table 1 shows the total coverage for the CYP2C gene family. CYP2C8 has the highest coverage of the four members, with CYP2C19 having the lowest coverage Of note, variation in CYP2C19 was found to significantly affect response to clopidogrel (34) while variation in CYP2C9 has been associated in several studies with warfarin dose requirements (8, 9, 35). It is thought that the CYP2C enzymes metabolize 30% of all therapeutic drugs. (36) Therefore, this lack of coverage could result in missing important findings with broad pharmacogenetic implications. While coding SNPs have been implicated in the pharmacogenetic associations reported for these two genes, complete understanding of the regulatory mechanisms is lacking. Therefore, extensive coverage of pharmacogenes is imperative to comprehensively access genetic association. One possibility for the lower coverage of CYP2C9 may be its high sequence similarity with CYP2C19 (37), resulting in difficulty in the design of gene-specific probes. Of particular interest to our laboratory is the role of genetic variation in CYP2C9 and VKORC1 in warfarin dose requirement. We recently found a novel allele in VKORC1 that is not interrogated by any high throughput platform (even after accounting for LD) and is not in HapMap (38). Therefore, this association would not have been found if we had not employed a sequence-based investigation.
Table 1.
Coverage Percentage of the CYP2C gene family across platforms (LD-informed coverage)
| Gene | HapMap | Illumina 1M | Axiom | Affymetrix 6.0 |
DMET | Omni 2.5 |
|---|---|---|---|---|---|---|
| CYP2C9 | 56.1 | 41.7 | 68.3 | 11.5 | 5.0 | 43.2 |
| CYP2C19 | 31.6 | 22.4 | 34.1 | 7.1 | 4.1 | 21.9 |
| CYP2C8 | 70.3 | 53.7 | 77.8 | 35.2 | 5.6 | 50.9 |
| CYP2C18 | 42.9 | 47.6 | 56.3 | 15.1 | 5.6 | 39.7 |
We identified three genes (GSTM1, UGT2B15 and SULT1A1) that showed no variant in the 1000 Genomes data. Upon further evaluation, these genes contained copy number variations (CNVs) which overlap the transcriptional and regulatory regions of the pharmacogenes (39). GSTM1 contains a single low-frequency intronic SNP (rs10857796) in HapMap CEU. Our findings confirm that the proximal presence of CNVs may dramatically limit the detection of SNPs in pharmacogenes by high-throughput methods (both next-generation sequencing and genotyping platforms). Human Uridine 5'-diphosphate-glucuronosyltransferases (UGTs) play important roles in drug metabolism and the preservation of homeostasis of endogenous compounds. Given the importance of these genes in drug clearance, other methods, such as deep resequencing in a candidate gene approach, will be necessary to evaluate variation in these genes.
It is interesting to note that the Axiom database which contains considerably more SNPs than any other high-throughput genotyping platform has approximately the same percent coverage of the pharmacogenes as both HapMap and Illumina 1M. In addition, this database was enriched for low frequency alleles from the 1000 Genomes Project. However, no such enrichment can be seen in the pharmacogenes, with the Axiom database showing the same coverage as HapMap (a database designed to capture common variation) at these low MAFs (figure 1).
One technique to increase the statistical power of GWA studies is the use of functional annotation as prior information on the potential importance of SNP variants (40). As our findings have shown, while the incorporation of such a priori information in the design of association studies may indeed increase power, the approach may be inadequate to capture a majority of the genetic variation in pharmacogenes.
The use of results from high-throughput sequencing, particularly the low-coverage analysis panel from the 1000 Genomes Project, may raise the question of genotype accuracy. Nevertheless, it has been shown that an efficient approach to novel variant discovery may be achieved by sequencing many samples at low-coverage and utilizing shared haplotype information (41). Conditional on the total amount of sequencing, the number of variants identified is greater when using low-coverage sequencing of many samples rather than high-coverage sequencing of a few genomes (12). One limitation to our study, which restricted the analysis to a relative small number of genes, is that it is not clear how the results reported here may extend to all known genes in the genome. However, we chose to focus on a set of genes we believe to be most important in pharmacogenomics and personalized medicine; we feel that this information will be useful to those specifically interested in pharmacogenomic evaluation of genetic data. Furthermore, our study utilizes an approach that can be extended to the rest of the genes in the genome and suggests that genome-wide pharmacogenetic studies utilizing high-throughput platforms may bias results towards regions in the genome that are relatively better interrogated.
Our findings strongly support the thesis that GWA studies alone are unlikely to be able to fully evaluate a gene’s contributions to drug response. The current prevailing wisdom is that GWA studies as an unbiased approach may identify the genes of interest, and follow-up deep resequencing may then be used to find the causal variants. However, if the causative gene is poorly interrogated on the genome-wide platform, we are likely to miss important associations. In fact, the search for causative variation in pharmacogenomic phenotypes may ultimately require genome-wide, candidate gene and copy number studies as well as imputation to a reference sequence data (e.g., 1000 Genomes) to adequately survey all genetic variation in pharmacogenes.
Supplementary Material
Acknowledgments
We would like to acknowledge Dr. Nancy J. Cox for her continued support as well as the following grant from the NIH NHLBI award (1 K23 HL089808-01A2) to M.P.
Footnotes
Publisher's Disclaimer: This is a PDF file of an unedited manuscript that has been accepted for publication. As a service to our customers we are providing this early version of the manuscript. The manuscript will undergo copyediting, typesetting, and review of the resulting proof before it is published in its final citable form. Please note that during the production process errors may be discovered which could affect the content, and all legal disclaimers that apply to the journal pertain.
Conflicts of Interest: none declared.
REFERENCES
- 1.Lazarou J, Pomeranz BH, Corey PN. Incidence of adverse drug reactions in hospitalized patients: a meta-analysis of prospective studies. Jama. 1998;279:1200–1205. doi: 10.1001/jama.279.15.1200. [DOI] [PubMed] [Google Scholar]
- 2.Vesell ES, Page JG. Genetic control of drug levels in man: antipyrine. Science. 1968;161:72–73. doi: 10.1126/science.161.3836.72. [DOI] [PubMed] [Google Scholar]
- 3.Venter JC, et al. The sequence of the human genome. Science. 2001;291:1304–1351. doi: 10.1126/science.1058040. [DOI] [PubMed] [Google Scholar]
- 4.Marsh S, Kwok P, McLeod HL. SNP databases and pharmacogenetics: great start, but a long way to go. Hum Mutat. 2002;20:174–179. doi: 10.1002/humu.10115. [DOI] [PubMed] [Google Scholar]
- 5.Innocenti F, et al. Genetic variants in the UDP-glucuronosyltransferase 1A1 gene predict the risk of severe neutropenia of irinotecan. J Clin Oncol. 2004;22:1382–1388. doi: 10.1200/JCO.2004.07.173. [DOI] [PubMed] [Google Scholar]
- 6.FDA, U. [Accessed October 2011];Table of Pharmacogenomic Biomarkers in Drug Labels. 2011 < http://wwwfdagov/drugs/scienceresearch/researchareas/pharmacogenetics/ucm083378htm>.
- 7.Link E, et al. SLCO1B1 variants and statin-induced myopathy--a genomewide study. N Engl J Med. 2008;359:789–799. doi: 10.1056/NEJMoa0801936. [DOI] [PubMed] [Google Scholar]
- 8.Cooper GM, et al. A genome-wide scan for common genetic variants with a large influence on warfarin maintenance dose. Blood. 2008;112:1022–1027. doi: 10.1182/blood-2008-01-134247. [DOI] [PMC free article] [PubMed] [Google Scholar]
- 9.Takeuchi F, et al. A genome-wide association study confirms VKORC1, CYP2C9, and CYP4F2 as principal genetic determinants of warfarin dose. PLoS Genet. 2009;5:e1000433. doi: 10.1371/journal.pgen.1000433. [DOI] [PMC free article] [PubMed] [Google Scholar]
- 10.Teichert M, et al. Genotypes associated with reduced activity of VKORC1 and CYP2C9 and their modification of acenocoumarol anticoagulation during the initial treatment period. Clin Pharmacol Ther. 2009;85:379–386. doi: 10.1038/clpt.2008.294. [DOI] [PubMed] [Google Scholar]
- 11.Caldwell MD, et al. CYP4F2 genetic variant alters required warfarin dose. Blood. 2008;111:4106–4112. doi: 10.1182/blood-2007-11-122010. [DOI] [PMC free article] [PubMed] [Google Scholar]
- 12.A map of human genome variation from population-scale sequencing. Nature. 2010;467:1061–1073. doi: 10.1038/nature09534. [DOI] [PMC free article] [PubMed] [Google Scholar]
- 13.Crews KR, et al. Development and implementation of a pharmacist-managed clinical pharmacogenetics service. Am J Health Syst Pharm. 2011;68:143–150. doi: 10.2146/ajhp100113. [DOI] [PMC free article] [PubMed] [Google Scholar]
- 14.Huang RS, et al. Identification of genetic variants and gene expression relationships associated with pharmacogenes in humans. Pharmacogenet Genomics. 2008;18:545–549. doi: 10.1097/FPC.0b013e3282fe1745. [DOI] [PMC free article] [PubMed] [Google Scholar]
- 15.Cock PJ, Fields CJ, Goto N, Heuer ML, Rice PM. The Sanger FASTQ file format for sequences with quality scores, and the Solexa/Illumina FASTQ variants. Nucleic Acids Res. 38:1767–1771. doi: 10.1093/nar/gkp1137. [DOI] [PMC free article] [PubMed] [Google Scholar]
- 16.Li H, et al. The Sequence Alignment/Map format and SAMtools. Bioinformatics. 2009;25:2078–2079. doi: 10.1093/bioinformatics/btp352. [DOI] [PMC free article] [PubMed] [Google Scholar]
- 17.Gamazon ER, Zhang W, Huang RS, Dolan ME, Cox NJ. A pharmacogene database enhanced by the 1000 Genomes Project. Pharmacogenet Genomics. 2009;19:829–832. doi: 10.1097/FPC.0b013e3283317bac. [DOI] [PMC free article] [PubMed] [Google Scholar]
- 18.Frazer KA, et al. A second generation human haplotype map of over 3.1 million SNPs. Nature. 2007;449:851–861. doi: 10.1038/nature06258. [DOI] [PMC free article] [PubMed] [Google Scholar]
- 19.Pritchard JK, Przeworski M. Linkage disequilibrium in humans: models and data. Am J Hum Genet. 2001;69:1–14. doi: 10.1086/321275. [DOI] [PMC free article] [PubMed] [Google Scholar]
- 20.Li M, Li C, Guan W. Evaluation of coverage variation of SNP chips for genome-wide association studies. Eur J Hum Genet. 2008;16:635–643. doi: 10.1038/sj.ejhg.5202007. [DOI] [PubMed] [Google Scholar]
- 21.Dardiotis E, et al. Angiotensin-converting enzyme tag single nucleotide polymorphisms in patients with intracerebral hemorrhage. Pharmacogenet Genomics. 21:136–141. doi: 10.1097/FPC.0b013e328343ab15. [DOI] [PubMed] [Google Scholar]
- 22.Carlson CS, Eberle MA, Kruglyak L, Nickerson DA. Mapping complex disease loci in whole-genome association studies. Nature. 2004;429:446–452. doi: 10.1038/nature02623. [DOI] [PubMed] [Google Scholar]
- 23.Wang WY, Barratt BJ, Clayton DG, Todd JA. Genome-wide association studies: theoretical and practical concerns. Nat Rev Genet. 2005;6:109–118. doi: 10.1038/nrg1522. [DOI] [PubMed] [Google Scholar]
- 24.Gunderson KL, Kuhn KM, Steemers FJ, Ng P, Murray SS, Shen R. Whole-genome genotyping of haplotype tag single nucleotide polymorphisms. Pharmacogenomics. 2006;7:641–648. doi: 10.2217/14622416.7.4.641. [DOI] [PubMed] [Google Scholar]
- 25.Brugts JJ, et al. The rationale and design of the PERindopril GENEtic association study (PERGENE): a pharmacogenetic analysis of angiotensin-converting enzyme inhibitor therapy in patients with stable coronary artery disease. Cardiovasc Drugs Ther. 2009;23:171–181. doi: 10.1007/s10557-008-6156-1. [DOI] [PubMed] [Google Scholar]
- 26.Wilkening S, Chen B, Bermejo JL, Canzian F. Is there still a need for candidate gene approaches in the era of genome-wide association studies? Genomics. 2009;93:415–419. doi: 10.1016/j.ygeno.2008.12.011. [DOI] [PubMed] [Google Scholar]
- 27.Lin KM, et al. CYP1A2 genetic polymorphisms are associated with treatment response to the antidepressant paroxetine. Pharmacogenomics. 11:1535–1543. doi: 10.2217/pgs.10.128. [DOI] [PubMed] [Google Scholar]
- 28.Tantoso E, Yang Y, Li KB. How well do HapMap SNPs capture the untyped SNPs? BMC Genomics. 2006;7:238. doi: 10.1186/1471-2164-7-238. [DOI] [PMC free article] [PubMed] [Google Scholar]
- 29.Peters EJ, McLeod HL. Ability of whole-genome SNP arrays to capture 'must have' pharmacogenomic variants. Pharmacogenomics. 2008;9:1573–1577. doi: 10.2217/14622416.9.11.1573. [DOI] [PubMed] [Google Scholar]
- 30.Nelson MR, et al. Genome-wide approaches to identify pharmacogenetic contributions to adverse drug reactions. Pharmacogenomics J. 2009;9:23–33. doi: 10.1038/tpj.2008.4. [DOI] [PubMed] [Google Scholar]
- 31.Daly AK. Genome-wide association studies in pharmacogenomics. Nat Rev Genet. 2010;11:241–246. doi: 10.1038/nrg2751. [DOI] [PubMed] [Google Scholar]
- 32.McCormack M, et al. HLA-A*3101 and carbamazepine-induced hypersensitivity reactions in Europeans. The New England journal of medicine. 2011;364:1134–1143. doi: 10.1056/NEJMoa1013297. [DOI] [PMC free article] [PubMed] [Google Scholar]
- 33.Zabalza M, et al. Meta-analyses of the association between cytochrome CYP2C19 loss- and gain-of-function polymorphisms and cardiovascular outcomes in patients with coronary artery disease treated with clopidogrel. Heart. 2011 doi: 10.1136/hrt.2011.227652. [DOI] [PubMed] [Google Scholar]
- 34.Shuldiner AR, et al. Association of cytochrome P450 2C19 genotype with the antiplatelet effect and clinical efficacy of clopidogrel therapy. Jama. 2009;302:849–857. doi: 10.1001/jama.2009.1232. [DOI] [PMC free article] [PubMed] [Google Scholar]
- 35.Klein TE, et al. Estimation of the warfarin dose with clinical and pharmacogenetic data. N Engl J Med. 2009;360:753–764. doi: 10.1056/NEJMoa0809329. [DOI] [PMC free article] [PubMed] [Google Scholar]
- 36.Rokitta D, Fuhr U. Comparison of enzyme kinetic parameters obtained in vitro for reactions mediated by human CYP2C enzymes including major CYP2C9 variants. Curr Drug Metab. 2010;11:153–161. doi: 10.2174/138920010791110872. [DOI] [PubMed] [Google Scholar]
- 37.Redlich G, et al. Distinction between human cytochrome P450 (CYP) isoforms and identification of new phosphorylation sites by mass spectrometry. J Proteome Res. 2008;7:4678–4688. doi: 10.1021/pr800231w. [DOI] [PubMed] [Google Scholar]
- 38.Perera MA, et al. The Missing Association: Sequencing-Based Discovery of Novel SNPs in VKORC1 and CYP2C9 That Affect Warfarin Dose in African Americans. Clin Pharmacol Ther. 2011;89:408–415. doi: 10.1038/clpt.2010.322. [DOI] [PMC free article] [PubMed] [Google Scholar]
- 39.Gamazon ER, Huang RS, Dolan ME, Cox NJ. Copy number polymorphisms and anticancer pharmacogenomics. Genome Biol. 2011;12:R46. doi: 10.1186/gb-2011-12-5-r46. [DOI] [PMC free article] [PubMed] [Google Scholar]
- 40.Eskin E. Increasing power in association studies by using linkage disequilibrium structure and molecular function as prior information. Genome research. 2008;18:653–660. doi: 10.1101/gr.072785.107. [DOI] [PMC free article] [PubMed] [Google Scholar]
- 41.Le SQ, Durbin R. SNP detection and genotyping from low-coverage sequencing data on multiple diploid samples. Genome research. 2011;21:952–960. doi: 10.1101/gr.113084.110. [DOI] [PMC free article] [PubMed] [Google Scholar]
Associated Data
This section collects any data citations, data availability statements, or supplementary materials included in this article.