Abstract
Background:
This paper describes an environmentally friendly (“green”) approach for the synthesis of soluble graphene using Bacillus marisflavi biomass as a reducing and stabilizing agent under mild conditions in aqueous solution. In addition, the study reported here investigated the cytotoxicity effects of graphene oxide (GO) and bacterially reduced graphene oxide (B-rGO) on the inhibition of cell viability, reactive oxygen species (ROS) generation, and membrane integrity in human breast cancer cells.
Methods:
The reduction of GO was characterized by ultraviolet–visible spectroscopy. Size distribution was analyzed by dynamic light scattering. Further, X-ray diffraction and high-resolution scanning electron microscopy were used to investigate the crystallinity of graphene and the morphologies of prepared graphene, respectively. The formation of defects further supports the bio-functionalization of graphene, as indicated in the Raman spectrum of B-rGO. Surface morphology and the thickness of the GO and B-rGO were analyzed using atomic force microscopy, while the biocompatibility of GO and B-rGO were investigated using WST-8 assays on MCF-7 cells. Finally, cellular toxicity was evaluated by ROS generation and membrane integrity assays.
Results:
In this study, we demonstrated an environmentally friendly, cost-effective, and simple method for the preparation of water-soluble graphene using bacterial biomass. This reduction method avoids the use of toxic reagents such as hydrazine and hydrazine hydrate. The synthesized soluble graphene was confirmed using various analytical techniques. Our results suggest that both GO and B-rGO exhibit toxicity to MCF-7 cells in a dose-dependent manner, with a dose > 60 μg/mL exhibiting obvious cytotoxicity effects, such as decreasing cell viability, increasing ROS generation, and releasing of lactate dehydrogenase.
Conclusion:
We developed a green and a simple approach to produce graphene using bacterial biomass as a reducing and stabilizing agent. The proposed approach confers B-rGO with great potential for various biological and biomedical applications.
Keywords: Bacillus marisflavi, graphene oxide, reduced graphene oxide, ultraviolet–visible spectroscopy, Raman spectroscopy
Introduction
Graphene, a carbon material with many potential applications due to its unique features, consists of a single-layer sp2-hybridized carbon atom network that is also compacted in a perfect honeycomb lattice.1 This unique chemical structure gives graphene excellent electrical, mechanical, and optical properties, thus attracting much commercial and academic research interest.2 As such, many synthetic strategies have been developed to make large quantities of high-quality graphene in a cost-effective manner.3 It was originally produced using micromechanical cleavage,4 but the large-scale production of graphene by this conventional method is rather difficult. Several approaches, including chemical vapor deposition, epitaxial growth, and chemical exfoliation have since been developed for the high-yield synthesis of high-quality graphene.5 The chemical methods have the advantage of large-scale production and are cost-effective, but are not compatible with large-scale synthesis in solution-processable form and require expensive high-temperature processes.5–7 Thus, chemical oxidation and reduction methods have been considered promising approaches for the synthesis of graphene from graphene oxide (GO).8
The chemical oxidation and reduction methods involve two steps: first, the exfoliation of graphite by oxidative treatment, then the reduction of the resulting GO using a suitable reducing agent. The reduction of GO is generally achieved using either reducing agents – such as hydrazine or one of its derivatives, sodium borohydride, hydroquinone, or a sulfur compound – or by hydrothermal and solvothermal protocols.9,10 Most reducing agents are either toxic or explosive as well as difficult to handle for large-scale production. However, strong and toxic reduction agents and surfactants are essential to reduce GO fully in an aqueous phase.11 To solve this problem, many researchers have attempted to develop a new aqueous and environmentally friendly reduction strategy; these have included methods involving bacterial respiration,12 polyallylamine,13 potassium hydroxide,14 polyvinylpyrrolidone,15 ascorbic acid,16 sugar,17 baker’s yeast,18 melatonin,19 and glucose.20 Among the various nontoxic reduction agents, biomass has significant advantages because proteins can be used as reducing agents for the synthesis of graphene. Recently, Escherichia coli biomass was used as a reducing agent for GO.21
The toxicity of any fabricated nanomaterial is very important and because graphene-based nanomaterials are currently considered one of the most important nanomaterials for biomedical applications, several groups have recently investigated the toxicity and biocompatibility of graphene in relation to various cell types including bacteria. Akhavan and Ghaderi,22 for example, reported the interaction of the extremely sharp edges of graphene sheets with the cell wall membrane of bacteria, and the cytotoxicity of graphene in neural pheochromocytoma-derived PC12 cells through the generation of reactive oxygen species (ROS) by the graphene.23 Akhavan et al24 demonstrated a possible mechanism for the cytotoxicity of graphene sheets, in which the cells within the graphene sheets were aggregated. Liu et al25 proposed a membrane stress caused by direct contact with sharp nanosheets and also reported that graphene-based papers can inhibit the growth of bacteria but with minimal cytotoxicity.26 The cytotoxicity of graphene is also dose dependent.23,27 In a systematic study carried out by Chang et al,28 the authors determined that the loss of viability is dependent on size (Iarge-GO, medium-GO, and small-GO) and concentration of GO as well as the length of time cells are exposed to graphene materials. Zhang et al29 studied the distribution and biocompatibility of GO in mice and found that GO was predominantly deposited in the lungs, where it was retained for a long time. Compared with other carbon nanomaterials, GO exhibited a long blood circulation time and low uptake in the reticuloendothelial system. Recently, Akhavan et al30 demonstrated the size-dependent cyto and genotoxic effects of the Reduced graphene oxide nanoplatelets (rGONPs) on human mesenchymal stem cells.
Thus, as many of the currently available methods for producing graphene are not environmentally friendly, complicated, and require additional steps in the preparation process that restrict their applications in biological and biomedical fields,31 we developed a novel, cost-effective, simple, environmentally friendly approach to produce water-soluble graphene. Further, we examined the toxicity of the biologically reduced graphene oxide (B-rGO) in MCF-7 cells.
Methods and materials
Chemicals and bacteria
Graphite powder was purchased from Sigma-Alrich (St Louis, MO, USA). Analytical-grade NaOH, KMnO4, N,N-Dimethylacetamide, anhydrous ethanol, 98% H2SO4, 36% HCl, and 30% H2O2 aqueous solution were purchased from Sigma-Alrich and used directly without further purification. All aqueous solutions were prepared with deionized water. All other chemicals were also purchased from Sigma-Aldrich unless stated otherwise. Bacillus marisflavi GS3 (GenBank accession number, KC KC008578) was obtained from the GS Center for Life Sciences, Coimbatore, India.
Preparation of biomass
Media preparation and growth of bacteria were undertaken according to the methods described by Gurunathan et al.32 In brief, the pre-culture (10 mL of medium in a 50 mL flask) was inoculated with a single colony of B. marisflavi in nutrient broth medium and incubated on a rotary shaker at 37°C for 12 hours. The second pre-cultures were inoculated with the first pre-culture (1% v/v) and incubated on a rotary shaker at 37°C for 12 hours in 150 mL of batch medium in 500 mL shake flasks. Cells (200 mg) were harvested by centrifugation and resuspended in 20 mL of water. The biomass obtained was thrice washed with phosphate buffer (pH 7.0) then collected and stored in a 50 mL tube until required for use in synthesis of reduced graphene.
GO synthesis
GO was prepared from graphite powder using a modified version of Hummers and Offeman’s method.33,34 Graphite powder (2 g) was mixed with 80 mL H2SO4 and 20 mL HNO3 in an ice bath. KMnO4 12 g) was slowly added to the mixture. The solution was heated at 35°C for 30 minutes, then diluted with 160 mL of 18 MΩ water. After 1 hour, the solution was further diluted by adding an additional 400 mL of 18 MΩ water, followed by the slow addition of 12 mL of H2O2 (30% v/v). After these steps, the original black graphite suspension had been converted into a bright yellow graphite oxide solution. The precipitate of graphite oxide was isolated by centrifugation at 3000 rpm/minutes for 15 minutes then washed with, and resuspended in, 18 MΩ water. The aqueous graphite oxide solution was then sonicated for 2 hours to facilitate the exfoliation of stacked graphite oxide sheets into monolayer or multi-layered GO sheets. The as-prepared GO yellow-brown solution (mg/mL) was used for further experiments.
Synthesis of rGO
Synthesis of rGO was carried out according to the method described previously.21 Briefly, bacteria were grown in a 500 mL Erlenmeyer flask containing lysogeny broth. The flasks were incubated for 21 hours in a shaker set at 120 rpm and 37°C. After the incubation period, the culture was centrifuged at 10,000 rpm and the resultant biomass used for the synthesis of rGO. In a typical reduction experiment, 200 mg of B. marisflavi biomass was added to the GO dispersion (0.5 mg/mL) and the mixture stirred at 37°C for 72 hours. Following this, the stable black dispersion was centrifuged to remove excess bacteria as a supernatant liquid. The obtained black dispersion was designated “B-rGO” and used for further characterization.
Characterization
Ultraviolet–visible (UV–vis) spectra of the aqueous suspensions of GO and B-rGO were obtained using a WPA Biowave II UV/Visible Spectrophotometer (Biochrom, Cambridge, UK). X-ray diffraction (XRD) analyses were carried out on a D8 Discover X-ray diffractometer (Bruker, Karlsruhe, Germany). The high-resolution XRD patterns were measured at 3 Kw with a copper target using a scintillation counter (λ = 1.5406°A) at 40 kV and 40 mA were recorded in the range of 2θ = 5°–80°. A JSM-6700F semi-in-lens field emission scanning electron microscope (JEOL, Tokyo, Japan) operating at 10 kV was used to acquire scanning electron microscopy (SEM) images. The solid samples were transferred to a carbon tape held into an SEM sample holder for analyses. Analyses of the samples were carried out at an average working distance of 6 mm. Raman spectroscopy analyses were performed using a confocal micro-Raman LabRAM HR high-resolution Raman microscope (WITec, WITec Instruments Corp., TN, USA) in backscattering geometry with a charge-coupled device detector, and a 532 nm argon laser. The calibration was initially made using an internal silicon reference at 520 cm−1 and gave a peak position resolution of <1 cm−1. The spectra were measured from 500 to 4500 cm−1. All samples were deposited on silicon wafers in powder form without using any solvent. Surface images were measured using tapping-mode atomic force microscopy (AFM) (SPA 400, Seiko Instruments, Chiba, Japan) operating at room temperature. Height and phase images were recorded simultaneously using nanoprobe cantilevers (SI-DF20, Seiko Instruments).
Cell culture
The MCF-7 human breast cancer cell line was kindly provided by Prof Ssang-Goo, Department of Animal Biotechnology, Konkuk University, Seoul, South Korea. Cells were cultured in Roswell Park Memorial Institute (RPMI) 1640 medium supplemented with 10% heat inactivated fetal calf serum, 10 mmol/L glutamine, and 50 μg/mL each of streptomycin and penicillin. Cells were grown to confluence at 37°C in a 5% CO2 atmosphere. GO and B-rGO suspensions were freshly prepared before exposure to cells, diluted to appropriate concentrations from 20 to 100 μg/mL with the culture medium, then immediately applied to the cells. Cells not treated with GO or B-rGO served as controls in each experiment.
WST-cell viability assay
WST-8 assay (water-soluble tetrazolium salt) was undertaken as described by Liao et al.27 Briefly, 1 × 10⁴ cells were seeded in a 96-well plate and cultured in RPMI 1640 supplemented with 10% serum at 37°C under 5% CO2. After 24 hours, the cells were washed twice with 100 μL of serum-free medium then incubated with 100 μL of different concentrations of GO and B-rGO suspensions in serum-free minimal essential medium. After 24 hours’ exposure, the cells were washed twice with serum-free medium and 15 μL of Cell Counting Kit-8 solution was added to each well containing 100 μL of serum-free minimal essential medium. After 1 hour of incubation at 37°C under 5% CO2, 80 μL of the mixture was transferred to another 96-well plate, because residual GO and B-rGO can affect the absorbance values at 450 nm. The absorbance of the mixture solutions was measured at 450 nm, using a microplate reader.
Cell-free control experiments were performed to determine whether the synthesized GO and B-rGO would react directly with the WST-8 reagents. Briefly, 100 μL of GO and B-rGO suspensions with different concentrations (20–100 μg/mL) were added to a 96-well plate and 10 μL of WST-8 reagent solution was added to each well; the mixture solution was incubated at 37°C under 5% CO2 for 1 hour. After incubation, the GO and B-rGO were centrifuged and 50 μL of the resulting supernatant was transferred to another 96-well plate. The optical density was measured at 450 nm.
Determination of ROS
Intracellular ROS were measured based on the intracellular peroxide-dependent oxidation of 2′,7′-dichlorodi-hydrofluorescein diacetate (Invitrogen, Carlsbad, CA, USA) to form the fluorescent compound 2′,7′-dichlorofluorescein, as previously described.35 Cells were seeded onto 24-well plates at a density of 5 × 10⁴ cells per well and cultured for 24 hours. After washing twice with phosphate-buffered saline (PBS), fresh medium containing different concentrations of GO or B-rGO was added and the cells incubated for another 24 hours. Following this, 20 μM of 2′,7′-dichlorodihydrofluorescein diacetate was added to the cells and incubation continued for 30 minutes at 37°C. Finally, the cells were rinsed with PBS, 2 mL of PBS was added to each well, and fluorescence intensity was determined with a Gemini™ EM microplate spectrofluorometer (Molecular Devices, Sunnyvale, CA, USA) with excitation at 485 nm and emission at 530 nm.
Membrane integrity
The cell membrane integrity of MCF-7 cells was evaluated by determining the activity of lactate dehydrogenase (LDH) leaking out of the cells using an in vitro toxicology assay kit (TOX7, Sigma-Aldrich) according to the manufacturer’s instructions. The LDH assay is based on the release of the cytosolic enzyme, LDH, from cells with damaged cellular membranes. Thus, in cell culture, the course of GO- and B-rGO-induced cytotoxicity was followed quantitatively by measuring the activity of LDH in the supernatant. Briefly, cells were exposed to various concentrations of GO and B-rGO for 24 hours then 100 μL per well of each cell-free supernatant was transferred in triplicate into wells in a 96-well plate, and 100 μL of LDH-assay reaction mixture was added to each well. After 3 hours’ incubation under standard conditions, the optical density of the color generated was determined at a wavelength of 490 nm using a microplate reader.
Cell mortality assay
The cell mortality was evaluated using trypan blue assay as described by Chang et al.28 MCF-7 cells were plated in 6-well plates (1 × 10⁵ cells per well) and incubated for 24 hours. Then, GO or B-rGO was introduced to cells at different concentrations (20, 40, 60, 80, and 100 μg/mL) in culture medium. Cells cultured in the free medium were taken as the control. After 24 hours, the supernatant was collected and the cells detached with 300 μL trypsin-ethylenediaminetetraacetic acid (EDTA) solution. The supernatant-detached cell mixture was centrifuged at 1200 rpm/minutes for 5 minutes. The residue was then added to a 700 μL trypan blue solution and dispersed. After 5 minutes staining, cells were counted using a cytometer. The dead cells were stained with blue color. Cell mortality (%) was expressed as percentage of the dead cell number/the total cell number.
Results and discussion
Characterization of GO and B-rGO by UV–vis spectroscopy
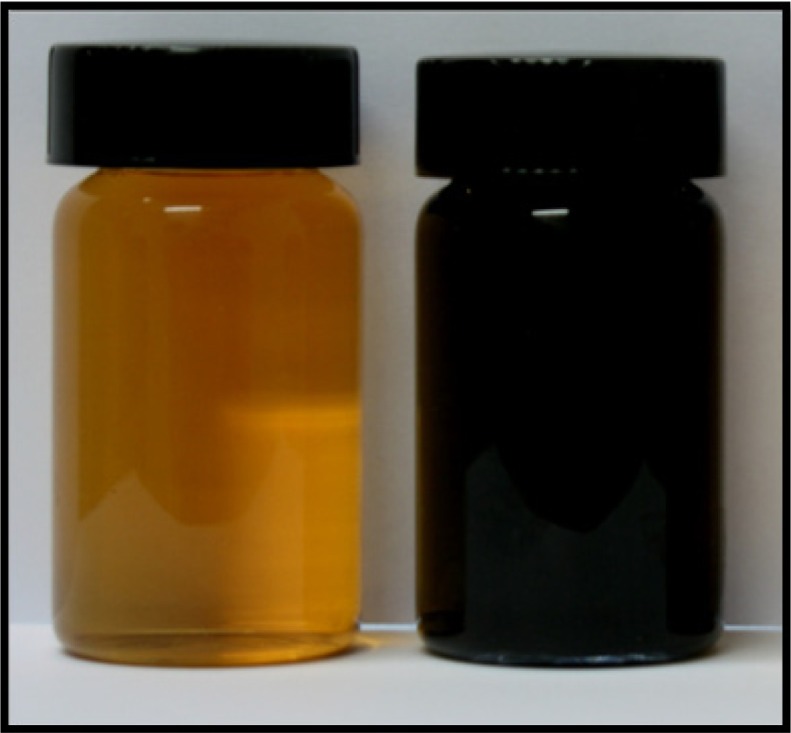
Figure 1 shows the GO and B-rGO that were produced using the modified method of Hummers and Offeman.33 To briefly reiterate, the graphite powder was first oxidized into graphite oxide using KMnO4/H2SO4, then the graphite oxide was exfoliated into GO sheets by ultra-sonication in water. In a typical reduction experiment, 200 mg of bacterial biomass was added to the GO dispersion, and the mixture was stirred at 37°C for 72 hours. GO nanosheets were exfoliated from the graphite oxide, resulting in a clear, homogeneous, yellow-brown GO dispersion (pictured at left in Figure 1) and rGO nanosheets were obtained from the reduction of GO by bacterial biomass (pictured at right in Figure 1). This indicated that bacterial biomass played an important role in the reduction of GO to graphene. The obtained GO and B-rGO were highly soluble in water. They appeared different because of their distinct structural and physicochemical properties.36 The reduction of GO was also indicated by the color change of the solution before and after reaction (from yellow-brown to black), as shown in Figure 1. This can be attributed to the large amount of hydrophilic functional groups, such as carboxyl, hydroxyl, and epoxy groups, on the GO nanosheets.4 After the visibility check, we examined the water dispersibility of GO and B-rGO using UV–vis spectra analysis.
Figure 1.
Photograph of graphene oxide (left) and bacterially reduced graphene oxide (right) at a concentration of 500 μg/mL.
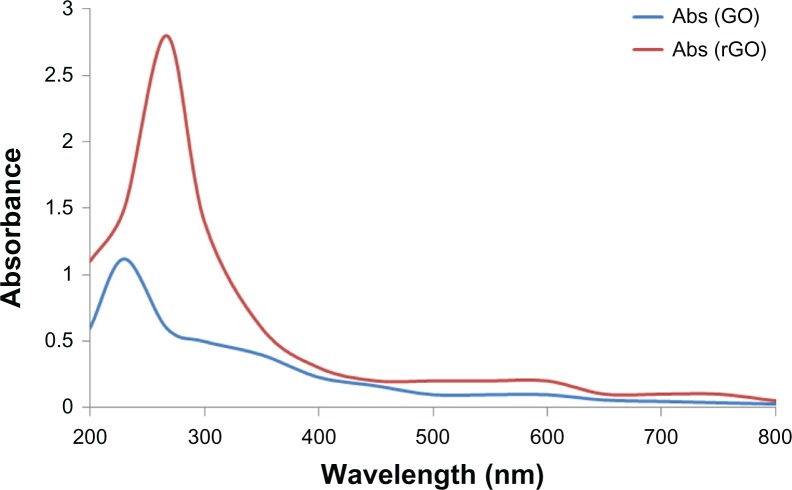
The optical absorption spectra of the GO and B-rGO suspensions are shown in Figure 2. After the reduction of GO by bacterial biomass, the color of the GO suspension changed from yellow-brown to black. The black color of the rGO suspensions indicates the restoration of the π network between the sheets due to the removal of the oxygen-containing bonds resulting in electronic conjugation within the reduced sheets.37 The optical absorption spectra also show that the absorption peaks of the GO suspension is around 230 nm, while the absorption peak of the reduced suspensions shift into wavelengths of around 267 nm, corresponding to deoxygenation of the GO suspension under the reduction processes. It shows that the GO might be reduced, the aromatic structure restored, and the reduction improved. Similar features and trends have been observed for the reduction of GO with L-ascorbic acid37 and L-cysteine,38 baker’s yeast,18 and E. coli.21 Fernández-Merino et al37 suggested that the maximum red-shift value can be used as a standard to estimate the performance of the reducing agent.
Figure 2.
Ultraviolet–visible absorption spectra of graphene oxide (GO) and the reduced graphene oxide (rGO) suspension reduced by bacterial biomass (50 μg/mL).
Abbreviation: Abs, absorption spectrum.
XRD analysis
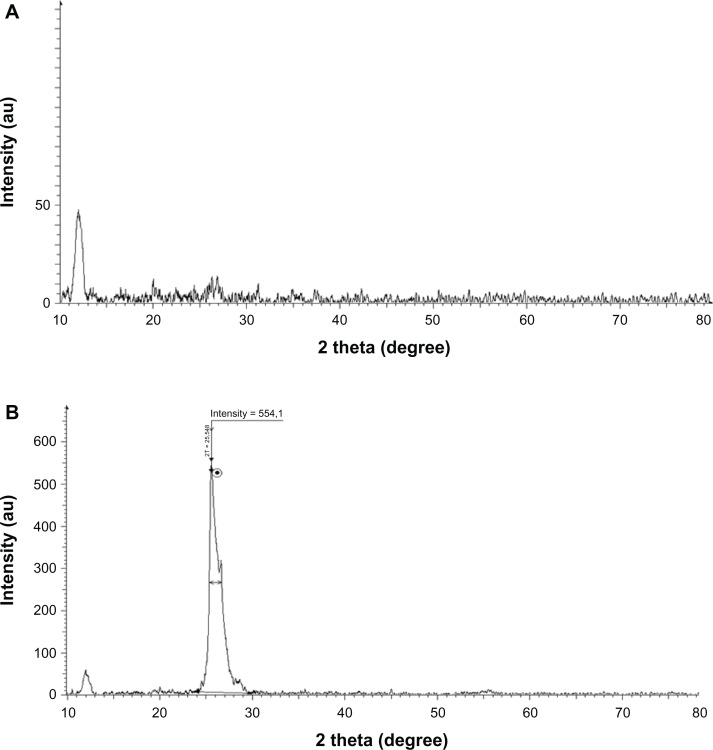
We further characterized the crystal structure of the rGO by XRD. Pristine graphite exhibits a basal reflection (002) peak at 2θ = 25.6° (d-spacing = 0.35 nm).25 Compared with pristine graphite, the diffraction peak of exfoliated GO appears at the lower angle (2θ = 11.7°, d-spacing = 0.76 nm) (Figure 3A). The increase in d-spacing is due to the intercalation of water molecules and the formation of oxygen-containing functional groups between the layers of the graphite.3 As shown in Figure 3, the XRD pattern of B-rGO appeared as a broad band between 2θ = 24° and 2θ = 29° and crystalline peak centered at 2θ = 25.5° (Figure 3B) corresponding to the interlayer spacing of 0.35 nm, which is significantly different from pristine graphite. The disappearance of the 002 reflection peak of GO and appearance of a broad band at 2θ = 25.5° with B-rGO indicated the significant reduction of GO and formation of graphene of fewer layers.8,39–41
Figure 3.
X-ray diffraction patterns of (A) graphene oxide and (B) bacterially reduced graphene oxide.
Note: The arrow indicates the position of crystalline peak of reduced graphene oxide. The dot represent the intensity value of peak.
Size analysis by dynamic light scattering (DLS)
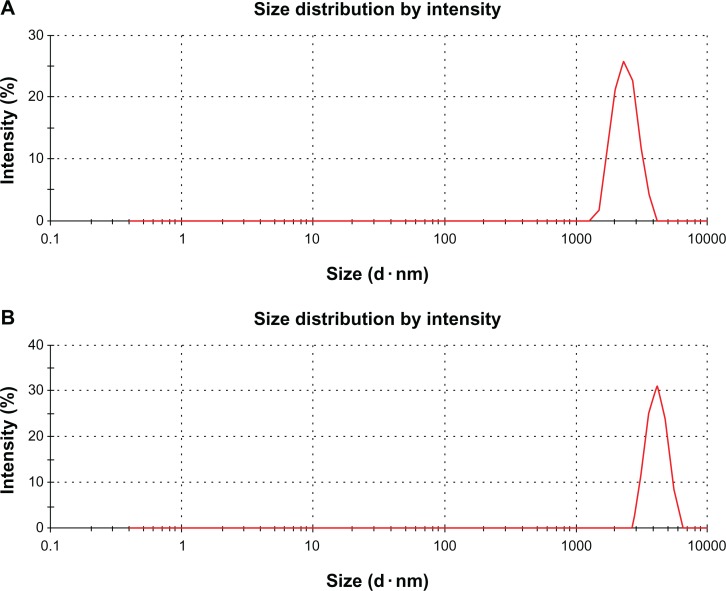
DLS measurement was performed in aqueous solution to elucidate the size of GO and rGO. It was found that the average size of GO layer was 1970 nm (Figure 4A). However, after the reduction of GO with biomass, an average size of 3833 nm was obtained under the same instrumental conditions (Figure 4B). This obvious change in size distribution indicated that the biomass not only acted as a reducing agent to prepare the rGO but was also functionalized on the surface of the resulting rGO, leading to an increased Brownian motion rate after the reduction process. Wang et al42 observed that after the reduction of GO with heparin, the average size of rGO layers was larger than that of GO. The rGO particles were formed by reducing GO nanosheets, which are about twice as large as GO nanosheets because of the aggregation of B-rGO fragments.25 However, DLS results only show the size differences between GO and B-rGO layers.25 To confirm the actual sizes, the dispersions were dropped on aluminum foil and dozens of SEM images taken randomly for each sample (see the next section).
Figure 4.
Hydrodynamic size distribution of (A) graphene oxide and (B) bacterially reduced graphene oxide (500 μg/mL) measured by dynamic light scattering at room temperature in deionized water.
SEM analysis
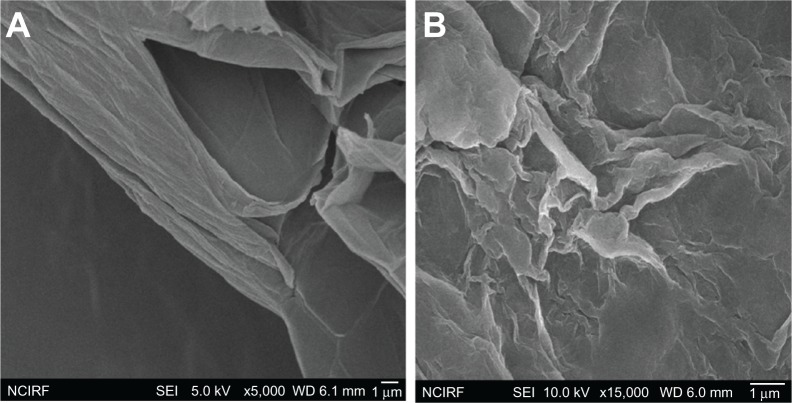
As just mentioned, to examine the size of GO and B-rGO layers further, we used SEM analysis. The dispersions were dropped on aluminum foil and SEM images were taken randomly of each sample. Figure 5A shows SEM images of GO flakes and layers, revealing them to have a wavy, folded shape and to be in thin layers. The SEM images also revealed that the rGO material consists of individual sheets closely associated with each other (Figure 5A). Our results suggest that thin layers of nanosheets formed the GO dispersion, while the B-rGO dispersion was mainly comprised of larger, aggregated forms. Images of the rGO reveal that it consisted of several layers stacked on top of one another like silky sheets of paper (Figure 5B).
Figure 5.
Scanning electron microscopy images of (A) graphene oxide and (B) bacterially reduced graphene oxide.
Raman spectral analysis
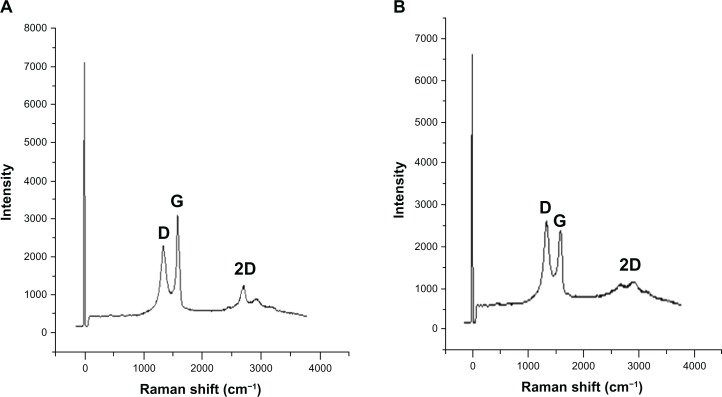
Raman spectroscopy analysis was carried out for both GO and B-rGO. Raman spectroscopy is highly sensitive to the electronic structure of a substance and has proven to be an essential tool for the characterization of carbon-based materials, especially C═C double bonds, which lead to high Raman intensities.42 The common characteristics of carbon materials in Raman spectra are the G line (1580 cm−1) related to the first-order scattering of the E2g phonons of sp2 carbon atoms and the D line (1350 cm−1) as a breathing mode of κ-point phonons of A1g symmetry which is assigned to structural imperfections induced by the attachment of hyrodxyl and/or epoxide groups on the carbon surface.19 Our results show that the G- and D-bands of GO appear at 1587 cm−1 and 1343 cm−1, respectively (Figure 6A). Thus, the Raman spectrum of GO, as expected, displays a prominent G-peak (the E2g mode of sp2 carbon atoms) as the characteristic feature at 1587 cm−1. The Raman spectra further support the structural change before and after the reduction of GO by bacterial biomass. In the Raman spectrum of GO after reduction by bacterial biomass (ie, for the B-rGO), the G-band is broadened and shifted to around 1608 cm−1 and the D-band at 1395 cm−1 becomes prominent, indicating the reduction in size of the in-plane sp2 domains due to the extensive oxidation as a result of the bacterial biomass (Figure 6B). Interestingly, the Raman spectrum of GO after reduction by bacterial biomass shows a higher D-/G-band intensity ratio than GO (1.4). In comparison to purified GO, the ID/IG ratio of the B-rGO is significantly increased (1.7), indicating the introduction of sp3 defects after functionalization and incomplete recovery of the structure of graphene.43 The variation in the relative intensities of the G- and D-bands in the Raman spectra of the GO during the reduction reveal the change of the electronic conjugation state. This change suggests that there was an increase in the number of sp2 domains with the reduction of GO.4,44
Figure 6.
Raman spectra of (A) graphene oxide and (B) bacterially reduced graphene oxide.
Our Raman spectroscopy analysis results are in good agreement with two previous studies45,46 in which sulfur containing an amino acid (L-cysteine) was used to reduce GO into GO nanosheets and another study that developed a green and simple approach to the synthesis of graphene nanosheets using reducing sugars.16 In another study, reducing using wild carrot root caused the G-band of GO to broaden and shift to 1593 cm−1, while the D-band shifted to a lower region (1346 cm−1) and became more prominent, indicating the destruction of sp2 domains and the formation of defects in the sheets due to extensive oxidation.33 When baker’s yeast was used as a reducing agent, the D-band shift indicated successful functionalization of rGO.18 Thus, our observation is in good agreement with previous studies and supports the formation of functionalized graphene.
Further, to examine the quality of the synthesized graphene, we used Raman spectroscopy, which is a good choice for the nondestructive and quick inspection of a number of layers of graphene.47 Raman spectra of graphene-based materials have a 2D band that is sensitive to the stacking of graphene sheets.47 The characteristic shape and position of these 2D bands can be used to accurately differentiate single and bilayer graphene from multilayer graphene.47 In our experiment, we observed a significant feature and intensity of 2D bands located at 2600–3000 cm−1 in the Raman spectrum. As shown in Figure 6B, the 2D band of B-rGO is centered at about 2672 cm−1, with a low-intensity shoulder at higher wave numbers, while we analyzed the peak intensity ratio between 2D and G-bands to be 2.1. These results suggest that the synthesized graphene probably had a monolayer form.
AFM analysis of GO and B-rGO
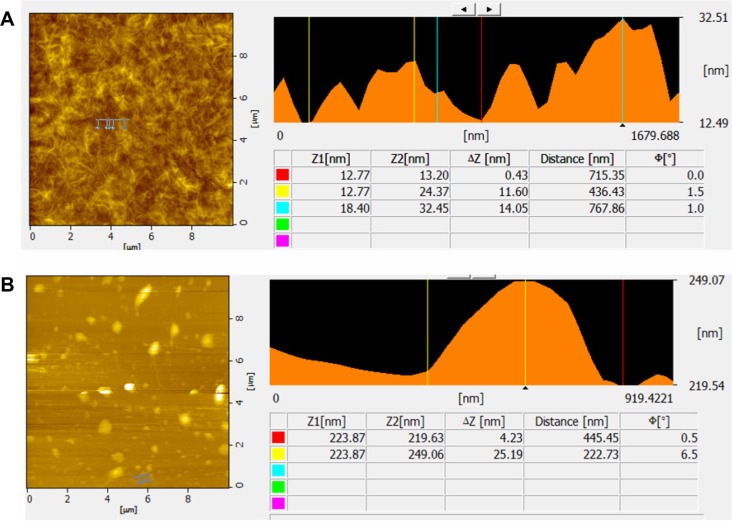
AFM images were used to characterize the surface morphology and thickness of the GO and B-rGO nanosheets. As shown in Figure 7A, the representative AFM image and cross-section analysis of GO clearly exhibit flat sheets with some wrinkles and an average thickness of about 0.43 nm, indicating the formation of single-layered GO nanosheets. Compared with GO, the B-rGO was thicker at ∼4.23 nm, demonstrating that the biomass adhered and reduced the GO surface successfully (Figure 7B). Gao et al48 showed that L-tryptophan stabilized graphene sheets, which have an average thickness of ∼2.0 nm. Khanra et al18 reported that the average thickness of yeast reduced graphene oxide (YR-GO) was 1.2 nm, which is slightly greater than that of pure graphene. The greater thickness of YR-GO may be due to adsorption of nicotinamide adenine dinucleotide phosphate on the surface of graphene and/or the formation of bilayer functionalized graphene. Zhu et al17 observed that glucose-reduced graphene was thicker than exfoliated GO sheets due to the capping reagent used, which played an important role in increasing the thickness of the graphene. Similarly, Wang et al49 also reported that tea polyphenol produced graphene of increased thickness. Thus, the results of previous reports and the study presented here confirm that biomolecules play an important role in reduction and also in increasing the thickness of graphene. In turn, the increased thickness indicates that most of the oxygen-containing functional groups were removed after reduction.
Figure 7.
Atomic force microscopy images of (A) graphene oxide and (B) bacterially reduced graphene oxide.
Effect of GO and B-rGO on the viability of MCF-7 cells
The evaluation of the biocompatibility of graphene materials is an important factor in biological and bio-medical applications, such as drug delivery and gene transfection. In our study, the cytotoxicity of GO and B-rGO was evaluated in MCF-7 cells. It has been found that 3-(4,5-Dimethylthiazol-2-yl)-2,5-diphenyltetrazolium bromide (MTT) assay is inappropriate for cytotoxicity tests of graphene materials, since the graphene reacts with the MTT reagent and forms purple formazan, leading to a false-positive result and overestimated cell viability.27 Thus, to obtain a precise toxic evaluation of GO and B-rGO, we employed the WST-8 assay, which does not react with GO or B-rGO, to measure the cytotoxicity of these two substances.
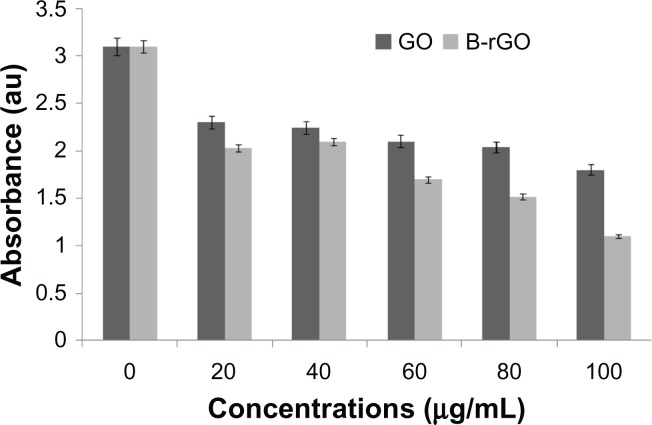
As already described in the “Methods and materials section,” MCF-7 cells were incubated with GO and B-rGO for 24 hours, then the dose-dependent cytotoxicity was observed. As shown in Figure 8, both substances were significantly toxic, but there was an obvious decrease in cell viability with B-rGO of as much as 64.0% ± 2.0% when the concentrations were in the range of 100 μg/mL. Li et al50 demonstrated that pristine graphene can induce cytotoxicity by inducing depletion of the mitochondrial membrane potential, increasing generation of intracellular ROS, and subsequently triggering apoptosis by activating the mitochondrial pathway.
Figure 8.
The effect of graphene oxide (GO) and bacterially reduced graphene oxide (B-rGO) on cell viability of MCF-7 cells.
Notes: The cell viability of MCF-7 cells was determined by WST-8 assay after 24 hours of exposure to different concentrations of GO or B-rGO. The results represent the means of three separate experiments and error bars represent the standard error of the mean. Treated groups showed statistically significant differences from the control group, as determined using Student’s t-test (P < 0.05).
ROS generation
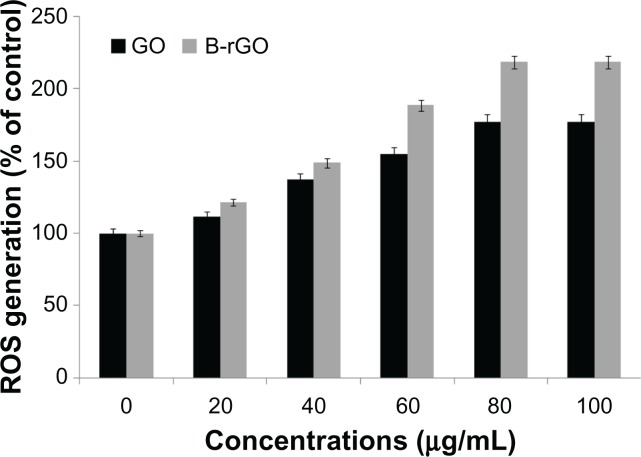
Nanoparticles can cause cell cytotoxicity by inducing the dysfunction of mitochondria51,52 and initiating the consequent accumulation of intracellular ROS. An increased level of ROS generation can be observed when cells are exposed to nanomaterials. Accumulation of intracellular ROS is the main characteristic of oxidative stress, so the detection of ROS generation reflects the intracellular oxidative stress status, which is an important indicator of cellular health.51 As we were interested to see the effect of GO and B-rGO on MCF-7 cells, we measured the intracellular ROS level in MCF-7 cells after incubation with GO and B-rGO for 24 hours. Figure 9 shows that GO and B-rGO exposure induced intracellular ROS generation in a dose-dependent manner, with the highest ROS level found in MCF-7 cells exposed to a 100 μg/mL dose of B-rGO for 24 hours. The level of ROS production was significantly higher in B-rGO-treated cells than in GO-treated cells. One reason for this could be the functionalization of GO by the biomass. Li et al50 showed that pristine graphene exposure induced intracellular ROS generation in a time- and dose-dependent manner. Chang et al28 explained that loss of viability was dependent on the size (large-GO, medium-GO, and small-GO) and concentration of the GO as well as the length of time the cells were exposed to graphene materials. The large surface areas of graphene-family nanosheets make surface reactions potentially important, including ROS production, antioxidant deactivation,53 and ROS quenching.54 However, the action of a graphene material is based on the number of layers it has, its lateral dimensions, and its surface chemistry as well as its surface area. Akhavan et al30 demonstrated the size- and concentration-dependent cyto- and genotoxicity of GO sheets and nanoplatelets in human mesenchymal stem cells.
Figure 9.
Generation of reactive oxygen species (ROS) in graphene oxide (GO)-and bacterially reduced graphene oxide (B-rGO)-treated MCF-7 cells.
Notes: The relative fluorescence of 2′,7′-dichlorofluorescein was measured using a spectrofluorometer with excitation at 485 nm and emission at 530 nm. The results represent the means of three separate experiments and the error bars represent the standard error of the mean. Treated groups showed statistically significant differences from the control group, as determined by Student’s t-test (P < 0.05).
Impact of GO and B-rGO on membrane integrity
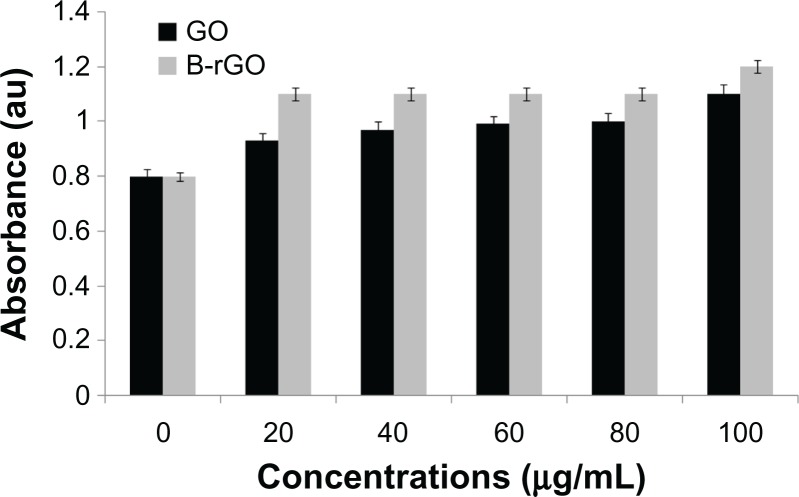
LDH is a soluble cytosolic enzyme that is released into the extracellular medium as a result of membrane damage; this consequently leads to apoptosis. It is widely accepted as an indicator of lytic cell death. Several studies have shown that nanomaterials can induce apoptosis or necrosis.51,55 LDH release measures membrane damage, a hallmark of necrosis. To investigate the impact of GO and B-rGO on membrane integrity, the cells were treated with various concentrations of GO and B-rGO for 24 hours and then the extracellular LDH activity was measured. The results suggest that cell membrane integrity in MCF-7 cells was compromised by GO and B-rGO at a concentration of 100 μg/mL in a dose-dependent manner (Figure 10). LDH activity was slightly increased in comparison to the control cells. The data obtained reveal that MCF-7 cells were sensitive to the GO and B-rGO treatment. In the LDH assay, increasing the concentration of the GO and B-rGO led to a higher absorbance reading, which indicates that the membrane integrity was compromised. Further, cellular contents were found in the media. Chang et al28 demonstrated that the LDH levels of GO-treated cells were slightly lower than those of their control cells.
Figure 10.
The effect of graphene oxide (GO) and bacterially reduced graphene oxide (B-rGO) on lactate dehydrogenase (LDH) activity in MCF-7 cells.
Notes: LDH activity was measured by changes in optical densities due to nicotinamide adenine dinucleotide reduction, monitored at 490 nm, as described in “Materials and methods,” using a cytotoxicity detection lactate dehydrogenase kit. The results represent the means of three separate experiments and the error bars represent the standard error of the mean. Treated groups showed statistically significant differences from the control group, as determined by Student’s t-test (P < 0.05).
Cell mortality
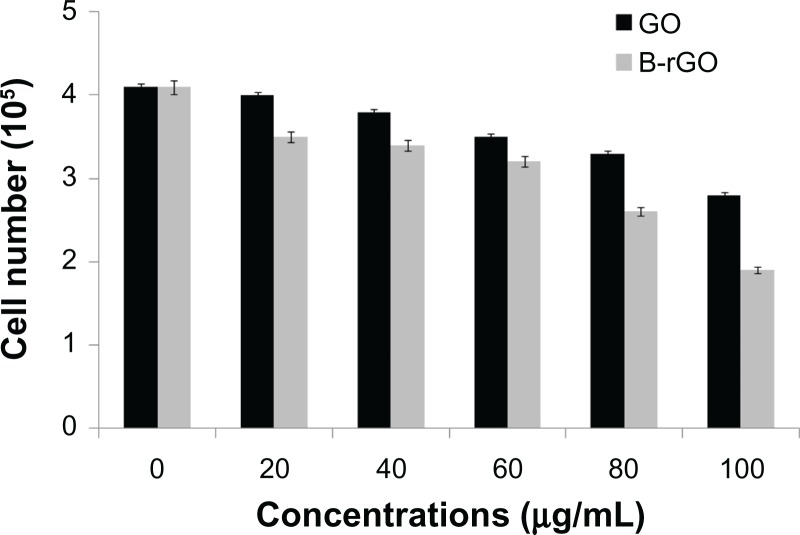
In general, while viability assays show the activity of cell mitochondria, the mortality analysis indicates cell death.28 In the study reported here, cell mortality was monitored by trypan blue exclusion assay, in which dead cells are stained in blue while the live ones remain unchanged. Mortality is expressed by the ratio of dead cells in total cells. The cells treated with GO and B-rGO showed significant cell death when compared with untreated cells (Figure 11).
Figure 11.
The effect of graphene oxide (GO) and bacterially reduced graphene oxide (B-rGO) on the mortality of MCF-7 cells.
Notes: The mortality of MCF-7 cells was determined using trypan blue assay after 24 hours of exposure to different concentrations of GO or B-rGO. The results represent the means of three separate experiments and the error bars represent the standard error of the mean. Treated groups showed statistically significant differences from the control group, as determined by Student’s t-test (P < 0.05).
Cheng et al31 observed that biopolymer functionalized rGO exhibits an ultralow hemolysis ratio and good compatibility in human umbilical vein endothelial cells, even at a high concentration of 100 μg/mL. Heparin-functionalized rGO has been shown to have good stability in aqueous solution, owing to the strong electrostatic and steric repulsions of the heparin, which adsorb on the surfaces of rGO sheets.42 Moreover, rGO has been shown to exhibit excellent biocompatibility and anticoagulant activity.42 Hu et al56 observed that human alveolar basal epithelial cells (A549) were sensitive to the presence of GO and showed concentration-dependent cytotoxicity. Further, graphene has been shown to induce cytotoxic effects and mitochondrial injury in human neuronal cells after 4 and 24 hours in a dose- and shape-dependent manner.57 Ruiz et al58 studied the effect of GO film on the attachment and proliferation of mammalian colorectal adenocarcinoma HT-29 cells and suggested that the mammalian cells attached more efficiently to the GO films, without showing significant toxicity. Similarly, Li et al59 reported the good biocompatibility of graphene films with mouse neuronal cells. Akhavan et al20 compared the efficiency of glucose- and hydrazine-reduced graphene for photothermal therapy for cancer cells. They found that the GO suspension reduced and functionalized by glucose in the presence of an iron catalyst had a biocompatible property, with an excellent near infrared photothermal therapy efficiency that was better than that of the hydrazine-rGO single- and multiwall carbon nanotube suspensions; these hydrazine-rGO suspensions showed some level of toxicity. Cheng et al31 demonstrated dose-dependent cytotoxicity in human umbilical vein endothelial cells with GO. They observed no toxicity in biopolymer functionalized rGO, but a higher level of cytotoxicity was seen when the cells were treated with hydrazine-reduced rGO.
Recently, our g roup also studied the effect of microbially reduced GO and hydrazine-reduced GO on mouse embryonic fibroblast cells. The results of that study suggest that microbially reduced GO has significant biocompatibility while hydrazine-reduced GO is highly toxic, indicating that the molecules used for the functionalization of GO and the type of cells influence biocompatibility.20
Although the mechanism responsible for graphene and GO toxicity has been reported on, no conclusions have been reached that are sufficient for risk assessment or regulation.60 Some studies have proposed that oxidative stress is one of the mechanisms involved in the cytotoxic effects of various nanomaterials such as carbon ones.23,28,61,62 Other studies have suggested that the cytotoxicity of graphene nanomaterials is due to the damaging of cell membranes through physical interaction with graphene’s extremely sharp edges.22,26 Tazawa et al63 demonstrated that bacterial cells treated with GO and rGO lost membrane integrity. Liu et al25 proposed the mechanism of toxicity includes initial cell deposition on graphene-based materials and membrane stress caused by direct contact with sharp nanosheets. Our previous studies demonstrated that graphene nanomaterials interact with cells, eventually inducing toxicity. Both GO and B-rGO induce cytotoxic effects, and these effects are concentration dependent. Finally, toxicity also depends on the physicochemical properties of graphene-based materials, such as density of functional groups, size, conductivity, and the type of reducing agent used for deoxygenation of GO as well as on the cell types exposed to the materials.
Conclusion
This work demonstrates the synthesis of water-soluble graphene through reduction of GO using bacterial biomass. The reduction was carried out in aqueous medium at 37°C under mild conditions without toxic substances. The reduction of GO was confirmed by UV–vis spectroscopy, XRD, SEM, Raman spectroscopy and AFM. This technique has several advantages over traditional chemical reduction: it is cost-effective, environmentally friendly, a simple approach, and an easy process for large-scale production. Our results indicate that rGO can be proposed as one of the promising nanomaterials for application in effective nanotherapy of cancer cells. Moreover, the as-prepared rGO might satisfy various biomedical applications. Thus, the proposed method provides a novel and promising approach for the study of the biological and biomedical applications of graphene.
Acknowledgments
This paper was supported by the SMART-Research Professor Program of Konkuk University. Dr Sangiliyandi Gurunathan was supported by the Konkuk University SMART-Full Time Professorship. This work was supported by the Woo Jang Choon Project (PJ007849) and the next generation of Biogreen 21 (PJ009107) from the Rural Development Administration, South Korea.
Footnotes
Disclosure
The authors report no conflicts of interest in this work.
References
- 1.Loh KP, Bao Q, G.Eda G, Chhowalla M. Graphene oxide as a chemically tunable platform for optical applications. Nat Chem. 2010;2(12):1015–1024. doi: 10.1038/nchem.907. [DOI] [PubMed] [Google Scholar]
- 2.Geim KA, Novoselov KS. The rise of graphene. Nat Mater. 2007;6(3):183–191. doi: 10.1038/nmat1849. [DOI] [PubMed] [Google Scholar]
- 3.Dreyer DR, Park S, Bielawski CW, Ruoff RS. The chemistry of graphene oxide. Chem Soc Rev. 2010;39(1):228–240. doi: 10.1039/b917103g. [DOI] [PubMed] [Google Scholar]
- 4.Novoselov KS, Geim AK, Morozov SV, et al. Electric field effect in atomically thin carbon films. Science. 2004;306(5696):666–669. doi: 10.1126/science.1102896. [DOI] [PubMed] [Google Scholar]
- 5.Stankovich S, Dikin DA, Piner RD, et al. Synthesis of graphene-based nanosheets via chemical reduction of exfoliated graphite oxide. Carbon. 2007;45:1558–1565. [Google Scholar]
- 6.Berger C, Song Z, Li X, et al. Electronic confinement and coherence in patterned epitaxial graphene. Science. 2006;312(5777):1191–1196. doi: 10.1126/science.1125925. [DOI] [PubMed] [Google Scholar]
- 7.Kim KS, Zhao Y, Jang H, et al. Large-scale pattern growth of graphene films for stretchable transparent electrodes. Nature. 2009;457(7230):706–710. doi: 10.1038/nature07719. [DOI] [PubMed] [Google Scholar]
- 8.Li D, Müller MB, Gilje S, Kaner RB, Wallace GG. Processable aqueous dispersions of graphene nanosheets. Nat Nanotechnol. 2008;3(2):101–105. doi: 10.1038/nnano.2007.451. [DOI] [PubMed] [Google Scholar]
- 9.Tung VC, Allen MJ, Yang Y, Kaner RB. High-throughput solution processing of large-scale graphene. Nat Nanotechol. 2009;4(1):25–29. doi: 10.1038/nnano.2008.329. [DOI] [PubMed] [Google Scholar]
- 10.Dubin S, Gilje S, Wang K, et al. A one-step, solvothermal reduction method for producing reduced graphene oxide dispersions in organic solvents. ACS Nano. 2010;4(7):3845–3852. doi: 10.1021/nn100511a. [DOI] [PMC free article] [PubMed] [Google Scholar]
- 11.Zhou X, Liu Z. A scalable, solution-phase processing route to graphene oxide and graphene ultralarge sheets. Chem Commun (Camb) 2010;46(15):2611–2613. doi: 10.1039/b914412a. [DOI] [PubMed] [Google Scholar]
- 12.Salas EC, Sun Z, Lüttge A, Tour JM. Reduction of graphene oxide via bacterial respiration. ACS Nano. 2010;4(8):4852–4856. doi: 10.1021/nn101081t. [DOI] [PubMed] [Google Scholar]
- 13.Min K, Han TH, Kim J, Jung C, Hong SM, Koo CM. A facile route to fabricate stable reduced graphene oxide dispersions in various media and their transparent conductive thin films. J. Colloid Interface Sci. 2012;383(1):36–42. doi: 10.1016/j.jcis.2012.06.021. [DOI] [PubMed] [Google Scholar]
- 14.Fan X, Peng W, Li Y, et al. Deoxygenation of exfoliated graphite oxide under alkaline conditions: a green route to graphene preparation. Adv Mater. 2008;20(23):4490–4493. [Google Scholar]
- 15.Tang LA, Lee WC, Shi H, et al. Highly wrinkled cross-linked graphene oxide membranes for biological and charge-storage applications. Small. 2012;8(3):423–431. doi: 10.1002/smll.201101690. [DOI] [PubMed] [Google Scholar]
- 16.Zhang J, Yang H, Shen G, Cheng P, Zhang J, Guo S. Reduction of graphene oxide via L-ascorbic acid. Chem Commun (Camb) 2010;46(7):1112–1114. doi: 10.1039/b917705a. [DOI] [PubMed] [Google Scholar]
- 17.Zhu C, Guo S, Fang Y, Dong S. Reducing sugar: new functional molecules for the green synthesis of graphene nanosheets. ACS Nano. 2010;4(4):2429–2437. doi: 10.1021/nn1002387. [DOI] [PubMed] [Google Scholar]
- 18.Khanra P, Kuila T, Kim NH, Bae SH, Yu DS, Lee JH. Simultaneous bio-functionalization and reduction of graphene oxide by baker’s yeast. Chem Eng J. 2012;183:526–533. [Google Scholar]
- 19.Esfandiar A, Akhavan O, Irajizad A. Melatonin as a powerful bio-antioxidant for reduction of graphene oxide. J Mater Chem. 2011;21:10907–10914. [Google Scholar]
- 20.Akhavan O, Ghaderi E, Aghayee S, Fereydooni Y, Talebi A. The use of a glucose-reduced graphene oxide suspension for photothermal cancer therapy. J Mater Chem. 2012;22:13773–13781. [Google Scholar]
- 21.Gurunathan S, Han JW, Eppakayala V, Kim JH. Microbial reduction of graphene oxide by Escherichia coli: a green chemistry approach. Colloids Surf B Biointerfaces. 2013;102:772–777. doi: 10.1016/j.colsurfb.2012.09.011. [DOI] [PubMed] [Google Scholar]
- 22.Akhavan O, Ghaderi E. Toxicity of graphene and graphene oxide nanowalls against bacteria. ACS Nano. 2010;4(10):5731–5736. doi: 10.1021/nn101390x. [DOI] [PubMed] [Google Scholar]
- 23.Zhang Y, Ali SF, Dervishi E, et al. Cytotoxicity effects of graphene and single-wall carbon nanotubes in neural phaeochromocytoma-derived PC12 cells. ACS Nano. 2010;4(6):3181–3186. doi: 10.1021/nn1007176. [DOI] [PubMed] [Google Scholar]
- 24.Akhavan O, Ghaderi E, Esfandiar A. Wrapping bacteria by graphene nanosheets for isolation from environment, reactivation by sonication, and inactivation by near-infrared irradiation. J Phys Chem B. 2011;115(19):6279–6288. doi: 10.1021/jp200686k. [DOI] [PubMed] [Google Scholar]
- 25.Liu S, Zeng TH, Hofmann M, et al. Antibacterial activity of graphite, graphite oxide, graphene oxide, and reduced graphene oxide: membrane and oxidative stress. ACS Nano. 2011;5(9):6971–6980. doi: 10.1021/nn202451x. [DOI] [PubMed] [Google Scholar]
- 26.Hu W, Peng C, Luo W, et al. Graphene-based antibacterial paper. ACS Nano. 2010;4(7):4317–4323. doi: 10.1021/nn101097v. [DOI] [PubMed] [Google Scholar]
- 27.Liao KH, Lin YS, Macosko CW, Haynes CL. Cytotoxicity of graphene oxide and graphene in human erythrocytes and skin fibroblasts. ACS Appl Mater Interfaces. 2011;3(7):2607–2615. doi: 10.1021/am200428v. [DOI] [PubMed] [Google Scholar]
- 28.Chang Y, Yang ST, Liu JH, et al. In vitro toxicity evaluation of graphene oxide on A549 cells. Toxicol Lett. 2011;200(3):201–210. doi: 10.1016/j.toxlet.2010.11.016. [DOI] [PubMed] [Google Scholar]
- 29.Zhang X, Yin J, Peng C, et al. Distribution and biocompatibility studies of graphene oxide in mice after intravenous administration. Carbon. 2011;49(3):986–995. [Google Scholar]
- 30.Akhavan O, Ghaderi E, Akhavan A. Size-dependent genotoxicity of graphene nanoplatelets in human stem cells. Biomaterials. 2012;33(32):8017–8025. doi: 10.1016/j.biomaterials.2012.07.040. [DOI] [PubMed] [Google Scholar]
- 31.Cheng C, Nie S, Li S, et al. Biopolymer functionalized reduced graphene oxide with enhanced biocompatibility via mussel inspired coatings/anchors. J Mater Chem B. 2013;1:265–275. doi: 10.1039/c2tb00025c. [DOI] [PubMed] [Google Scholar]
- 32.Gurunathan S, Kalishwaralal K, Vaidyanathan R, et al. Biosynthesis, purification and characterization of silver nanoparticles using Escherichia coli. Colloids Surf B Biointerfaces. 2009;74(1):328–335. doi: 10.1016/j.colsurfb.2009.07.048. [DOI] [PubMed] [Google Scholar]
- 33.Hummers WS, Offeman RE. Preparation of graphitic oxide. J Am Chem Soc. 1958;80(6):1339–1339. [Google Scholar]
- 34.Wang G, Yang J, Park J, et al. Facile synthesis and characterization of graphene nanosheets. J Phys Chem C. 2008;112(22):8192–8195. [Google Scholar]
- 35.Shim HY, Park JH, Paik HD, Nah SY, Kim DS, Han YS. Acacetin-induced apoptosis of human breast cancer MCF-7 cells involves caspase cascade, mitochondria-mediated death signaling and SAPK/JNK1/2-c-Jun activation. Mol Cells. 2007;24(1):95–104. [PubMed] [Google Scholar]
- 36.Kuila T, Bose S, Khanra P, Mishra AK, Kim NH, Lee JH. Recent advances in graphene-based biosensors. Biosens Bioelectron. 2011;26(12):4637–4648. doi: 10.1016/j.bios.2011.05.039. [DOI] [PubMed] [Google Scholar]
- 37.Fernández-Merino MJ, Guardia L, Paredes JL, et al. Vitamin C as an innocuous and safe reductant for the preparation of graphene suspensions from graphite oxide. J Phys Chem C. 2010;114:6426–6432. [Google Scholar]
- 38.Chen D, Li L, Guo L. An environment-friendly preparation of reduced graphene oxide nanosheets via amino acid. Nanotechnology. 2011;22(32):325601. doi: 10.1088/0957-4484/22/32/325601. [DOI] [PubMed] [Google Scholar]
- 39.Moon IK, Lee J, Ruoff RS, Lee H. Reduced graphene oxide by chemical graphitization. Nat Commun. 2010;1:73. doi: 10.1038/ncomms1067. [DOI] [PubMed] [Google Scholar]
- 40.Yang X, Zhang X, Ma Y, Huang Y, Wang Y, Chen Y. Superparamagnetic graphene oxide-Fe3O4 nanoparticles hybrid for controlled targeted drug carriers. J Mater Chem. 2009;19:2710–2714. [Google Scholar]
- 41.Hassan HM, Abdelsayed V, Khder AE, et al. Microwave synthesis of graphene sheets supporting metal nanocrystals in aqueous and organic media. J Mater Chem. 2009;19:3832–3837. [Google Scholar]
- 42.Wang Y, Zhang P, Liu CF, Zhan L, Li YF, Huang CZ. Green and easy synthesis of biocompatible graphene for use as an anticoagulant. RSC Adv. 2012;2:2322–2328. [Google Scholar]
- 43.McAllister MJ, Li JL, Adamson DH, et al. Single sheet functionalized graphene by oxidation and thermal expansion of graphite. Chem Mater. 2007;19(18):4396–4404. [Google Scholar]
- 44.Niyogi S, Bekyarova E, Itkis ME, et al. Spectroscopy of covalently functionalized graphene. Nano Lett. 2010;10(10):4061–4066. doi: 10.1021/nl1021128. [DOI] [PubMed] [Google Scholar]
- 45.Kudin KN, Ozbas B, Schniepp HC, Prud’homme RK, Aksay IA, Ca R. Raman spectra of graphite oxide and functionalized graphene sheets. Nano Lett. 2008;8(1):36–41. doi: 10.1021/nl071822y. [DOI] [PubMed] [Google Scholar]
- 46.Eda G, Chhowalla M. Chemically derived graphene oxide: towards large-area thin-film electronics and optoelectronics. Adv Mater. 2010;22(22):2392–2415. doi: 10.1002/adma.200903689. [DOI] [PubMed] [Google Scholar]
- 47.Ferrari AC, Meyer JC, Scardaci V, et al. Raman spectrum of graphene and graphene layers. Phy Rev Lett. 2006;97(18):187401. doi: 10.1103/PhysRevLett.97.187401. [DOI] [PubMed] [Google Scholar]
- 48.Gao J, Liu F, Liu Y, Ma N, Wang Z, Zhang X. Environment-friendly method to produce graphene that employs vitamin C and amino acid. Chem Mater. 2010;22(7):2213–2218. [Google Scholar]
- 49.Wang Y, Shi Z, Yin J. Facile synthesis of soluble graphene via a green reduction of graphene oxide in tea solution and its biocomposites. ACS Appl Mater Interfaces. 2011;3(4):1127–1133. doi: 10.1021/am1012613. [DOI] [PubMed] [Google Scholar]
- 50.Li Y, Liu Y, Fu Y, et al. The triggering of apoptosis in macrophages by pristine graphene through the MAPK and TGF-beta signaling pathways. Biomaterials. 2012;33(2):402–411. doi: 10.1016/j.biomaterials.2011.09.091. [DOI] [PubMed] [Google Scholar]
- 51.Nel A, Xia T, Mädler L, Li N. Toxic potential of materials at the nanolevel. Science. 2006;311(5761):622–627. doi: 10.1126/science.1114397. [DOI] [PubMed] [Google Scholar]
- 52.Wang Y, Tan S, Wang J, et al. Direct imaging of apoptosis process of neural stem cells exposed to porous silica nanoparticles. Curr Nanosci. 2010;6(3):292–297. [Google Scholar]
- 53.Liu X, Gurel V, Morris D, et al. Bioavailability of nickel in single-wall carbon nanotubes. Adv Mater. 2007;19(19):2790–2796. [Google Scholar]
- 54.Fenoglio I, Tomatis M, Lison D, et al. Reactivity of carbon nanotubes: free radical generation or scavenging activity? Free Radical Biol Med. 2006;40(7):1227–1233. doi: 10.1016/j.freeradbiomed.2005.11.010. [DOI] [PubMed] [Google Scholar]
- 55.Shi L, Hernandez B, Selke M. Singlet oxygen generation from water-soluble quantum dot-organic dye nanocomposites. J Am Chem Soc. 2006;128(19):6278–6279. doi: 10.1021/ja057959c. [DOI] [PMC free article] [PubMed] [Google Scholar]
- 56.Hu W, Peng C, Lv M, et al. Protein corona-mediated mitigation of cytotoxicity of graphene oxide. ACS Nano. 2011;5(5):3693–3700. doi: 10.1021/nn200021j. [DOI] [PubMed] [Google Scholar]
- 57.Zhang L, Xia J, Zhao Q, Liu L, Zhang Z. Functional graphene oxide as a nanocarrier for controlled loading and targeted delivery of mixed anticancer drugs. Small. 2010;6(4):537–544. doi: 10.1002/smll.200901680. [DOI] [PubMed] [Google Scholar]
- 58.Ruiz ON, Fernando KA, Wang B, et al. Graphene oxide: a nonspecific enhancer of cellular growth. ACS Nano. 2011;5(10):8100–8107. doi: 10.1021/nn202699t. [DOI] [PubMed] [Google Scholar]
- 59.Li Y, Zhang P, Du Q, et al. Adsorption of fluoride from aqueous solution by graphene. J Colloid Interface Sci. 2011;363(1):348–354. doi: 10.1016/j.jcis.2011.07.032. [DOI] [PubMed] [Google Scholar]
- 60.Gurunathan S, Han JW, Eppakayala V, Kim JH. Biocompatibility of microbially reduced graphene oxide in primary mouse embryonic fibroblast cells. Colloids Surf B Biointerfaces. 2013;105:58–66. doi: 10.1016/j.colsurfb.2012.12.036. [DOI] [PubMed] [Google Scholar]
- 61.Sanchez VC, Jachak A, Hurt RH, Kane AB. Biological interactions of graphene-family nanomaterials: an interdisciplinary review. Chem Res Toxicol. 2011;25(1):15–34. doi: 10.1021/tx200339h. [DOI] [PMC free article] [PubMed] [Google Scholar]
- 62.Gurunathan S, Han JW, Dayem AA, Eppakayala V, Kim JH. Oxidative stress-mediated antibacterial activity of graphene oxide and reduced graphene oxide in Pseudomonas aeruginosa. Int J Nanomedicine. 2012;7:5901–5914. doi: 10.2147/IJN.S37397. [DOI] [PMC free article] [PubMed] [Google Scholar]
- 63.Tazawa H, Tatemichi M, Sawa T, et al. Oxidative and nitrative stress caused by subcutaneous implantation of a foreign body accelerates sarcoma development in Trp53+/− mice. Carcinogenesis. 2007;28(1):191–198. doi: 10.1093/carcin/bgl128. [DOI] [PubMed] [Google Scholar]


