Abstract
Several biomedical applications, such as detection of dysplasia, require selective interrogation of superficial tissue structures less than a few hundred microns thick. Techniques and methods have been developed to limit the penetration depth of light in tissue including the design of systems such as fiber-optic probes that have overlapping illumination and collection areas on the tissue surface. For such geometries, the diffusion approximation to the light transport equation typically does not apply and as a result there is no general model to extract tissue optical properties from reflectance measurements. In the current study, we employ Monte Carlo simulations to develop simple and compact analytical models for the light reflectance from these overlapping geometries. These models incorporate the size of the illumination and collection areas, the collection angle, the polarization of the incident light, and the optical properties of the sample. Moreover, these Monte Carlo simulations use the Whittle-Matérn model to describe scattering from spatially continuous refractive index media such as tissue, which is more general than models based on the conventionally used Henyey and Greenstein model. We validated these models on tissue-simulating phantoms. The models developed herein will facilitate the extraction of optical properties and aid in the design of optical systems employing overlapping illumination and collection areas including fiber-optic probes for in vivo tissue diagnosis.
1. Introduction
Tissue is functionally and structurally a multi-layered structure with several diseases originating in precise locations. For example, many precancerous dysplastic lesions arise from the epithelium and mucosae of several organs (breast, lung, colon, etc.). The thickness of the mucosal layer is typically on the order of several hundred microns. Light typically diffuses several millimeters below the tissue surface and as a consequence there has been an interest in the development of depth-selective light interrogation techniques and geometries, particularly those that can be implemented in a fiber-optic probe [1–13]. One of these geometries seeks to maximize the overlap between illumination and collection areas on the tissue surface [14, 15]. The overlap between these areas ensures a shorter penetration depth by limiting the radial extent photons can travel before being collected.. Clinical studies employing these geometries have proved successful in targeting the epithelium and detecting early precancerous lesions [16, 17].
For these overlapping geometries, there is still a need to relate the light reflectance to the illumination/collection geometry and to the optical properties of the sample. These optical properties include the scattering coefficient μs, the anisotropy factor g, the reduced scattering coefficient ( ), the absorption coefficient μa, and the functional type (shape) of the refractive index correlation function [18]. For many biophotonic applications, the diffusion approximation to the light transport equation has proved invaluable in modeling the dependence of light reflectance on these optical properties. Use of this approximation hinges on several assumptions, one of them being that the distance between source and detector is greater than . For techniques whose geometries violate this assumption, alternative models must be employed. Analytical models have been developed for lenseless probes where the distance between the illumination and collection fibers is less than such as the case in differential path length [19], elastic scattering [8], and single fiber reflectance [20] spectroscopies. However, these models cannot be directly applied to probes that use lenses or other methods to maximize the overlap of illumination and collection areas or to systems that employ polarization-gating. Quantifying the relation between optical properties and reflectance in the case of overlapping illumination-collection areas will enable the accurate recovery of optical properties as well as aid in system design.
In this paper, we use Monte Carlo (MC) simulations to develop a compact analytical model of light reflectance from geometries with illumination-collection overlap in spatially continuous refractive index media. We further extend this model to take into the polarization of the incident and detected light in order to extend our results to techniques that employ polarization-gating for enhanced depth-selectivity. Our models explicitly take into account the size of the illumination-collection areas and detection angle and can therefore be applicable across a wide range of system designs. We then validate our results on tissue-simulating phantoms. Our results can be used to extract the optical properties from a sample using a probe or other optical setup having overlapping illumination-collection areas. This should aid in the development of diagnostic probes or systems that aim to quantify the structural and functional properties of superficial tissue layers.
2. Materials and Methods
2.1 Polarization-sensitive Monte Carlo Simulations
The basis of our Monte Carlo simulations was publicly available polarized light Monte Carlo algorithms developed by Ramella-Roman et al [21, 22]. We have previously modified the code to track photons as functions of polarization, exit radius, collection angle (θc), and maximum depth and path length travelled (z) [14]. Reflection, refraction, and alteration of the Stokes vector at the sample/environment interface was computed using Snell’s Law and the Stokes formalism of the Fresnel equations.18 The initial entry point of photon into the sample was chosen randomly within a circular area of radius R while the initial angle of propagation was normal to the sample surface. The initial Stoke’s vector was [1 0 0 0] in the case of the unpolarized simulations or [1 1 0 0] in the case of the linearly polarized simulations. Propagation of light in the medium was controlled by μa, μs, and the phase function. We employed a phase function based on the Whittle-Matérn model [18, 23] that describes the refractive index correlation properties of continuous random media. The phase function for incident light with initial Stokes vector [Io Qo Uo Vo] can be written as
| (1) |
where θ is the angle of scattering, Φ is the angle of rotation into the scattering plane, and k is the wavenumber. The spectral density Φ at spatial frequency κ is given by:
| (2) |
where the parameters lc, dn2, m denote the index correlation distance, variance of the refractive index fluctuations, and the shape of refractive index correlation function respectively. The variable N is a normalization parameter. When m is between 1.5 and 2, the shape of the refractive index correlation function follows a stretched exponential function. A value of m = 2 results in an exponential shape while as m → ∞, the shape converges to a Gaussian distribution. It has been shown that when klc ≫ 1 (where k is the wavenumber) and 1 < m < 2, the reduced scattering coefficient is proportional to λ2m-4[18]. Photons were collected if they exited the medium within the illumination area. The collection angle (θc) with respect to the surface normal as well as the total path length traveled was recorded for each exiting photon. Collection angles were stored in 5 bins from 0–90°. The Stokes vector of all collected photons were superimposed once rotated into the detector reference frame. Mueller matrix multiplication was used to recover the co-polarized and cross-polarized collected light intensities. Simulations were repeated across several different optical and geometry properties. These included Rμs = 1–20, g = [0.75, 0.8, 0.85, 0.9 0.93], and m = [1.1 1.3 15. 1.75 1.99].
2.2 Light Reflectance Model
The reflected light intensity from a homogeneous turbid sample with absorption coefficient μa can be written according to the modified Beer-Lambert expression [8, 24, 25]:
| (3) |
where Is the intensity that would be collected from the sample with the same scattering properties but μa = 0 and where is the mean average path length of photons defines as [24]:
| (4) |
with 〈L〉μa being the mean pathlength of photons traversing a medium with absorption coefficient μa. In a previous publication, we have related Is to and m for the co-polarized reflected signal (I||) and the cross-polarized reflectance signal (I⊥) [26]. In brief, the derived expressions for these signals were found to be:
| (5) |
Where c1 and c2 are proportionality constants. In the current study, we use the same MC methods to broaden the applicability of Eq. 6 to include the effect of illumination/collection radius R and collection angle. We found the form of these equations to be:
| (6) |
Where c is a calibration factor that must be determined experimentally and f1 and f2 are functions of m and θc. The next step to determine a complete model of light reflectance is to elucidate the functional relationship between 〈L〉 and the optical properties of the sample (μs, ua, g, m) as well as the illumination collection geometry (R, θc). We used the MC method outlined above to accomplish this task. We tracked the path length of each collected photon for a variety of optical properties and geometries. The average path length for a given set of optical properties and geometry can be calculated from the MC simulations directly.
| (7) |
where Li is the path length of the ith photon, Wi is the weight of the ith photon, and TPC is the total number of photons collected. Note that the ua of the MC simulation itself is always zero but that the average path length of a non-zero ua can be computed from Eq. 7. We looked at four different four different polarization-gated reflectance signals: the co-polarized signal where the collected light has the same polarization as the incident light , the cross-polarized signal where the reflected light has an orthogonal polarization to the incident light , the total signal which is the sum of the co and cross-polarized signals , and the delta-polarized signal which is the difference between the co and cross-polarized signals. After tracking 〈L〉 for each of these signals, we fit as a function of and Rμa. To aid in this endeavor, we used a surface fitting program known as Table Curve 3D (Systat). To limit the complexity of the resulting equation and discourage overfitting, we capped the number of fitting coefficients in the model to three. In order to ensure accuracy, we selected fitting equations whose goodness of fit R2 was greater than 0.95. For the case of the total signal, we found the following expression accurately modeled the average path length:
| (8) |
where [a1 a2 a3] are fitting parameters. We further extended Eq. 8 to take into the account the shape of the refractive index correlation function and the collection angle by recording the behavior of [a1 a2 a3] as functions of m and θc. The effective path length can be calculated from Eq. 4:
| (9) |
The form of Eq 8. and Eq. 9 also characterized the behavior of the average path length under linearly polarized illumination and co-polarized detection such that
| (10) |
Here [b1 b2 b3] are another set of fitting parameters which can also be a function of m. The value will have the same form as Eq. 9 but with [b1 b2 b3] substituted for [a1 a2 a3]. For linearly polarized illumination, with cross-polarized detection the following equation with fitting coefficients [c1 c2 c3] was used to fit the average path length:
| (11) |
Again applying Eq. 4 yields
| (12) |
Finally, the average and effective path length for the ΔI signal were modeled as:
| (13) |
and
| (14) |
These accuracy and validity of these expressions were then confirmed both by comparison to the original MC data as well as on tissue phantoms described below.
2.3 Tissue Phantoms
We prepared tissue simulating phantoms consisting of deionized water, 20% Intralipid (Sigma-Aldrich), and Evans Blue dye (Sigma-Aldrich) which has peak absorption at 611 nm. Known amounts of the Intralipid and dye were added to water to achieve the desired values of and μa. These values as a function of wavelength from 450–650 nm were confirmed with spectral reflectance and transmittance measurements using an integrating sphere in conjunction with the inverse adding-doubling algorithm [27].
Instrumentation
Measurements from phantoms were taken with a polarization-gated spectroscopy probe that has been characterized and described in detail in previous publications [14, 16, 17]. In brief, the probe consists of three 200 μm diameter fibers arranged in an equilateral triangle as shown in Fig. 1 (a). One fiber serves as an illumination channel and the remaining two fibers serve to collect backscattered light from the sample. A polarizing sheet is placed over the illumination fiber and one of the collection fibers while another polarizing sheet oriented orthogonally to the first polarizing sheet is placed on the remaining collection fiber. A gradient refractive index (GRIN) lens is used to collimate the incident light, focus light backscattered from the sample onto the collections fibers, and ensure that the illumination and collection areas overlap on the sample surface as shown in the ray tracing in Fig. 1(b). The illumination fiber is connected to a white light emitting diode (WT&T) while the collection fibers deliver the received light to two fiber optic spectrometers (Ocean Optics). The radius (R) of the illumination/collection areas on the sample surface is 400 μm and the angle (θc) between illumination and collection beams is ~14°
Figure 1.
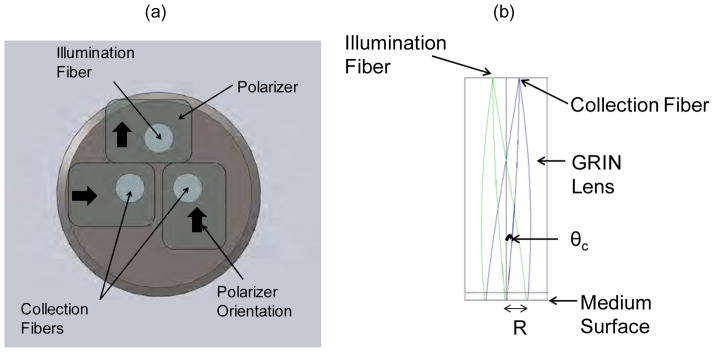
Polarization-gated probe used for tissue-simulating phantom measurements. (a) Schematic of the fiber tip end of the polarization-gating probe. (b) Ray tracing of the illumination and collection beams through the probe. The main geometrical parameters of the probe are R and θc.
2.4 Data Acquisition and Analysis
We constructed a scattering-only phantom consisting of only Intralipid and water without any dye (μa ≈ 0). Then, 15 mL of the phantom was placed inside a cylindrical beaker and the probe tip was submerged into the solution. A series of 20 individual spectral measurements were taken from the solution in the wavelength range of 450–650 nm. A background measurement (IBG) taken in water was also taken and subtracted from the raw phantom signal (Iraw). Next the background subtracted signal was normalized to the reflectance (IWS) from a white 99% reflectance standard (Labsphere). The normalized collected intensities for the co, cross, total, and delta signals were recorded for each of the 20 measurements and then averaged together. This average value defines the scattering intensity Is in Eq. 4 for the various signals. The value of as a function of wavelength for this scattering only phantom were determined with an integrating sphere as described in Section 2.3. Next, a known amount of Evans Blue dye was added to the scattering phantom to increase the absorption coefficient. The volume of dye added was insignificant compared to the total volume and thus the scattering properties were unchanged. An additional 20 measurements were taken with the polarization-gated probe from this scattering and absorption phantom and normalized as described above. The average of these 20 measurements defines the I term in Eq.4. The values of and μa over the wavelength range 450–650 nm were determined from integrating sphere measurements. The mean effective path length was then experimentally determined by inverting Eq. 4:
| (15) |
Finally, the relationship between , m, and the scattering intensity Is was determined by fitting Eq. 6 to the spectral values of from the scattering only phantom.
3. Results
3.1 Monte Carlo Model of the Average Path length
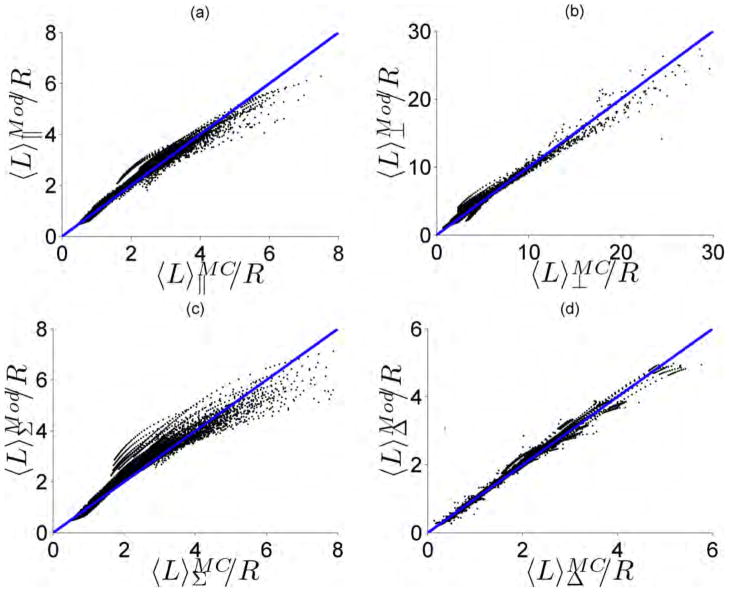
The functional relationships between the path length equation coefficients [a1-d3] from Eqs. 8–14 and θc and m are shown in Table 1. Using the values in Table 1, we compared the outputs of the path length models (Mod) in Eqs. 8, 10–11 with the simulated Monte Carlo data for a range of optical properties and probe geometries: g = [0.75, 0.8, 0.85, 0.9 0.93], Rμs = [1, 3, 5, 8, 12, 16, 20], Rμa = [0 – 1], m = [1.1, 1.3, 1.5, 1.75, 1.99], and θc = [0–18°, 18– 27°, 27–45°]. The results of this comparison are shown in Fig. 2 (a–d) for the co-polarized, cross-polarized, total, and delta signals respectively. The simulation and the model are strongly correlated with a Pearson correlation coefficient greater than 0.9 for all cases. In addition, the data points are closely packed around the line of unity indicating agreement between the MC simulation and model. We quantified this agreement by calculating the median percentage difference between the simulation and model and found it to be 5%, 11%, 7%, and 4% for the co-polarized, cross-polarized, total, and delta signals respectively.
Table I.
Fitting Coefficients for Pathlength Models
| Parameter | Functional Form | X1 | X2 | X3 |
|---|---|---|---|---|
| a1 | x1+x2m+x3θ3 | 1.061 | 0.177 | 4.71E-7 |
| a2 | x1+x2m+x3θ | −1.511 | −0.071 | −0.00365 |
| a3 | x1+x2m2ln(m)+x3θ0.5 | −0.232 | −0.017 | 0.01408 |
| b1 | x1+x2m+x3θ3 | 0.801 | 0.206 | −4.94E-7 |
| b2 | (x1+x2m+x3θ1.5)−1 | −0.754 | 0.059 | 0.000159 |
| b3 | (x1+x2m+x3θ1.5)−1 | −2.921 | −0.546 | −0.00849 |
| c1 | (x1+x2m−0.5+x3θ−0.5)−1 | 44.816 | −86.180 | −41.285 |
| c2 | (x1+x2m3+x3θ3)−1 | 1.961 | 0.047 | −4.69E-6 |
| c3 | (x1+x2m−1+x3θ0.5)−1 | 4.022 | 2.538 | −0.16 |
| d1 | (x1+x2m0.5+x3θ0.5)−1 | 7.864 | 0.924 | −0.858 |
| d2 | x1+x2m+x3θ1.5 | 0.872 | −0.037 | 0.000709 |
| d3 | x1+x2m−1+x3θ0.5 | 0.824 | −0.088 | −0.0265 |
Figure 2.
Simulated Monte Carlo (MC) path length versus the path length returned by the Monte Carlo derived model (Mod) for the (a) Co-polarized signal (b) Cross-polarized signal (c) Total signal and (d) Delta signal. The line of unity is shown for comparative purposes.
3.2 Experimental Verification of the Mean Average Path length Models
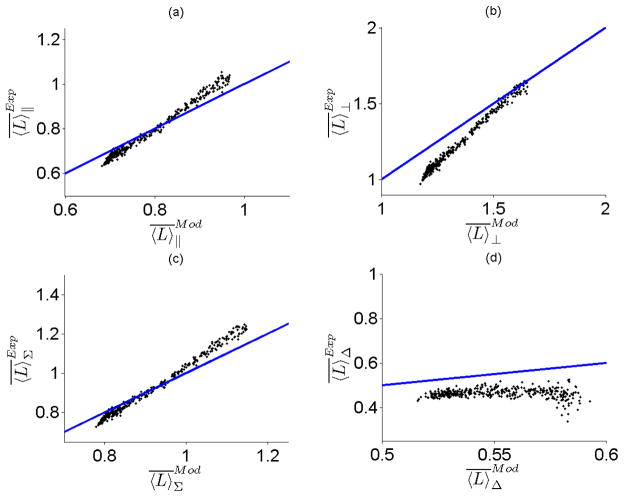
We created the Intralipid and Evans Blue dye phantom as described in Section 2.3. The values of and μa were determined as a function of wavelength using integrating sphere measurements and are shown Fig. 3 (a) and (b) respectively. Knowledge of these optical properties allowed us to determine the mean average path length of light traversing the phantom experimentally by using Eq. 15. Since and μa varied by wavelength, we were able to calculate for many and μa value combinations from a single spectral measurement from 450–650 nm . Next, we compared our experimental calculations of with those we found from our Monte Carlo model in Eqs. 10, 12,14. The results of this comparison are shown in Fig. 4 (a–d). The correlation between our theoretical and experimental measurements of is greater than 0.99 for the co-polarized, cross-polarized and total signal in Fig. 4 (a–c). The correlation coefficient for the delta signal in Fig. 4 (d) was small primarily because did not change significantly across the range of and μa values tested. The median (max) percentage error between theory and experimental determinations of was 3.5 % (8.3%), 10% (17.3%), 3.1% (8.9%), and 14.7% (23%) for the co-polarized, cross-polarized, total, and delta signals respectively. We attribute the increased error and higher dispersion in the data points for the delta signal to the fact that ratio of can be close to unity due to the smaller path length the delta-polarized signal traverses through the phantom. This makes the calculation of from Eq. 15 more sensitive to noise and experimental error. The overall combination of high correlation and low percentage error between theory and experiment leads us to conclude that the Monte Carlo model for the mean average path length can accurately predict for different polarization signals.
Figure 3.
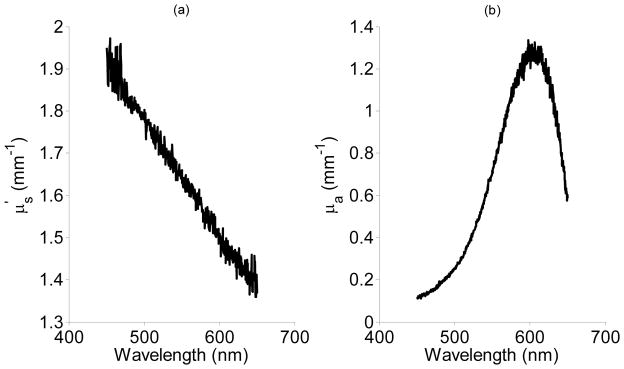
Spectral curves for (a) and μa (b) that were determined from the Intralipid/Dye phantom using reflectance and transmittance measurements from an integrating sphere coupled with the inverse adding-doubling method.
Figure 4.
Mean average path length from the MC-derived model plotted versus the mean average path length calculated using experimental measurements with the polarization-gated spectroscopy probe for (a) Co-polarized signal (b) Cross-polarized signal (c) Total Signal and (d) Delta signal. The line of unity is shown for comparative purposes.
3.3 Experimental Verification of the Model for the Scattering Intensity Is
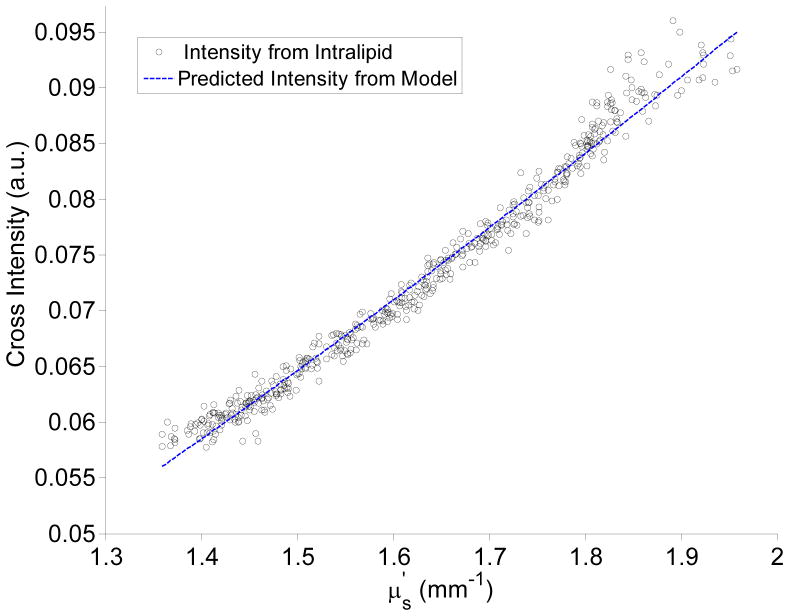
In addition to the mean average path length, the next variable that must be characterized in order to analyze light reflectance using the modified Beer-Lambert Law of Eq. 4 is the scattering intensity Is. Our Monte Carlo model for Is is given in Eq. 6 with the functional forms and fitting coefficients shown in Table II. We sought to validate these expressions on the scattering Intralipid phantom that was used for the path length analysis. This experimental validation can only be performed for the cross-polarized signal because the co-polarized intensity is sensitive to the shape of the phase function whereas the cross-polarized intensity is mainly determined by .[28] The shape of the phase function for the tissue-simulating Whittle-Matérn model and the Intralipid will be different and thus co-polarized agreement between Monte Carlo and experimental Intralipid measurements is a priori not expected. For the cross-polarized comparison, we took the m-value of the Intralipid to be the value that best fit the Whittle-Matern derived equation to the integrating sphere data in Fig. 3(a). The extracted m-value was found to be 1.55. This is an approximation due to the dissimilarity between the Whittle-Matérn model and the Intralipid. Next, we used the extracted m-value of 1.55 in Eq. 6 to predict the cross-polarized reflectance intensity that would be measured from the Intralipid phantom. The result of this comparison is shown in Fig. 5. The mean percentage error between the power fit of Eq. 6 and the experimental data is 1.4% indicating that Eq. 6 accurately summarizes the dependence of on both and m. The value of c was found to be 0.136. It should be noted that the value of c will be dependent on the type of intensity normalization used and should be calculated independently.
Table II.
Functional Forms for Scattered Reflectance
| Function | Form | X1 | X2 | X3 | |
|---|---|---|---|---|---|
|
|
x1+x2m−1+x3θ−1 | 9.06E5 | −1.43E5 | −5.13E5 | |
|
|
exp(x1+x2m+x3θ−2) | 15 | −0.564 | −81.3 | |
|
|
x1+x2m+x3θ0.5 | 1.105 | 0.225 | 0.0129 | |
|
|
x1+x2m+x3θ1.5 | 0.218 | 0.357 | 4.28E-4 |
Figure 5.
Comparison of cross-polarized scattered intensities from an Intralipid phantom with those predicted by the Monte Carlo derived model for the scattered intensity.
3.4 Applicability to Systems that use Unpolarized Illumination and Detection
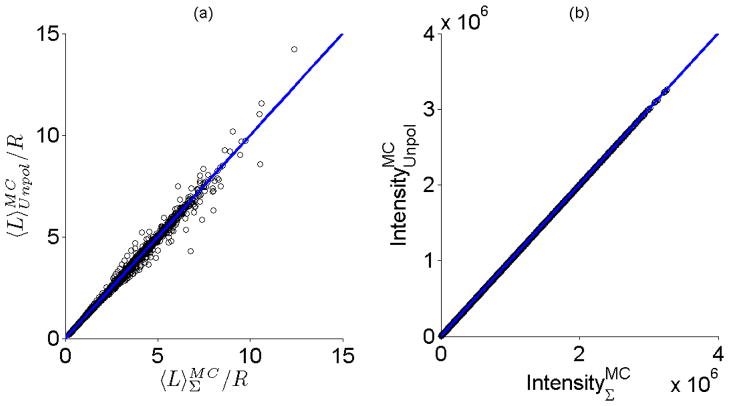
Up until now, we have considered results derived from the analysis of signals that compose polarization-gated systems. However, for the purposes of analyzing the modified Beer-Lambert Law in Eq. 4, our results can be extended to systems that use unpolarized illumination and detection schemes. This can be seen by examining Fig. 6 where the average path length and total reflectance intensity of the total signal from polarization-gating is plotted versus the average path length and total reflectance intensity obtained using unpolarized illumination/detection and using the same set of optical properties and illumination/collection geometries. The correlation between the average path length of these two signals is greater than 0.99 and the mean percentage error is 0.2% while the mean percentage error between the corresponding reflectance intensities is less than 0.1%. These results suggest that the model developed for the total signal from polarization-gating can also be applied to systems that employ unpolarized illumination and detection.
Figure 6.
Results using polarized illumination and the total reflectance signal mirror can be applied to the case of unpolarized illumination and detection. (a) Comparison of average path lengths and reflectance intensities from Monte Carlo simulations using polarized illumination and (co-polarized + cross-polarized) detection with simulations using unpolarized illumination and detection . The line of unity is shown for comparative purposes. (b) Comparison of the reflectance intensity for polarized illumination and (co + cross) detection with the total reflectance intensity in the case of unpolarized illumination .
4. Discussion
We have presented an analytical model based on the modified Beer-Lambert Law for light reflectance that can be applied to fiber-optic probes or other optical systems that employ overlapping illumination and collection areas on the sample surface. Our model is flexible and can be used both for different illumination/collection geometries and different linear polarization states of the incident and reflected light. The model incorporates the two most common sample optical properties of interest: the reduced scattering and absorption coefficients. In addition, our model takes into account the shape of the refractive index correlation function, an attribute that is directly relevant to spatially continuous refractive index media such as biological tissue.
Validation of our analytical model was completed in two main ways. The first method was to compare the analytical model results directly with the Monte Carlo simulations from which the models were derived. As demonstrated in Fig. 2, the agreement between Monte Carlo and our model led us to conclude that our model was a robust and accurate condensation of the Monte Carlo simulations. This still left open the question of whether the Monte Carlo simulations and therefore the model could be applied in an experimental setting. Our second method of validation was to then compare our models of the mean average path length and intensity with that obtained experimentally from an Intralipid and Evans Blue dye phantom. However, this method has inherent limitations. The Whittle-Matérn model is meant to simulate biological tissue where the refractive index distribution is spatially continuous and the scattering is weak enough for the Born approximation to be applied. Currently, there is no phantom that conforms to both of these assumptions and hence the phase matrix will be different between the model and current phantoms. In the case of polarized light, it is known that the depolarization properties of lipid and microsphere phantoms differ from those of tissue, possibly because of the difference in the shape of their respective phase functions [29, 30]. Even with these caveats, the Monte Carlo model can still be compared with the Intralipid phantom if the parameter of interest is largely independent of the phase function shape. This is true for the pathlength which is mainly dependent on and μa and only weakly dependent on m as shown in Eqs. 8–14. The same is true for the cross-polarized reflectance. However, since the co-polarized reflectance (and therefore also the total and delta reflectance) is dependent on phase function shape, a comparison of this parameter between model and experiment is not possible at this time. Development of more tissue-like phantoms may allow us to overcome this hurdle in the future. For the comparisons we were able to make and shown in Figs. 4–5, there was excellent agreement between our Monte Carlo model and the polarization-gated Intralipid measurements. We were not able to test the model neither across the full range of optical properties nor across the full range of possible probe geometries. However, we believe that the good agreement we obtained in this study is suggestive that the model would be successful for other geometries as well. We plan on conducting future studies with alternate probe geometries to confirm this.
The models that we have derived have several applications. The most obvious one is analyzing and extracting optical properties from experimental measurements. A model also based on the modified Beer-Lambert Law has been used for this purpose in elastic scattering spectroscopy[8]. We have previously isolated the shape of the refractive index correlation function from scattered intensity measurements in an animal model of colon carcinogenesis and have shown that is a diagnostic parameter [26]. In addition, our equations for the path length can be used to design probes with an appropriate sampling volume or whose path length is the least sensitive to changes in the optical properties. This can be beneficial in making model-based approaches using Beer’s Law more robust [15, 31]. Finally, implicit in our models of the reflectance for the co-polarized and cross-polarized signals is another model for the degree of polarization defined as . The degree of polarization has been previously modeled using Mie theory and used as a marker in oral cancer [32, 33]. As such, the analysis of the degree of polarization from tissue has been mostly based on the assumption of discrete scatters. In contrast, our model directly relates the scattered intensity to the shape of the refractive index correlation function from continuous refractive index media and may therefore be more accurate when applied to biological tissue.
In conclusion, we have developed an analytical model of light reflectance for systems that employ overlapping illumination and collection areas. The model was validated both with Monte Carlo and tissue simulating phantoms. We expect that this model will aid in the development and characterization of systems that aim to target superficial structures using illumination/collection area overlap.
Acknowledgments
NIH grants R01CA128641, R01CA156186, and R01 EB003682.
References
- 1.Amelink A, Sterenborg HJ. Measurement of the local optical properties of turbid media by differential path-length spectroscopy. Appl Opt. 2004;43:3048–3054. doi: 10.1364/ao.43.003048. [DOI] [PubMed] [Google Scholar]
- 2.Arifler D, Schwarz RA, Chang SK, Richards-Kortum R. Reflectance spectroscopy for diagnosis of epithelial precancer: model-based analysis of fiber-optic probe designs to resolve spectral information from epithelium and stroma. Appl Opt. 2005;44:4291–4305. doi: 10.1364/ao.44.004291. [DOI] [PMC free article] [PubMed] [Google Scholar]
- 3.Backman V, Gurjar R, Badizadegan K, Itzkan I, Dasari RR, Perelman LT, Feld MS. Polarized light scattering spectroscopy for quantitative measurement of epithelial cellular structures in situ. Selected Topics in Quantum Electronics, IEEE Journal of. 1999;5:1019–1026. [Google Scholar]
- 4.Jacques SL, Roman JR, Lee K. Imaging superficial tissues with polarized light. Lasers Surg Med. 2000;26:119–129. doi: 10.1002/(sici)1096-9101(2000)26:2<119::aid-lsm3>3.0.co;2-y. [DOI] [PubMed] [Google Scholar]
- 5.Kim YL, Yang L, Wali RK, Roy HK, Goldberg MJ, Kromin AK, Kun C, Backman V. Simultaneous measurement of angular and spectral properties of light scattering for characterization of tissue microarchitecture and its alteration in early precancer. Selected Topics in Quantum Electronics, IEEE Journal of. 2003;9:243–256. [Google Scholar]
- 6.Lin SP, Wang L, Jacques SL, Tittel FK. Measurement of tissue optical properties by the use of oblique-incidence optical fiber reflectometry. Appl Opt. 1997;36:136–143. doi: 10.1364/ao.36.000136. [DOI] [PubMed] [Google Scholar]
- 7.Nieman L, Myakov A, Aaron J, Sokolov K. Optical sectioning using a fiber probe with an angled illumination-collection geometry: evaluation in engineered tissue phantoms. Appl Opt. 2004;43:1308–1319. doi: 10.1364/ao.43.001308. [DOI] [PubMed] [Google Scholar]
- 8.Reif R, A’Amar O, Bigio IJ. Analytical model of light reflectance for extraction of the optical properties in small volumes of turbid media. Appl Opt. 2007;46:7317–7328. doi: 10.1364/ao.46.007317. [DOI] [PubMed] [Google Scholar]
- 9.Schwarz RA, Arifler D, Chang SK, Pavlova I, Hussain IA, Mack V, Knight B, Richards-Kortum R, Gillenwater AM. Ball lens coupled fiber-optic probe for depth-resolved spectroscopy of epithelial tissue. Opt Lett. 2005;30:1159–1161. doi: 10.1364/ol.30.001159. [DOI] [PMC free article] [PubMed] [Google Scholar]
- 10.Siegel MP, Kim YL, Roy HK, Wali RK, Backman V. Assessment of blood supply in superficial tissue by polarization-gated elastic light-scattering spectroscopy. Appl Opt. 2006;45:335–342. doi: 10.1364/ao.45.000335. [DOI] [PubMed] [Google Scholar]
- 11.Skala MC, Palmer GM, Zhu C, Liu Q, Vrotsos KM, Marshek-Stone CL, Gendron-Fitzpatrick A, Ramanujam N. Investigation of fiber-optic probe designs for optical spectroscopic diagnosis of epithelial pre-cancers. Lasers Surg Med. 2004;34:25–38. doi: 10.1002/lsm.10239. [DOI] [PMC free article] [PubMed] [Google Scholar]
- 12.Sokolov K, Drezek R, Gossage K, Richards-Kortum R. Reflectance spectroscopy with polarized light: is it sensitive to cellular and nuclear morphology. Opt Express. 1999;5:302–317. doi: 10.1364/oe.5.000302. [DOI] [PubMed] [Google Scholar]
- 13.Wang AM, Bender JE, Pfefer J, Utzinger U, Drezek RA. Depth-sensitive reflectance measurements using obliquely oriented fiber probes. J Biomed Opt. 2005;10:44017. doi: 10.1117/1.1989335. [DOI] [PubMed] [Google Scholar]
- 14.Turzhitsky VM, Gomes AJ, Kim YL, Liu Y, Kromine A, Rogers JD, Jameel M, Roy HK, Backman V. Measuring mucosal blood supply in vivo with a polarization-gating probe. Appl Opt. 2008;47:6046–6057. doi: 10.1364/ao.47.006046. [DOI] [PMC free article] [PubMed] [Google Scholar]
- 15.Fang C, Brokl D, Brand RE, Liu Y. Depth-selective fiber-optic probe for characterization of superficial tissue at a constant physical depth. Biomed Opt Express. 2011;2:838–849. doi: 10.1364/BOE.2.000838. [DOI] [PMC free article] [PubMed] [Google Scholar]
- 16.Gomes AJ, Roy HK, Turzhitsky V, Kim Y, Rogers JD, Ruderman S, Stoyneva V, Goldberg MJ, Bianchi LK, Yen E, Kromine A, Jameel M, Backman V. Rectal mucosal microvascular blood supply increase is associated with colonic neoplasia. Clin Cancer Res. 2009;15:3110–3117. doi: 10.1158/1078-0432.CCR-08-2880. [DOI] [PMC free article] [PubMed] [Google Scholar]
- 17.Roy HK, Gomes A, Turzhitsky V, Goldberg MJ, Rogers J, Ruderman S, Young KL, Kromine A, Brand RE, Jameel M, Vakil P, Hasabou N, Backman V. Spectroscopic microvascular blood detection from the endoscopically normal colonic mucosa: biomarker for neoplasia risk. Gastroenterology. 2008;135:1069–1078. doi: 10.1053/j.gastro.2008.06.046. [DOI] [PMC free article] [PubMed] [Google Scholar]
- 18.Rogers JD, Capoglu IR, Backman V. Nonscalar elastic light scattering from continuous random media in the Born approximation. Opt Lett. 2009;34:1891–1893. doi: 10.1364/ol.34.001891. [DOI] [PMC free article] [PubMed] [Google Scholar]
- 19.Kanick SC, Sterenborg HJ, Amelink A. Empirical model description of photon path length for differential path length spectroscopy: combined effect of scattering and absorption. J Biomed Opt. 2008;13:064042. doi: 10.1117/1.3050424. [DOI] [PubMed] [Google Scholar]
- 20.Kanick SC, Sterenborg HJ, Amelink A. Empirical model of the photon path length for a single fiber reflectance spectroscopy device. Opt Express. 2009;17:860–871. doi: 10.1364/oe.17.000860. [DOI] [PubMed] [Google Scholar]
- 21.Ramella-Roman JC, Prahl SA, Jacques SL. Three Monte Carlo programs of polarized light transport into scattering media: part II. Opt Express. 2005;13:10392–10405. doi: 10.1364/opex.13.010392. [DOI] [PubMed] [Google Scholar]
- 22.Ramella-Roman J, Prahl S, Jacques S. Three Monte Carlo programs of polarized light transport into scattering media: part I. Opt Express. 2005;13:4420–4438. doi: 10.1364/opex.13.004420. [DOI] [PubMed] [Google Scholar]
- 23.Radosevich A, Rogers J, Turzhitsky V, Mutyal N, Yi J, Roy H, Backman V. Polarized Enhanced Backscattering Spectroscopy for Characterization of Biological Tissues at Subdiffusion Length-scales. Selected Topics in Quantum Electronics, IEEE Journal. 2011:1–1. doi: 10.1109/JSTQE.2011.2173659. [DOI] [PMC free article] [PubMed] [Google Scholar]
- 24.Sassaroli A, Fantini S. Comment on the modified Beer-Lambert law for scattering media. Phys Med Biol. 2004;49:N255–257. doi: 10.1088/0031-9155/49/14/n07. [DOI] [PubMed] [Google Scholar]
- 25.Tsuchiya Y. Photon path distribution and optical responses of turbid media: theoretical analysis based on the microscopic Beer-Lambert law. Phys Med Biol. 2001;46:2067–2084. doi: 10.1088/0031-9155/46/8/303. [DOI] [PubMed] [Google Scholar]
- 26.Gomes A, Ruderman S, DelaCruz M, Wali RK, Roy H, Backman V. In vivo measurement of the shape of the tissue refractive index correlation function and its application to detection of colorectal field carcinogenesis. J Biomed Opt. :1. doi: 10.1117/1.JBO.17.4.047005. (In-Press) [DOI] [PMC free article] [PubMed] [Google Scholar]
- 27.Prahl SA, van Gemert MJ, Welch AJ. Determining the optical properties of turbid media by using the adding-doubling method. Appl Opt. 1993;32:559–568. doi: 10.1364/AO.32.000559. [DOI] [PubMed] [Google Scholar]
- 28.Gomes AJ, Ruderman S, DelaCruz M, Wali RK, Roy HK, Backman V. In vivo measurement of the shape of the tissue-refractive-index correlation function and its application to detection of colorectal field carcinogenesis. Journal of Biomedical Optics. 2012;17:047005–047008. doi: 10.1117/1.JBO.17.4.047005. [DOI] [PMC free article] [PubMed] [Google Scholar]
- 29.Ahmad M, Alali S, Kim A, Wood MF, Ikram M, Vitkin IA. Do different turbid media with matched bulk optical properties also exhibit similar polarization properties? Biomed Opt Express. 2011;2:3248–3258. doi: 10.1364/BOE.2.003248. [DOI] [PMC free article] [PubMed] [Google Scholar]
- 30.Sankaran V, Schonenberger K, Walsh JT, Jr, Maitland DJ. Polarization discrimination of coherently propagating light in turbid media. Appl Opt. 1999;38:4252–4261. doi: 10.1364/ao.38.004252. [DOI] [PubMed] [Google Scholar]
- 31.Mourant JR, Bigio IJ, Jack DA, Johnson TM, Miller HD. Measuring absorption coefficients in small volumes of highly scattering media: source-detector separations for which path lengths do not depend on scattering properties. Appl Opt. 1997;36:5655–5661. doi: 10.1364/ao.36.005655. [DOI] [PubMed] [Google Scholar]
- 32.Myakov A, Nieman L, Wicky L, Utzinger U, Richards-Kortum R, Sokolov K. Fiber optic probe for polarized reflectance spectroscopy in vivo: design and performance. J Biomed Opt. 2002;7:388–397. doi: 10.1117/1.1483314. [DOI] [PubMed] [Google Scholar]
- 33.Nieman LT, Kan CW, Gillenwater A, Markey MK, Sokolov K. Probing local tissue changes in the oral cavity for early detection of cancer using oblique polarized reflectance spectroscopy: a pilot clinical trial. J Biomed Opt. 2008;13:024011. doi: 10.1117/1.2907450. [DOI] [PubMed] [Google Scholar]


