

Abstract
Persistent activity is thought to mediate working memory during behavior. Can it also occur during sleep? We show that the membrane potential of medial entorhinal cortex layer III (MECIII) neurons, a gateway between neocortex and hippocampus, showed spontaneous, stochastic persistent activity in vivo in mice during Up-Down state oscillations (UDS). This persistent activity was locked to the neocortical Up states with a short delay, but persisted over several cortical UDS cycles. Lateral entorhinal (LECIII) neurons did not show significant persistence, and current injections similar to those used in vitro failed to elicit persistence in vivo, thus implicating network mechanisms. Hippocampal CA1 neurons’ activity was reduced during neocortical Up states, but was increased during MECIII persistent states. These results provide the first direct evidence for persistent activity in MECIII neurons in vivo, and reveal its contribution to cortico-hippocampal interaction, which could be involved in working memory and learning of long behavioral sequences during behavior, and memory consolidation during sleep.
During sleep, under anesthesia, and in vitro, neocortical activity shows low-frequency, large amplitude oscillations known as slow oscillations, or Up-Down states (UDS)1–4. UDS are thought to coordinate temporal interactions between neocortex and hippocampus5–9, and contribute to several forms of learning and memory9–16. Hence it is crucial to understand the precise mechanisms governing cortico-hippocampal interactions during UDS.
Paradoxically, even though the neocortex is the primary source of excitatory input to the hippocampus, when neocortical activity shows synchronized UDS the hippocampus exhibits large irregular activity (LIA)17, which has also been viewed as an additional slow oscillation9,18, that is only relatively weakly tied to neocortical UDS7,8. Since the entorhinal cortex is a gateway between the neocortex and the hippocampus, we hypothesized that the entorhinal cortex could contribute to this decoupling between neocortical UDS and hippocampal LIA. Particularly well-suited for this purpose would be entorhinal cortex layer III neurons (ECIII) that directly project to the hippocampal output area CA119,20. There are two major subdivisions of ECIII, lateral and medial entorhinal cortex layer III (LECIII and MECIII). While MECIII neurons show spatially selective activity, including multiple grid fields and conjunctive activity21,22, LECIII neurons show little spatial selectivity23 and are thought to convey non-spatial information about objects24–26. Lesions of ECIII inputs to the hippocampus cause long-term spatial memory deficits13 and disruption of hippocampal CA1 activity27, while genetic silencing of MECIII inputs to CA1 induced impairments of temporal association memory16.
So while there is thus substantial evidence indicating an important role for ECIII neurons in generating normal hippocampal activity and hippocampus-dependent behavior, the precise mechanisms by which these neurons are involved remain unknown. In vitro studies show that neurons in both lateral and medial entorhinal cortex can exhibit various forms of persistent activity28–30, whereby the neurons can decouple from their electrical or synaptic inputs and remain in a depolarized and spiking state after removal of such inputs. We therefore hypothesized that persistent activity in ECIII neurons in vivo contributes to shaping cortico-hippocampal interactions and could explain their paradoxical decoupling. To test this hypothesis, we measured the membrane potential of these neurons in anesthetized mice during UDS oscillations, along with the local field potential (LFP) from parietal cortex, and hippocampal CA1 spiking activity. Since UDS oscillations are well-synchronized across the entire neocortex1,8,31 they provide a robust estimate of the temporal structure of neocortical inputs to the entorhinal neurons. Further, we were able to use the sharp UDS transitions as a reference to precisely quantify the dynamics of cortico-entorhinal-hippocampal interactions6–8.
Our results show that MECIII neurons frequently generate persistent Up states that greatly outlast the concurrent neocortical Up state, spanning multiple cycles of the neocortical UDS. These persistent Up states were virtually never observed in LECIII neurons, and could not be elicited by direct depolarizing current injections, similar to those used in in vitro studies of entorhinal persistent activity28–30. Rather than completely decoupling from their neocortical inputs, MECIII persistent Up states consistently had durations which were quantized in units of the corresponding neocortical UDS cycles. Further, CA1 neurons’ spiking was strongly driven by MECIII persistent Up states, but was weakly inhibited when the LECIII neurons were active. This could explain why CA1 neurons’ activity shows LIA and becomes decoupled from neocortical UDS. These results demonstrate an important and region-specific contribution of ECIII in coordinating cortico-hippocampal interactions.
Results
Persistent Up states in MECIII, but not LECIII, neurons
Consistent with previous work8,32, the membrane potential of MECIII (n=41) (Fig. 1a) and LECIII (n=13)(Fig. 1b) pyramidal neurons showed clear, spontaneous UDS oscillations. While the LECIII membrane potential had UDS which were very similar to the neocortical UDS, the MECIII neurons often persisted in the depolarized Up state, while the afferent neocortical activity continued to fluctuate between the active Up state and the quiescent Down state (Fig. 1c,d). Up states in the MECIII neurons lasted significantly longer (1.80 ± 0.080 s; mean ± SEM; p=2.4×10⁻⁸; Wilcoxon signed rank test) than Up states in the neocortical LFP (1.09 ± 0.019 s), while the LECLIII neurons’ Up states were slightly but significantly shorter than neocortical Up states (1.00 ± 0.056 s; p=0.013; Fig. 1e and Table 1). Neither MECIII (1.34 ± 0.089 s; p=0.19), nor LECIII (1.9 ± 0.45 s; p=0.38) Down state durations were significantly different from neocortical Down state durations (1.5 ± 0.13 s).
Figure 1. Spontaneous persistent activity in MECIII, but notLEC III, neurons.
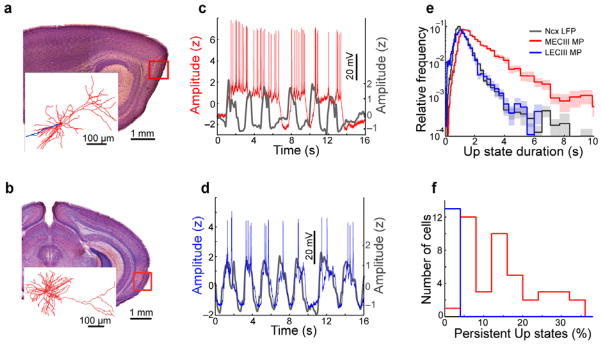
a) Sagittal brain slice showing the region of MEC where the example layer III neuron was recorded (red box). Scale bar is 1 mm. The inset shows a 3D reconstruction of the example neuron (dendrites in red, axon in blue, scale bar is 100 μm) b) Data are presented as in a, but with a coronal section showing an LECIII neuron. Scale bars are the same as in a. c) UDS in the membrane potential (MP) of the example MECIII neuron (red trace). Simultaneously recorded neocortical (Ncx) LFP is shown in gray, inverted so that Up states correspond to positive deflections here and in all subsequent figures. Amplitudes are in units of z-score to allow comparison across cells and with the LFP. Scale bar is 20 mV for MP. d) Data are presented as in c, but for the LECIII cell. e) Distribution of Up state durations averaged across all recording sessions. Uncertainty is reported as the shaded interval (mean ± SEM) here and in subsequent figures. The average duration of Up states was larger in the MECIII membrane potential 1.80 ± 0.080 s than in the neocortical LFP (1.09 ± 0.019 s; p=2.4×10⁻⁸, Wilcoxon signed rank test), but Up states were slightly shorter in LECIII neurons (1.00 ± 0.056 s) compared to the neocortical LFP (p=0.013). f) Histograms of the percentage of Up states which were persistent for MECIII (red) and LECIII (blue) cells, showing a nearly all-or-none effect between these two entorhinal sub-regions.
Table 1.
Summary comparison of properties of MECIII and LECIII UDS.
| MECIII (n=41) | LECIII (n=13) | p-value† | |
|---|---|---|---|
| Up state MP(mV) | −52.5 ± 0.62 | −68 ± 2.0 | 3.2×10⁻⁷ |
| Down state membrane potential (mV) | −74.9 ± 0.83 | −78 ± 1.4 | 0.12 |
| Avg. Up state firing rate (Hz) | 5.9 ± 0.30 | 1.2 ± 0.39 | 2.8×10⁻⁷ |
| Overall avg. firing rate (Hz) | 3.4 ± 0.19 | 0.4 ± 0.14 | 9.2×10⁻⁸ |
| Avg. Up state duration (s) | 1.80 ± 0.080 | 1.00 ± 0.056 | 2.0×10⁻⁷ |
| Avg. Down state duration (s) | 1.34 ± 0.089 | 1.9 ± 0.45 | 0.018 |
| Avg. lag from neocortical Up transition (ms) | 220 ± 16 | 120 ± 18 | 2.4×10⁻³ |
| Avg. lag from neocortical Down transition (ms) | 540 ± 36 | 30 ± 26 | 1.2×10⁻⁷ |
| Percent of persistent Up states | 15 ± 1.4 | 1.1 ± 0.29 | 7.4×10⁻⁸ |
Numbers are reported as mean ± SEM
Wilcoxon rank sum test (two-sided) for equal medians of MECIII and LECIII groups.
To determine the precise relationship of entorhinal and neocortical UDS, we directly compared the durations, and timing, of corresponding entorhinal and neocortical states (see Methods). We defined persistent Up states as those in which the entorhinal neuron remained in the Up state throughout the ensuing neocortical Down state, thus ‘skipping’ over and remaining active during at least one neocortical Down state. Notably, this definition differs from some studies that have referred to the neocortical Up states themselves as persistent activity32. Consistent with the visual impressions from the example neurons (Fig. 1c,d), a substantial fraction of MECIII Up states were persistent (15 ± 1.4%), while very few LECIII Up states were classified as such (1.1 ± 0.29%; Fig. 1f). In fact, LECIII persistent Up states did not occur more often than expected by chance (p=1.0), while MECIII persistent Up states occurred far more often than chance (p=2.4×10⁻⁸; Supplementary Fig. 1). To verify that MECIII persistent Up states were also accompanied by persistent spiking activity throughout the skipped neocortical Down states, we computed their average Up state firing rates separately during neocortical Up and Down states. While MECIII neurons’ had significantly lower average firing rates during neocortical Down states (p=1.9×10⁻⁴), the differences were relatively small (neocortical Up state: 6.2 ± 0.35 Hz; neocortical Down state: 5.4 ± 0.28 Hz). Thus, MECIII neurons continued to spike robustly during persistent Up states, even during the neocortical Down states.
Divergence of MECIII and LECIII state transition timing
In addition to exhibiting persistent Up states, the UDS of MECIII neurons also had a starkly different temporal relationship to the neocortical UDS compared to LECIII neurons (as seen in Fig. 1c,d). To quantify this, we first computed the cross-correlogram between membrane potential and LFP for each neuron. The peak correlation for MECIII neurons was substantially smaller, and occurred at a much longer latency, compared to LECIII neurons (Fig. 2a), suggesting a weaker coupling to neocortical UDS in MEC than in LEC.
Figure 2. Differential delays of MECIII Up and Down transitions relative to neocortical UDS.
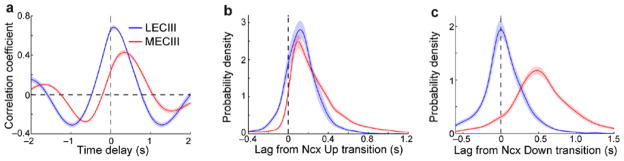
a) The average cross-correlogram between the neocortical LFP and MECIII membrane potential (red) and LECIII membrane potential (blue). Peak correlations were much lower in MECIII neurons 0.47 ± 0.018 compared to LECIII neurons (0.70 ± 0.018; p=3.8×10⁻⁷), and occurred at substantially longer time lags (MECIII: 340 ± 55 ms; LECIII: 100 ± 21 ms; p=6.7×10⁻⁶). b) Average distributions of the time lag between the entorhinal and corresponding neocortical Up transitions. The average delay between entorhinal and neocortical Up transitions was slightly, but significantly, longer for MECIII (220 ± 16 ms) than for LECIII (120 ± 18 ms) neurons (p=2.4×10⁻³). c) Average distributions of the time lag between the entorhinal and corresponding neocortical Down transition. The Down transition delay for MECIII neurons (540 ± 36 ms) was much larger than for LECIII neurons (30 ± 26 ms, p=1.2×10⁻⁷), which was not significantly different from 0 (p=0.34, Wilcoxon signed rank test).
Such coupling could be different for Up-to-Down transitions (“Down transitions”) and Down-to-Up transitions (“Up transitions”), which cannot be inferred from the cross-correlations. Hence, we directly quantified the temporal differences between entorhinal state transitions and the corresponding neocortical state transitions. Both LECIII and MECIII neurons made Up transitions over a hundred milliseconds after the neocortical Up transition8, with MECIII neurons having Up-transition delays nearly twice as long as LECIII neurons (MECIII: 220 ± 16 ms; LECIII: 120 ± 18 ms; Fig. 2b). The difference between MECIII and LECIII Down-transition delays was much larger, with LECIII neurons undergoing Down transitions nearly simultaneously with the neocortical Down transition (30 ± 26 ms), while MECIII neurons’ Down transitions occurred over 500 ms after the neocortical Down transitions (540 ± 36 ms; Fig. 2c), over half the duration of the average neocortical Up state. Importantly, these greatly delayed Down transitions occurred consistently, even when the MECIII Up states were not persistent. Thus, the coupling of entorhinal neurons to neocortical activity was dependent on the entorhinal subregion and the neocortical state.
Persistence is independent of anatomical properties
As the electrophysiological properties of superficial entorhinal neurons both in vitro33–37 and in vivo21 are strongly dependent on cell type and precise anatomical position, we examined whether the persistent Up states observed here were dependent on those parameters. While all the MECIII and LECIII neurons described above showed clear pyramidal neuron morphologies, we also recorded from layer III MEC (n=5) and LEC (n=5) neurons with non-pyramidal morphologies33,34. These non-pyramidal neurons exhibited largely similar properties as the respective pyramidal neurons, with the MECIII neurons showing clear persistent Up states and much longer Down-transition latencies, while the LECIII neurons’ UDS closely followed neocortical UDS (Supplementary Fig. 2). Other properties, such as mean firing rates, Up and Down state amplitudes, and spike shapes, were largely independent of cell morphology. We also recorded from an MECIII interneuron, which did not show persistent activity (Supplementary Fig. 2).
As both the intrinsic biophysical properties35, and in vivo electrophysiological properties21, of MEC neurons exhibit a gradient along the dorsoventral axis of MEC, we tested whether a similar dependence was present in the persistent activity of these neurons. We did not find any dependence of persistent activity, or Down-transition lag, on anatomical position within either MEC or LEC (Supplementary Fig. 3). This suggests that the mechanisms responsible for generating MECIII persistent activity may be separate from those that determine MEC layer II neurons’ grid field spacing.
Relationship between persistent Up states and neocortical UDS
What is the role of neocortical inputs in governing the MECIII persistent activity? To understand this, we measured the duration of MECIII Up states in units of the corresponding neocortical UDS cycles (see Methods). Segments of the membrane potential were extracted around every Up transition, and these segments were sorted according to the duration of the ensuing Up state. The sorted segments were centered on the Up transition and assembled into a single matrix, shown for the MECIII cell depicted in Fig. 1 (Fig. 3a). The corresponding segments of the neocortical LFP (aligned to the MECIII membrane potential Up transition) were also assembled into a matrix (Fig. 3b). This procedure shows that the MECIII Up states had an integrally quantized relationship with neocortical UDS, lasting for integer multiples of neocortical UDS cycles with a constant offset.
Figure 3. Quantization of MECIII persistent Up state durations in units of neocortical UDS.

a) Matrix composed of all 237 membrane potential Up states from an example MECIII neuron, aligned to the MECIII Up transition, and ordered from top to bottom by increasing MECIII Up state duration. The vertical black line shows the onset of the MECIII Up state, and the red trace shows the time of termination of each MECIII Up state. b) Matrix of corresponding neocortical LFP traces during each of the MECIII Up states shown in a. Black and red lines are the same as in a. c) I–IV Example traces from the MECIII membrane potential and neocortical LFP, taken from the locations of the matrices indicated by the black arrows. Action potentials are indicated by tick marks, and 1 z is subtracted from the LFP signal for visual comparison with the membrane potential. d) Histogram of MECIII Up state durations in units of neocortical UDS cycles. e) The distribution of Up state durations averaged across all cells, in units of neocortical UDS cycles, is quantized with nearly integer spacing.
For this example neuron, the membrane potential Up states persisted about 0.8-, 1.8-, 2.8- and 3.5-fold longer than the underlying neocortical UDS period (Fig. 3c). The distribution of Up state durations measured in neocortical UDS cycles was thus multimodal, with the modes having approximately integer spacing (Fig. 3d; see Supplementary Fig. 4 for more examples). Quantization of Up state durations was also clearly visible in the across-cell average distribution of MECIII Up state durations (Fig. 3e). Notably, the first five peaks of this distribution have a nearly constant spacing of about one UDS cycle, illustrating quantization in the ensemble of cells that was apparent even in very long MECIII Up states.
Persistent activity during natural sleep
We next sought to determine whether the persistent Up states in MECIII neurons would occur during drug-free, natural sleep. Hence, we first quantified the probability of Up states being persistent as a function of several different properties of the neocortical UDS known to relate to the depth of anesthesia4,38. The amount of persistence of a given MECIII neuron was weakly correlated with changes in neocortical Down state duration, peak UDS frequency, and neocortical UDS duty cycle (Supplementary Fig. 5). Importantly, in all three cases the correlations were such that when the depth of anesthesia was lighter (i.e. shorter neocortical Down states, higher UDS frequencies, and a greater fraction of time spent in the Up state) the probability of persistent MECIII Up states increased. Cyclic alternations in brain state that occur during anesthesia and natural sleep may also influence persistent activity4; however these fluctuations occur over much longer time scales of minutes, and thus additional experiments are needed to quantify these effects.
These results suggest that MECIII persistent Up states may occur at comparable or increased rates during natural sleep, where the slow oscillations are more similar to lighter anesthesia. To directly test this possibility we measured the membrane potential of MECIII neurons in unanesthetized, sleeping mice. These experiments show that MECIII neurons exhibit similar persistent activity during natural sleep (Fig. 4). We emphasize that studying these phenomena under the more controlled anesthetized condition allows for more precise quantification of persistent activity, and the underlying mechanisms, in vivo. The transferability of our results to natural sleep is further supported by prior findings showing strong similarities of UDS between urethane anesthesia and natural sleep4,8,39.
Figure 4. Examples of MECIII persistent Up states during natural sleep.

Membrane potential recordings from three MECIII neurons in naturally sleeping mice (red traces), along with the simultaneously recorded parietal cortical LFP (gray traces; bandpass filtered between 0.2 and 4 Hz) showing slow-wave sleep oscillations. Example persistent Up states are highlighted by the horizontal black lines above.
Persistent Up states cannot be elicited by current injections
Neurons in both the MEC and LEC can show persistent activity after depolarizing stimulation in vitro28–30. To test if similar mechanisms40 contribute to the persistent activity shown here in vivo, we first considered whether persistent activity was related to a cells’ membrane polarization. While the Down state membrane potentials were not significantly different between MECIII (−74.9 ± 0.83 mV) and LECIII (−78 ± 1.4 mV) neurons (p=0.12), we found that MECIII neurons had significantly more depolarized Up states (−52.5 ± 0.62 mV; p=3.2×10⁻⁷), and correspondingly larger UDS amplitudes (22.5 ± 0.57 mV; p=5.6×10⁻⁷), compared to LECIII neurons (Up state amplitude: −68 ± 2.0 mV; UDS amplitude: 10 ± 1.2 mV; Table 1). In addition, MECIII neurons had substantially higher average firing rates than LECIII neurons during Up states (Table 1). Despite the more depolarized Up states of MECIII neurons, however, neither the Up state amplitude, nor the Up state firing rate were correlated with the amount of persistence or the Down-transition lag for either MECIII or LECIII neurons (Supplementary Fig. 6). Thus, the more depolarized Up states of MECIII neurons alone could not account for the differences in persistence observed between MECIII and LECIII neurons.
To determine whether electrical stimulation similar to that used in in vitro studies could elicit persistent activity in vivo, we injected depolarizing currents into MECIII neurons for 1 s or 12 s, comparable durations to those used for in vitro studies28–30. These depolarizing current injections elicited robust increases in the spiking of MECIII neurons, with average increases of 170% (1 s injection) and 200% (12 s injection) from the spontaneous firing rate (Supplementary Fig. 7). Yet, the neurons did not persist in the depolarized Up state upon the termination of current injections of either duration. Additionally, we also verified that LECIII neurons did not exhibit persistent activity following 12 s current injections (Supplementary Fig. 7). Thus, the spontaneous persistent activity observed here may depend on alternate mechanisms such as network interactions, rather than the cellular mechanisms characterized in in vitro studies28–30,40.
MECIII persistent Up states drive hippocampal CA1 neurons
What is the impact of MECIII persistent activity on cortico-hippocampal interactions? To determine this we simultaneously recorded neocortical LFP, MECIII membrane potential and spiking activity from the hippocampal output region CA1 that receives direct inputs from ECIII19,20 (n=14; see Methods). Since the relative strengths of LECIII and MECIII projections are graded along the proximo-distal axis of CA120,41,42 we recorded from the intermediate region of CA1 receiving inputs from both LECIII and MECIII neurons. Consistent with previous work, both during sleep8,9,17 and anesthesia7,8, CA1 activity exhibited LIA or irregular, slow fluctuations (Fig. 5a). While the neocortical LFP and LECIII neurons’ membrane potential had similar power spectra, the power spectra of MECIII neurons’ membrane potential showed significantly lower peak frequencies (0.29 ± 0.018 Hz) compared to the neocortical LFP (0.46 ± 0.014 Hz; p=6.9×10⁻⁸; Fig. 5b). The peak frequency of MECIII neurons’ UDS was also significantly correlated with the fraction of persistent Up states (Spearman’s rho: −0.49, p=1.2×10⁻³). Interestingly, CA1 MUA showed a similar power spectrum to MECIII neurons’ MP, with peak frequencies significantly lower than those of the neocortical LFP (0.24 ± 0.026 Hz; p=4.9×10⁻⁴), but comparable to those of the MECIII membrane potential (p=0.081). Thus, both MECIII neurons and CA1 MUA showed significantly lower frequency UDS that was reflective of the MECIII persistent Up states.
Figure 5. Differential influence of neocortical and MECIII UDS on CA1 activity.

a) Example trace of an MECIII neuron’s membrane potential (red), along with the simultaneously recorded neocortical LFP (gray) and CA1 MUA rate (green). b) Average relative power spectra of MECIII membrane potential (red), LECL3 membrane potential (blue), neocortical (Ncx) LFP (black), and CA1 MUA (green). The MECIII neurons’ membrane potential had peak power at significantly lower frequencies (0.29 ± 0.018 Hz) compared to the neocortical LFP (0.46 ± 0.014 Hz; p=6.9×10⁻⁸), while peak frequencies of LECL3 neurons’ power spectra (0.41 ± 0.030 Hz) were not significantly different from the neocortical LFP (p=0.38). c) The strength of CA1 MUA modulation by MECIII UDS is plotted against the strength of modulation by neocortical UDS. While MECIII Up states had a strong, significantly positive modulatory effect on CA1 MUA (0.75 ± 0.094 z; p=1.2×10⁻⁴), neocortical Up states had a much weaker (p=1.2×10⁻⁴), and significantly inhibitory effect (−0.16 ± 0.066; p=0.013). The solid black line shows the diagonal.
While the CA1 spiking activity appeared to be only weakly related to neocortical UDS, it was clearly modulated by the UDS of the MECIII neurons (Fig. 5a). To determine the specific dependence of CA1 MUA on neocortical and MECIII UDS we performed a linear regression analysis using both the MECIII and neocortical states as predictors (see Methods). This confirmed that CA1 MUA was strongly positively modulated by MECIII Up states (p=1.2×10⁻⁴), whereas it was significantly negatively modulated by neocortical Up states (p=0.013; Fig. 5c and Supplementary Fig. 8). We also performed a within-sample analysis, and found that within individual persistent MECIII Up states CA1 MUA rates were significantly reduced during the neocortical Down states (−0.39 ± 0.092 z; p=1.2×10⁻³).
To disentangle the specific influences of neocortical and MECIII Up and Down transitions on CA1 MUA in a time-resolved manner, we performed a second set of regression analyses incorporating separate coefficients for MECIII and neocortical state transitions at each time lag relative to CA1 MUA (see Methods). This analysis further illustrated that CA1 MUA was strongly locked to MECIII state transitions, while it was weakly inhibited during the neocortical Up states (Fig. 6a,b). We then tested whether MECIII persistent Up states specifically contributed to shaping CA1 activity by computing the neocortical Down-transition triggered averages separately for neocortical Down transitions which were not ‘skipped’ by MECIII persistent Up states (Fig. 6c), and those that were skipped (Fig. 6d). Indeed, CA1 MUA showed a sustained response throughout the MECIII persistent Up states, which was clearly different from the response during non-persistent states. Average CA1 MUA rates were significantly higher during persistent MECIII Up states compared to non-persistent states (p=6.7×10⁻³; Fig. 6e). Further, neocortical Up states exerted an even more pronounced suppressive influence on CA1 MUA within the persistent MECIII Up states (p=1.7×10⁻³; Fig. 6f), as is also apparent in the example trace (Fig. 5a). Thus, hippocampal activity was largely driven by the MECIII activity, especially the MECIII persistent activity, and it was weakly inhibited by neocortical activity7. Notably, a substantial amount of unexplained variance of CA1 spiking remained even after accounting for the influence of MECIII activity, probably because CA1 neurons are also driven by CA3 inputs which do not show clear UDS modulation7,8.
Figure 6. Temporal relationship of MECIII persistent Up states and CA1 activity.

a) The influence of MECIII (orange trace) and neocortical (brown trace) Up transitions on CA1 MUA are plotted as a function of relative time lag. b) Data are presented as in a for the Down transitions. CA1 MUA was much more strongly modulated by MECIII compared to neocortical state transitions. c) Neocortical Down transition triggered average MECIII membrane potential (red trace), neocortical LFP (gray trace), and CA1 MUA (violet trace) are plotted, using only neocortical Down transitions which were not skipped by MECIII persistent Up states. Note the separate y-axis for CA1 MUA rate (green, right). d) Data are presented as in c, using only neocortical Down transitions which were skipped by MECIII persistent Up states. e) Average CA1 MUA rates during persistent MECIII Up states (0.41 ± 0.071 Hz) were significantly higher than during non-persistent MECIII Up states (0.21 ± 0.047 Hz; p=6.7×10⁻³). The solid black line shows the diagonal. f) The strength of neocortical UDS modulation of CA1 MUA during persistent MECIII Up states is plotted against the corresponding modulation strength taken over all times. Neocortical UDS modulation of CA1 MUA was significantly more negative (−0.36 ± 0.093 z) during MECIII persistent Up states compared to overall (−0.16 ± 0.066 z; p=1.7×10⁻³).
While the projections from MECIII and LECIII target different parts of CA1, MEC and LEC layer II projections converge onto the same populations of neurons in the dentate gyrus20. To determine whether similar patterns of persistent activity could be observed in the dentate gyrus, we analyzed UDS from dentate gyrus granule cells7 (n=10). While these neurons exhibited clear UDS, with a similar short delay in the Up transition relative to neocortical UDS7,8, they did not exhibit persistent activity (Supplementary Fig. 9). This could either occur because entorhinal layer II neurons do not show persistence during UDS, or because dentate gyrus and CA1 neurons integrate their inputs differently. We hypothesize the former mechanism, which remains to be tested.
Taken together, our results thus imply a region-specific pattern of cortico-hippocampal interactions, whereby MECIII neurons produce a partial decoupling of the CA1 activity from neocortical UDS, via their profoundly delayed Down transitions and persistent Up states. Interestingly, we find that there is a strong correlation between a neuron’s Down-transition lag and its probability of having persistent Up states which is significant for both the MECIII (r=0.45, p=3.5×10⁻³) and LECIII (r=0.76, p=2.4×10⁻³) neurons (Fig. 7a). This suggests that the two phenomena may be related by a simple stochastic mechanism, whereby entorhinal neurons exhibit variable hysteresis in their response to cortical state transitions. Neurons with longer Down transition lags are then more likely to ‘miss’ a neocortical Down state entirely, resulting in more persistent Up states (Fig. 7b).
Figure 7. Stochastic mechanism for MECIII persistent Up states and their influence on cortico-entorhinal-hippocampal responses during UDS oscillations.

a) Scatterplot showing the relationship between the percentage of a neuron’s Up states which are persistent and its “relative” Down transition lag, as a fraction of the corresponding neocortical Down state duration. These quantities were significantly correlated for both the MECIII neurons (r=0.45, p=3.5×10⁻³) and the LECIII neurons (r=0.76, p=2.4×10⁻³). Inset at right shows a magnification of the region indicated by the black box at left. b) A sequence of Up and Down states are illustrated for neocortex (black trace), LECIII (blue trace), and MECIII (red trace). Two possible MECIII and CA1 state sequences are illustrated by the solid and dashed red and violet traces, with the solid line depicting a persistent MECIII Up state. The duration of the entorhinal Down transition lag determines the probability of skipping a down state and generating a persistent state (red arrow) via a stochastic mechanism. The green trace illustrates the spiking activity of CA1 pyramidal neurons. Neocortical state transition times are indicated by the black vertical dashed lines. Note that CA1 activity is highest when the neocortex is in a Down state and MECIII neurons are in a persistent Up state.
Discussion
Previous studies have demonstrated that states of persistent depolarization and spiking can be induced in vitro in both LEC29 and MEC neurons28,30 using electrical, synaptic, or pharmacological stimulation. We provide the first direct evidence of persistent activity in ECIII neurons in vivo, occurring spontaneously, and exclusively in MECIII, but not in LECIII neurons. Current injections similar to those used in vitro could not elicit persistent activity in MECIII or LECIII neurons in vivo. This difference could be due to the lack of spontaneous activity, reduced inhibition, and different ionic and neuromodulatory compositions in vitro, and suggests that both cellular and excitatory-inhibitory network mechanisms may be involved in in vivo persistent activity43. The observation that pyramidal and non-pyramidal neurons in MECIII showed similar degrees of persistence, while neither cell type showed significant persistent activity in LECIII, suggests that network mechanisms may be particularly important. Indeed, the termination of MECIII Up states in vitro depends on the activation of local inhibition32. Our results provide additional evidence of the divergent electrophysiological properties of MEC and LEC neurons21,23,26, thought to provide distinct channels for spatial and non-spatial information relayed to the hippocampus23–25. Notably, MECIII and LECIII neurons are quite similar anatomically and physiologically, with similar cell types, and basic physiological properties33,34. The virtually all-or-none dissociation between MECIII and LECIII persistent activity is therefore surprising. This difference could either arise upstream of these structures or as a result of the precise network connectivity and balance between excitation and inhibition within these two networks. The observation that LECIII neurons were significantly less depolarized than the MECIII neurons during the Up state, but not the Down state, (Table 1) further implicates network mechanisms; however the differences in Up state depolarization alone could not account for the lack of persistence in LECIII neurons. Indeed, recent theoretical work shows that the duration of Up states compared to the Down states is influenced by the precise connectivity between excitatory and inhibitory neurons45.
These findings remained unchanged across a range of anesthesia depths, and we even found that the amount of persistence in MECIII neurons increased slightly when the depth of anesthesia was reduced (Supplementary Fig. 2), possibly due to increasing levels of neuromodulators including acetylcholine, that facilitate persistent activity in vitro28,29. In addition, our whole-cell measurements of MECIII membrane potential in naturally sleeping animals show similar persistent Up states. However, the relatively longer duration of Down states observed under anesthesia, compared to normal sleep, allows unequivocal detection, and more accurate analysis, of the temporal dynamics of persistent activity and its influence on cortico-hippocampal interactions, which are thought to be critical for memory consolidation9–12,46. While the inputs from ECIII neurons to the hippocampus are required for this process13, the effect of ECIII inputs on cortico-hippocampal interactions has remained unknown. A previous study8 measured the membrane potential of entorhinal and hippocampal neurons using sharp electrodes in rats. They reported UDS oscillations in entorhinal cortex that were coherent with, but temporally delayed relative to, neocortical UDS, which is in broad agreement with our findings. They neither differentiated between MEC and LEC, nor reported any persistent activity. They did show reduced CA1 gamma power during the ECIII Up states, which is consistent with our finding of reduced CA1 activity during the LECIII Up states. A relatively weak and variable coupling between hippocampal activity and neocortical slow-wave sleep oscillations has been reported7–9,18, with many CA3 and CA1 pyramidal neurons being most active during the neocortical Down state7,8. This could be explained by our finding that CA1 activity is strongly tied to MECIII neurons’ Up states, particularly the persistent Up states, resulting in the divergence of hippocampal and neocortical activity during SWS. While the MECIII persistent activity excites CA1 activity, the neocortical activity exerts a weak inhibitory effect. This could occur via the cortically phase-locked activity of certain hippocampal interneurons6,8, possibly driven by LECIII inputs, or other afferent structures synchronized with neocortical UDS. Since the MEC and LEC inputs to CA1 are segregated along the proximo-distal axis20,41,42, this suggests that activity in the distal part of CA1 would have greater correlation with LEC, and hence stronger correlation with neocortical UDS, while proximal CA1, which exhibits greater spatial selectivity, should show greater correlation with MEC. This remains to be tested.
Our results indicate that persistent activity, which is thought to mediate working memory49, occurs spontaneously during slow wave sleep. They also show that during the neocortical Down states, the hippocampal output is driven to a substantial extent by the MECIII neurons’ persistent activity, which may influence the subsequent neocortical Up states, providing a bidirectional dialogue between the two structures. The MECIII persistent Up states reported here could thus serve to produce the interleaved activation of old and new memories in the cortico-entorhinal-hippocampal circuit12, thus facilitating the consolidation10–15,46 of recently learned spatial information47,48. Additionally, persistent activity of MECIII neurons, similar to that reported here, could also occur during behavior and underlie the learning of temporal associations16 and of long behavioral sequences50.
Online Methods
Animals, Surgery, and Histology
Methods were similar to those described previously6,7. Briefly, data were obtained from 49 C57BL6 mice (MECIII: 37 mice; LECIII: 12 mice) aged postnatal day (p)26 to p42 (30.9 ± 0.51; mean ± SEM) weighing between 12.5 and 29.2 g (17.3 ± 0.43 g). Mice were anesthetized with urethane (between 1.2 and 2.0 g/kg; 1.64 ± 0.035 g/kg i.p.). There were no significant differences between the age (p=0.65; Wilcoxon rank sum test) or weight (p=0.52) of mice where MECIII or LECIII cells were recorded. Similarly, the depth of anesthesia, as measured by several cortical UDS properties38 including peak frequency (p=0.082), average Down state duration (p=0.20), and average duty cycle (p=0.37; see Supplementary Fig. 5) was not significantly different between MECIII and LECIII recordings. Body temperature was maintained at 37º C with the help of a heating blanket. The animal was head-fixed in a stereotaxic apparatus and the skull exposed. A metal plate was attached to the skull and a chamber formed with dental acrylic which was filled with warm artificial cerebrospinal fluid. Two 1 mm diameter holes, one for the LFP recordings and one for the whole cell recordings, were drilled over the left hemisphere and the underlying dura mater was removed. For unanesthetized recordings, animals were not given urethane but were operated under isoflurane (2% by volume), which was discontinued after completion of surgery, after which animals were allowed to sleep naturally. Recordings were performed 2 to 6 hours later.
After electrophysiological recordings, mice were transcardially perfused with 0.1 M phosphate buffer followed by 4% (by weight) paraformaldehyde solution and 150–200 μm thick saggital (for MEC) or coronal (for LEC) brain sections were processed with the avidin–biotin–peroxidase method. In the majority of slides a subsequent Nissl stain was applied before embedding. This visualization of biocytin filled neurons allowed the determination of cell type, layer and precise recording site. Layer III pyramidal neurons used in this study are distinguished from other excitatory neurons and interneurons by prototypical pyramidal cell morphology with a single prominent apical dendrite and characteristic dendritic branching. Neurons that were not clearly identified, or neurons for which the determination of layer was ambiguous were excluded from analysis. Non-pyramidal neurons were defined by multipolar, stellate or complex morphology (more than one thick primary dendrite) plus dendritic spines. We further made 3D reconstructions of the dendritic tree and of the initial axonal segment from neurons with a Neurolucida system (Microbrightfield, Williston, VT), from which the insets in Fig. 1a,b are taken. Dentate gyrus granule cell recording methods and cell identification have been described earlier7. All experimental procedures were carried out according to the animal welfare guidelines of the Max Planck Society.
Electrophysiology and Data Acquisition
Local field potentials (LFP) were recorded with a single-shank multisite probe (NeuroNexus Technologies, Ann Arbor, MI). LFP from posterior parietal cortex (2.0 mm, posterior to bregma; 1.5 mm, lateral from midline, approximately 400–500 μm below the cortical surface) was used for the analyses in this study. In vivo intracellular membrane potential was recorded in whole-cell configuration using borosilicate glass patch pipettes with DC resistances of 4–8 MΩ, filled with a solution containing 135 mM potassium gluconate, 4mM KCl, 10mM Hepes, 10mM phosphocreatinine, 4 mM MgATP, 0.3 mM Na3GTP (adjusted to pH 7.2 with KOH), and 0.1 or 0.2% (by weight) biocytin for histological identification. Whole-cell recording configuration was achieved as described previously51. Relative to bregma, the craniotomy for the membrane potential recordings was made around 4.5 mm posterior and 4 mm lateral for MEC neurons, and 3.5–4 mm posterior, 4.5 mm lateral, and 4 mm ventral for LEC neurons. The average initial series resistance was 46 MΩ. Membrane potential values were corrected for the estimated junction potential of approximately +7 mV. Both LFP and membrane potential were recorded continuously on a Cheetah acquisition system (Neuralynx, Tucson, AZ) for 1140 ± 40 s (mean ± SEM). That complete recording was used for subsequent analysis of spontaneous activity as described below.
In some experiments, current injections were done for 1 s or 12 s. The amount of injected current was adjusted so that it led to depolarizations 1–2 times the maximum Up state amplitude. The required current injection amplitudes varied largely between neurons reflecting mainly variations in access resistance in the respective recordings.
The membrane potential was acquired by Axoclamp-2B (Axon Instruments, Union City, CA) and fed into a Lynx-8 amplifier (Neuralynx). The membrane potential and LFP were recorded by an HS16 preamplifier (Neuralynx). LFPs were sampled at 2 kHz, low-pass filtered below 250, 425 or 475 Hz, and amplified 1,000–5,000 times. The membrane potential was low-pass filtered below 9 kHz, sampled at 32 kHz, and amplified 50–150 times. Simultaneously, the DC-coupled membrane potential was recorded by an ITC18 interface (Instrutech, Mineola, NY) under the control of Pulse software (Heka, Lambrecht, Germany) or by a Micro1401 with Spike2 software (CED, Cambridge, England). Some of these DC-coupled data were recorded in discontinuous sweeps of 7 or 10 s separated by 5 or 2 s respectively.
Additionally, in many experiments hippocampal multi-unit activity (MUA) was simultaneously recorded from the CA1 region of the hippocampus. In these experiments, a deeper electrode of the multisite probe was positioned in the cell body layer of CA1, which was identified by a prominent peak in the MUA rate vs. depth profile at a depth of approximately 1300 μm from the cortical surface. These MUA signals were filtered between 600 and 9000 Hz, and sampled at a rate of 32 kHz when an amplitude threshold was crossed. Spikes were taken as events with peak amplitudes greater than 30 μV.
Statistics and Hypothesis Testing
All analysis was performed with custom software using Matlab (The MathWorks, Natick, MA). We report central tendencies and variability as mean and standard error of the mean (SEM). All hypothesis tests were performed using two-sided nonparametric Wilcoxon rank sum tests for equal medians. Wilcoxon signed rank tests were used for paired comparisons, or one-sample tests. Means and SEMs for LFP data are computed from all LFP recordings (pooled across MEC and LEC datasets). Correlations were computed using Spearman’s rank correlation coefficient. A p-value of less than 0.05 was considered to be significant.
Data Preprocessing
All analysis was restricted to subthreshold fluctuations in the membrane potential by removing spikes from the membrane potential as follows. The temporal derivative of the bandpass filtered (100 Hz to 8 kHz) membrane potential signal was computed, and converted to units of z-score. Times where the derivate of the filtered signal exceeded a fixed threshold (10 z) were taken as spike times, and spike waveforms were then removed by replacing 3 ms of data following the onset of each spike by linear interpolation of adjacent values.
To determine the amplitude of the membrane potential signal in units of millivolts, the DC-coupled membrane potential data (recorded with either the Instrutech or CED hardware) was aligned with the high-pass filtered membrane potential and LFP data (recorded with the Neuralynx hardware). Such alignment was necessary because detection of membrane potential and LFP UDS was performed on the filtered data. This insured that the detection of UDS in the membrane potential and LFP signals was performed on signals acquired with identical hardware (and matched filtering properties), and also avoided problems with detecting UDS in discontinuously recorded DC-coupled membrane potential data. To align the signals, both the DC- and filtered membrane potential signals were first high-pass filtered above 2 Hz. The DC-coupled signal was down-sampled to have the same sampling frequency as the filtered signal (2016 Hz). The DC-coupled and filtered membrane potential signals were then aligned by finding the location of the maximal value of the cross-correlogram.
Up state amplitudes were given by the Up state conditional mean of the membrane potential signal. To reduce biases created by the positive skewness of Down state conditional membrane potential distributions, the Down state amplitudes were given by the conditional mode of the membrane potential distribution. Spike width was determined by finding the width at half-maximum of the average spike waveform (MP high-pass filtered above 60Hz). For both UDS amplitude and spike width calculations, only the first 20% of data were used for each recording to minimize the effects of changes in access resistance over the duration of the recording. For spike width calculations, only neurons with at least 10 spikes were used for analysis.
For ease of visual comparison between membrane potential and LFP signals, the LFP signals were inverted so that neocortical Up states corresponded to positive-going deflections.
Explicit-duration Hidden Markov Model Detection of Up and Down States
Since activity under urethane anesthesia is known to undergo periods of ‘desynchronized activity’ where UDS are absent4,52, we located such epochs and excluded them from all analysis. This was accomplished by first computing the spectrogram of the signal in 15 s overlapping windows using multi-taper methods (Chronux Matlab toolbox53; http://chronux.org) with a time-bandwidth product of four, and seven tapers54. The maximum log power in the range 0.05–2 Hz and the integral of the log power in the 4–40 Hz range were then used to locate desynchronized epochs in the data.
UDS of both MPs and LFPs were classified using two-state explicit-duration hidden Markov models (EDHMMs), as described in detail elsewhere55. Briefly, membrane potential and LFP signals were first filtered in the low-frequency (0.05–2 Hz) range. We then fit a Gaussian-observation EDHMM to the filtered signal, with inverse Gaussian models of the state duration distributions. Because the amplitudes of the Up and Down states could vary substantially over the course of an experiment, we allowed the means of the state-conditional Gaussians to be slowly varying functions of time by introducing time-localized window functions (rectangular windows of length 50 s) into the parameter re-estimation procedure. After finding maximum likelihood parameter estimates of the EDHMM, the maximum likelihood “Viterbi” state sequence was computed, and was used to define UDS in all analysis.
Assignment of Corresponding Neocortical-Entorhinal State Transitions
To determine the temporal relationship between neocortical and entorhinal state transitions, we developed an unbiased algorithm to assign a best correspondence between individual neocortical and entorhinal state transitions55. Each entorhinal Up (Down) transition was assigned (‘linked’) to at most one corresponding neocortical Up (Down) transition, and vice versa. Since there was not a one-to-one correspondence between entorhinal and neocortical UDS, not every state transition was assigned a corresponding transition. Entorhinal Up transitions were linked with corresponding neocortical Up transitions using a greedy search algorithm. In each iteration of the algorithm the entorhinal-neocortical Up transition pair that was least separated in time were linked. This procedure was terminated once either all of the entorhinal or all of the neocortical Up transitions had been linked. Next, any crossed links were eliminated by removing the link between the Up transition pair that was more separated in time. This served to preserve the same temporal ordering of the entorhinal Up transitions and their linked neocortical counterparts. After assigning corresponding Up transitions, a similar algorithm was used to link entorhinal and neocortical Down transitions. The relative timing of entorhinal state transitions was then computed with respect to their corresponding neocortical state transitions as defined above.
Entorhinal-neocortical Up state pairs were then defined as pairs of Up states with linked Up and Down state transitions, and similarly for Down states. Because there was not a one-to-one correspondence of entorhinal and neocortical Up states, some entorhinal Up states were found to correspond to more than one neocortical Up states. Such instances are referred to as persistent Up states. Specifically, any entorhinal Up state for which the Up and Down transitions were linked to state transitions of different neocortical Up states were defined as persistent entorhinal Up states (Supplementary Fig. 10). Entorhinal state transitions which were not linked with a corresponding neocortical state transition using this procedure were excluded from analysis of persistence and relative state transition timing.
Robustness of Persistent Up States
To make our definition of persistent Up states more robust to false detection of short-lived neocortical Down states, we required that any persistent Up state ‘skipped’ over at least one corresponding neocortical Down state whose duration was at least 0.5 s. Entorhinal Up states which skipped over neocortical Down states lasting less than this threshold duration were excluded from analysis. This requirement prevented entorhinal Up states from being identified as persistent as the result of the splitting of a corresponding neocortical Up state by a spuriously detected neocortical Down state. The minimum duration of 0.5 s was chosen because it constituted approximately 10% of neocortical Down states. All results were qualitatively similar without this criterion.
Computing Entorhinal State Durations in Units of Neocortical UDS Cycles
To compute the duration of each entorhinal Up state in units of corresponding neocortical UDS cycles, the neocortical LFP signal was first shifted so that the corresponding Up transitions in the membrane potential and LFP were aligned. Each complete neocortical Up or Down state was then treated as 0.5 cycles, and the fraction of the next neocortical state completed before the membrane potential Down transition was added to get the duration of the membrane potential Up state (Supplementary Fig. 10).
Analysis of CA1 MUA
The instantaneous rate rhpc(t)of CA1 MUA was computed by binning spikes (4 ms bins), and smoothing the resulting time series using a Gaussian kernel (sigma = 50 ms). This estimate of the MUA rate was then normalized to have units of z-score to allow for comparison across recordings. Several analyses were then performed to determine the influence of neocortical and MECIII UDS on CA1 MUA. First, to determine the effect of MECIII and neocortical state on CA1 MUA, we fit models of the form:
using linear regression, where xMEC(t) and xncx(t) are binary-valued times series representing the state of the MECIII neuron and the neocortical LFP respectively as a function of time (1 during Up states and 0 during Down states), α and β determine the contributions of MEC and neocortical Up states respectively, and c is a constant. Restricted models, without the first term on the right-hand side, were also fit to the data using only persistent MECIII Up states. Such models thus served to quantify the influence of neocortical UDS on CA1 MUA specifically during the persistent MECIII Up states.
We also fit models of the form:
Where yMEC(t) (not to be confused with the x(t) above), is 1 at the time of an MECIII Up or Down transition, and 0 otherwise. Note that the parameters α(τ) and β(τ) in this case are computed for a series of time lags τ ranging from −τmax to τmax. Thus, this model quantifies the specific contributions of neocortical and MECIII Up or Down transitions at each time lag relative to CA1 MUA rates.
Spectral Analysis
Power spectra were estimated using multi-taper methods (Chronux Matlab toolbox53; http://chronux.org). Power spectra were computed in non-overlapping 50 s windows using a time-bandwidth product of three and five tapers54, and the average across time-windows (excluding desynchronized epochs) and tapers was taken.
Supplementary Material
Acknowledgments
JMM and MRM were supported by the Whitehall Foundation, an NSF career award, and the W. M. Keck Foundation. T.T.G.H. and S.B. were supported by the German Ministry of Education and Research (BMBF grants 01GQ1007 and 01GQ1003B), and supported by the Max Planck Society and the group of A. Schäfer at the Max Planck Institute for Medical Research. We particularly thank Dr. Thomas Fucke for extensive support with experiments. All authors were supported by a NIH-BMBF-CRCNS grant 5R01MH092925-02 to MRM.
Footnotes
Author contributions: T.T.G.H., J.M.M. and M.R.M. designed research, T.T.G.H. and S.B. performed the experiments, J.M.M. performed the data analysis. M.R.M. participated in all aspects of research. All authors participated in paper writing.
Reprints and permissions information is available at www.nature.com/reprints.
References
- 1.Steriade M, Nuñez A, Amzica F. A novel slow (< 1 Hz) oscillation of neocortical neurons in vivo: depolarizing and hyperpolarizing components. The Journal of Neuroscience. 1993;13:3252–65. doi: 10.1523/JNEUROSCI.13-08-03252.1993. [DOI] [PMC free article] [PubMed] [Google Scholar]
- 2.Destexhe A, Contreras D, Steriade M. Spatiotemporal Analysis of Local Field Potentials and Unit Discharges in Cat Cerebral Cortex during Natural Wake and Sleep States. Journal of Neuroscience. 1999;19:4595–4608. doi: 10.1523/JNEUROSCI.19-11-04595.1999. [DOI] [PMC free article] [PubMed] [Google Scholar]
- 3.Petersen CCH, Hahn TTG, Mehta M, Grinvald A, Sakmann B. Interaction of sensory responses with spontaneous depolarization in layer 2/3 barrel cortex. PNAS. 2003;100:13638–13643. doi: 10.1073/pnas.2235811100. [DOI] [PMC free article] [PubMed] [Google Scholar]
- 4.Clement EA, et al. Cyclic and Sleep-Like Spontaneous Alternations of Brain State Under Urethane Anaesthesia. PLoS one. 2008;3 doi: 10.1371/journal.pone.0002004. [DOI] [PMC free article] [PubMed] [Google Scholar]
- 5.Sirota A, Csicsvari J, Buhl D, Buzsáki G. Communication between neocortex and hippocampus during sleep in rodents. PNAS. 2003;100:2065. doi: 10.1073/pnas.0437938100. [DOI] [PMC free article] [PubMed] [Google Scholar]
- 6.Hahn TTG, Sakmann B, Mehta MR. Phase-locking of hippocampal interneurons’ membrane potential to neocortical up-down states. Nature Neuroscience. 2006;9:1359–1361. doi: 10.1038/nn1788. [DOI] [PubMed] [Google Scholar]
- 7.Hahn TTG, Sakmann B, Mehta MR. Differential responses of hippocampal subfields to cortical up-down states. PNAS. 2007;104:5169–74. doi: 10.1073/pnas.0700222104. [DOI] [PMC free article] [PubMed] [Google Scholar]
- 8.Isomura Y, et al. Integration and Segregation of Activity in Entorhinal-Hippocampal Subregions by Neocortical Slow Oscillations. Neuron. 2006;52:871–882. doi: 10.1016/j.neuron.2006.10.023. [DOI] [PubMed] [Google Scholar]
- 9.Ji D, Wilson MA. Coordinated memory replay in the visual cortex and hippocampus during sleep. Nature neuroscience. 2007;10:100–7. doi: 10.1038/nn1825. [DOI] [PubMed] [Google Scholar]
- 10.Marr D. Simple Memory: A Theory for Archicortex. Philosophical Transactions of the Royal Society B: Biological Sciences. 1971;262:23–81. doi: 10.1098/rstb.1971.0078. [DOI] [PubMed] [Google Scholar]
- 11.Squire LR. Memory and the hippocampus: A synthesis from findings with rats, monkeys, and humans. Psychological Review. 1992;99:195–231. doi: 10.1037/0033-295x.99.2.195. [DOI] [PubMed] [Google Scholar]
- 12.McClelland JL. Why there are complementary learning systems in the hippocampus and neocortex: Insights from the successes and failures of connectionist models of learning and memory. Psychological Review. 1995;102:419–457. doi: 10.1037/0033-295X.102.3.419. [DOI] [PubMed] [Google Scholar]
- 13.Remondes M, Schuman EM. Role for a cortical input to hippocampal area CA1 in the consolidation of a long-term memory. Nature. 2004;431:699–703. doi: 10.1038/nature02965. [DOI] [PubMed] [Google Scholar]
- 14.Marshall L, Helgadóttir H, Mölle M, Born J. Boosting slow oscillations during sleep potentiates memory. Nature. 2006;444:610–3. doi: 10.1038/nature05278. [DOI] [PubMed] [Google Scholar]
- 15.Diekelmann S, Born J. The memory function of sleep. Nature Reviews Neuroscience. 2010;11:114–26. doi: 10.1038/nrn2762. [DOI] [PubMed] [Google Scholar]
- 16.Suh J, Rivest AJ, Nakashiba T, Tominaga T, Tonegawa S. Entorhinal cortex layer III input to the hippocampus is crucial for temporal association memory. Science. 2011;334:1415–20. doi: 10.1126/science.1210125. [DOI] [PubMed] [Google Scholar]
- 17.O’Keefe J, Nadel L. The Hippocampus as a Cognitive Map. Oxford University Press; 1979. [Google Scholar]
- 18.Wolansky T, Clement E, Peters S, MA Hippocampal slow oscillation: a novel EEG state and its coordination with ongoing neocortical activity. Journal of Neuroscience. 2006;26:6213–6229. doi: 10.1523/JNEUROSCI.5594-05.2006. [DOI] [PMC free article] [PubMed] [Google Scholar]
- 19.Witter M. Organization of the entorhinal-hippocampal system: a review of current anatomical data. Hippocampus. 1993;3 [PubMed] [Google Scholar]
- 20.van Strien NM, Cappaert NLM, Witter MP. The anatomy of memory: an interactive overview of the parahippocampal-hippocampal network. Nature Reviews Neuroscience. 2009;10:272–82. doi: 10.1038/nrn2614. [DOI] [PubMed] [Google Scholar]
- 21.Hafting T, Fyhn M, Molden S, Moser MB, Moser EI. Microstructure of a spatial map in the entorhinal cortex. Nature. 2005;436:801–6. doi: 10.1038/nature03721. [DOI] [PubMed] [Google Scholar]
- 22.Sargolini F, et al. Conjunctive representation of position, direction, and velocity in entorhinal cortex. Science (New York, NY) 2006;312:758–62. doi: 10.1126/science.1125572. [DOI] [PubMed] [Google Scholar]
- 23.Hargreaves EL, Rao G, Lee I, Knierim JJ. Major dissociation between medial and lateral entorhinal input to dorsal hippocampus. Science. 2005;308:1792–4. doi: 10.1126/science.1110449. [DOI] [PubMed] [Google Scholar]
- 24.Manns JR, Eichenbaum H. Evolution of declarative memory. Hippocampus. 2006;16:795–808. doi: 10.1002/hipo.20205. [DOI] [PubMed] [Google Scholar]
- 25.Knierim JJ. Neural representations of location outside the hippocampus. Learning & memory (Cold Spring Harbor, NY) 2006;13:405–15. doi: 10.1101/lm.224606. [DOI] [PubMed] [Google Scholar]
- 26.Deshmukh SS, Knierim JJ. Representation of Non-Spatial and Spatial Information in the Lateral Entorhinal Cortex. Frontiers in Behavioral Neuroscience. 2011;5:69. doi: 10.3389/fnbeh.2011.00069. [DOI] [PMC free article] [PubMed] [Google Scholar]
- 27.Brun VH, et al. Impaired spatial representation in CA1 after lesion of direct input from entorhinal cortex. Neuron. 2008;57:290–302. doi: 10.1016/j.neuron.2007.11.034. [DOI] [PubMed] [Google Scholar]
- 28.Egorov A, Hamam B, Fransén E, Hasselmo M, Alonso A. Graded persistent activity in entorhinal cortex neurons. Nature. 2002;420:173–178. doi: 10.1038/nature01171. [DOI] [PubMed] [Google Scholar]
- 29.Tahvildari B, Fransén E, Alonso AA, Hasselmo ME. Switching between “On” and “Off” states of persistent activity in lateral entorhinal layer III neurons. Hippocampus. 2007;17:257–63. doi: 10.1002/hipo.20270. [DOI] [PubMed] [Google Scholar]
- 30.Yoshida M, Fransén E, Hasselmo ME. mGluR-dependent persistent firing in entorhinal cortex layer III neurons. The European Journal of Neuroscience. 2008;28:1116–26. doi: 10.1111/j.1460-9568.2008.06409.x. [DOI] [PMC free article] [PubMed] [Google Scholar]
- 31.Volgushev M, Chauvette S, Mukovski M, Timofeev I. Precise long-range synchronization of activity and silence in neocortical neurons during slow-wave oscillations [corrected] The Journal of Neuroscience. 2006;26:5665–72. doi: 10.1523/JNEUROSCI.0279-06.2006. [DOI] [PMC free article] [PubMed] [Google Scholar]
- 32.Mann EO, Kohl MM, Paulsen O. Distinct roles of GABA(A) and GABA(B) receptors in balancing and terminating persistent cortical activity. The Journal of Neuroscience. 2009;29:7513–8. doi: 10.1523/JNEUROSCI.6162-08.2009. [DOI] [PMC free article] [PubMed] [Google Scholar]
- 33.Canto CB, Witter MP. Cellular properties of principal neurons in the rat entorhinal cortex. I. The lateral entorhinal cortex. Hippocampus. 2012;22:1256–76. doi: 10.1002/hipo.20997. [DOI] [PubMed] [Google Scholar]
- 34.Canto CB, Witter MP. Cellular properties of principal neurons in the rat entorhinal cortex. II. The medial entorhinal cortex. Hippocampus. 2012;22:1277–99. doi: 10.1002/hipo.20993. [DOI] [PubMed] [Google Scholar]
- 35.Giocomo LM, Zilli Ea, Fransén E, Hasselmo ME. Temporal frequency of subthreshold oscillations scales with entorhinal grid cell field spacing. Science (New York, NY) 2007;315:1719–22. doi: 10.1126/science.1139207. [DOI] [PMC free article] [PubMed] [Google Scholar]
- 36.Gloveli T, Schmitz D, Empson RM, Dugladze T, Heinemann U. Morphological and electrophysiological characterization of layer III cells of the medial entorhinal cortex of the rat. Neuroscience. 1997;77:629–48. doi: 10.1016/s0306-4522(96)00494-0. [DOI] [PubMed] [Google Scholar]
- 37.Tahvildari B, Alonso A. Morphological and electrophysiological properties of lateral entorhinal cortex layers II and III principal neurons. The Journal of comparative neurology. 2005;491:123–40. doi: 10.1002/cne.20706. [DOI] [PubMed] [Google Scholar]
- 38.Friedberg MH, Lee SM, Ebner FF. Modulation of Receptive Field Properties of Thalamic Somatosensory Neurons by the Depth of Anesthesia. Journal of Neurophysiology. 1999;81:2243–2252. doi: 10.1152/jn.1999.81.5.2243. [DOI] [PubMed] [Google Scholar]
- 39.Steriade M, Timofeev I, Grenier F. Natural waking and sleep states: a view from inside neocortical neurons. Journal of neurophysiology. 2001;85:1969–85. doi: 10.1152/jn.2001.85.5.1969. [DOI] [PubMed] [Google Scholar]
- 40.Fransén E, Tahvildari B, Egorov AV, Hasselmo ME, Alonso AA. Mechanism of graded persistent cellular activity of entorhinal cortex layer v neurons. Neuron. 2006;49:735–46. doi: 10.1016/j.neuron.2006.01.036. [DOI] [PubMed] [Google Scholar]
- 41.Ahmed OJ, Mehta MR. The hippocampal rate code: anatomy, physiology and theory. Trends in Neurosciences. 2009;32:329–38. doi: 10.1016/j.tins.2009.01.009. [DOI] [PMC free article] [PubMed] [Google Scholar]
- 42.Henriksen EJ, et al. Spatial representation along the proximodistal axis of CA1. Neuron. 2010;68:127–37. doi: 10.1016/j.neuron.2010.08.042. [DOI] [PMC free article] [PubMed] [Google Scholar]
- 43.Major G, Tank D. Persistent neural activity: prevalence and mechanisms. Current Opinion in Neurobiology. 2004;14:675–84. doi: 10.1016/j.conb.2004.10.017. [DOI] [PubMed] [Google Scholar]
- 44.Ito HT, Schuman EM. Functional division of hippocampal area CA1 via modulatory gating of entorhinal cortical inputs. Hippocampus. 2011;22:372–387. doi: 10.1002/hipo.20909. [DOI] [PMC free article] [PubMed] [Google Scholar]
- 45.Ghorbani M, Mehta M, Bruinsma R, Levine A. Nonlinear-dynamics theory of up-down transitions in neocortical neural networks. Physical Review E. 2012;85 doi: 10.1103/PhysRevE.85.021908. [DOI] [PubMed] [Google Scholar]
- 46.Mehta MR. Cortico-hippocampal interaction during up-down states and memory consolidation. Nature neuroscience. 2007;10:13–5. doi: 10.1038/nn0107-13. [DOI] [PubMed] [Google Scholar]
- 47.Mehta MR, Barnes CA, McNaughton BL. Experience-dependent, asymmetric expansion of hippocampal place fields. PNAS. 1997;94:8918–8921. doi: 10.1073/pnas.94.16.8918. [DOI] [PMC free article] [PubMed] [Google Scholar]
- 48.Mehta MR, Quirk MC, Wilson MA. Experience-dependent asymmetric shape of hippocampal receptive fields. Neuron. 2000;25:707–15. doi: 10.1016/s0896-6273(00)81072-7. [DOI] [PubMed] [Google Scholar]
- 49.Goldman-Rakic PS. Cellular basis of working memory. Neuron. 1995;14:477–85. doi: 10.1016/0896-6273(95)90304-6. [DOI] [PubMed] [Google Scholar]
- 50.Mehta MR, Lee AK, Wilson MA. Role of experience and oscillations in transforming a rate code into a temporal code. Nature. 2002;417:8–11. doi: 10.1038/nature00807. [DOI] [PubMed] [Google Scholar]
- 51.Margrie TW, Brecht M, Sakmann B. In vivo, low-resistance, whole-cell recordings from neurons in the anaesthetized and awake mammalian brain. Pflügers Archiv: European Journal of Physiology. 2002;444:491–8. doi: 10.1007/s00424-002-0831-z. [DOI] [PubMed] [Google Scholar]
- 52.Kasanetz F, Riquelme LA, Murer MG. Disruption of the two-state membrane potential of striatal neurones during cortical desynchronisation in anaesthetised rats. Journal of Physiology. 2002;543(2):577–589. doi: 10.1113/jphysiol.2002.0024786. [DOI] [PMC free article] [PubMed] [Google Scholar]
- 53.Bokil H, Andrews P, Kulkarni JE, Mehta S, Mitra PP. Chronux: a platform for analyzing neural signals. Journal of Neuroscience Methods. 2010;192:146–51. doi: 10.1016/j.jneumeth.2010.06.020. [DOI] [PMC free article] [PubMed] [Google Scholar]
- 54.Thomson DJ. Spectrum estimation and harmonic analysis. Proceedings of the IEEE. 1982;70:1055–1096. [Google Scholar]
- 55.McFarland JM, Hahn TTG, Mehta MR. Explicit-Duration Hidden Markov Model Inference of UP-DOWN States from Continuous Signals. PloS one. 2011;6:e21606. doi: 10.1371/journal.pone.0021606. [DOI] [PMC free article] [PubMed] [Google Scholar]
Associated Data
This section collects any data citations, data availability statements, or supplementary materials included in this article.