Abstract
Amyloid fibrils are associated with many neurodegenerative diseases and are considered to be the energetically most favorable form of proteins. Here we report that a small pH change initiates spontaneous transformation of insulin fibrils from one polymorph to another. As a result, fibril supramolecular chirality overturns both accompanying morphological and structural changes.
Several of the roughly 25 disorders known as amyloid diseases are associated with insulin metabolism.1 Injection amyloidosis is one of these conditions, when full length insulin aggregates and forms amyloid fibrils.2,3 In vitro, insulin forms amyloid-like fibrils under denaturing conditions such as low pH and elevated temperature.4 Although these fibrils possess a typical cross-β core, their morphology varies significantly depending on specific fibrillation conditions.5,6 For example, Dzwolak et al. demonstrated that solution agitation during insulin aggregation leads to the formation of fibril polymorphs with varying chirality.7,8 A morphological diversity of amyloid fibrils formed from the same protein, fibril polymorphism, is one of the most intriguing aspects of amyloid studies.9,10 An understanding of this phenomenon is critical because of the correlation between fibril morphology and fibril biological activity and associated toxicity.11,12
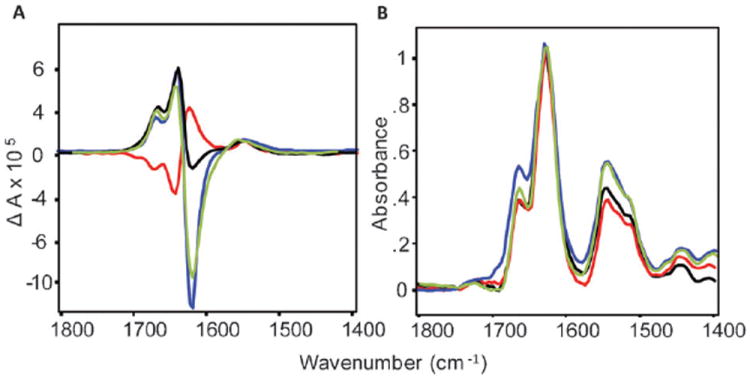
Vibrational circular dichroism (VCD) has been found to be a very sensitive technique for direct characterization of fibrillar supramolecular chirality.13 The VCD peak intensities of protein fibrils are one to two orders of magnitude larger than that of the solution of non-fibrillar protein. The enhanced VCD arises from the long-range supramolecular chirality of the fibrillar structure.14 We have demonstrated recently that insulin forms fibrils with opposite chirality depending on small variations in solution pH.15 Normal, left-handed fibrils (NF) form in solution at pH 2.4 and higher. However, when the solution pH is lower than 2.4, insulin aggregation results in the morphologically different reverse fibrils (RF) exhibiting opposite chirality as evident from a nearly mirror-image enhanced VCD spectrum (Fig. 1).15
Fig. 1.

VCD (a) and IR absorption (b) spectra of RF incubated at pH 1.5 (red), the same solution 30 minutes (black) and 12 hours (green) after pH was elevated to 2.5, and NF incubated at pH 2.5 (blue).
Here we demonstrate that well-developed insulin fibrils overturn their chirality spontaneously, as indicated by sign reversal of their VCD spectra, as a result of a small change in pH. This process is irreversible and occurs only when the pH is raised from 1.5 to 2.5 resulting in reconfiguration of fibrils with reverse chirality to those of normal chirality. Insulin fibrils with reversed fibril (RF) chirality (Fig. 1, red curves) were grown at pH 1.5, 70 °C and 60 mg mL−1 protein concentration as reported elsewhere.15 A gelatinous phase, mostly dominated by well-developed fibrils, was re-dispersed in water to adjust the total fibril solution pH to 2.5. The pH adjustment procedure took about 25 minutes, followed immediately by a 30-minute VCD collection.
The sample was kept in the VCD cell at 25 °C during this kinetic experiment. Remarkably, the VCD spectrum measured 30 minutes after the pH change (Fig. 1a, black curve) is almost a mirror image of the RF VCD spectrum (red curve) and with very similar intensity. The amplitude of the 1624 cm−1 negative band continued to increase with time during the next 12 hours at 25 °C, reaching the same intensity as a mature normal fibril (Fig. 1a, green curve).
These changes in the fibril VCD spectrum indicate a spontaneous inter-conversion of insulin fibrils from one chiral polymorph to another without additional heating. We will call fibrils formed as a result of the inter-conversion process NRF hereafter. No effect of solution ionic strength was found. An addition of sodium chloride up to 1 M concentration to an RF solution changed neither the chirality of the RF nor the kinetics of the spontaneous inter-conversion.
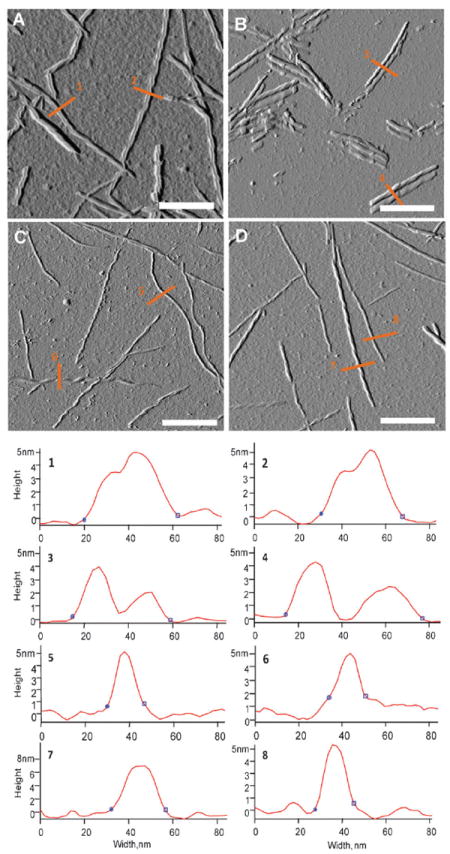
In our previous study of insulin chiral polymorphs we have reported NF and RF AFM images obtained in a dry mode.15 However, we found that the drying process changes noticeably the morphology of insulin fibrils and thus their dimensions (Fig. S1, ESI†). One can expect that tiny surface features, such as twist grooves might be deformed as a result of sample drying. Therefore, the detection of fibril handedness may be limited. To eliminate the drying effect we utilized fluid-cell AFM. Fig. 2 shows fluid-cell AFM images of RF (A) and NF (D) as well as profiles of selected fibrils (1, 2 and 7, 8). The majority of RFs grown at pH 1.5 were composed of two laterally aggregated proto-fibrils and have a height of approximately 4 nm with a width around 40 nm (Fig. 2A; profiles 1 and 2). We found that some of these fibrils have a left-twist (Fig. S1, ESI†). At the same time, a NF solution is dominated by the left-handed fibrils, which have a height around 7 nm with a width of 25 nm. In addition, we also observed a small subpopulation of smaller-in-size fibrils, which could be proto-fibrils. They have a height of ~5 nm and a width around 16 nm.
Fig. 2.

Fluid-cell AFM images of RF (A) at pH 1.5 and NRF (B) on the same mica surface 30 min after fluid cell chamber pH was elevated to 2.5. NRF after 12 hours in solution at pH 2.5 before the deposition on a mica substrate (C). Finally, NF (D) grown at pH 2.5. Scale bar is 250 nm.
We also followed the inter-conversion process with AFM imaging. First, we attempted to monitor the fibril inter-conversion process for the very same fibrils in the AFM fluid cell. After pH of the initial solution was elevated by injecting a small amount of sodium hydroxide solution into the fluid cell, we observed that the fibrils changed their morphology disaggregating into two separated proto-fibrils (Fig. 2B). These newly formed NRF proto-fibrils have a height of 4 nm and a width around 20 nm (Fig. 2B; profiles 3 and 4). The injection of sodium hydroxide solution resulted in a strong shock and misalignment of the system that prevented the imaging of the very same fibril at two pH conditions (it is still the same AFM sample). It is very likely that the background smoothing (Fig. 2A and B) also originates from pH increase. Finally, NRF fibrils which were fully developed in pH 2.5 solution for 12 hours are shown in Fig. 2C. The morphology and sizes of NRF are very close to those of NF shown in Fig. 2D. Additionally, both NRF and NF showed the left-handed twist, at least for some fibrils, shown in Fig. 2B and D.
The AFM images presented here show evidence for fibril chirality as a left-handed twist only for fully developed NF or NRF fibrils, which exhibit normal VCD spectra. Although the reverse VCD spectra of fully developed RF are strongly enhanced relative to isolated insulin protein molecules no right-handed twist is evident in the corresponding AFM images. As a result, we conclude that the associated right-handed helical structure, which must be present from the VCD evidence, must lie below the limit of the AFM detection or else somehow lie obscured by a higher level of fibril, double-stranded, tape-like, morphology. Right-handed amyloid fibrils, opposite to the normal left-handed twisted fibrils, have been imaged by cyro-SEM, which like AFM is sensitive to surface three-dimensional morphology.16 In the future we plan to utilize cryo-SEM as well as other imaging techniques to better understand fibril morphology and its relationship to VCD chirality.
An obvious question is whether the discovered phenomenon of spontaneous inter-conversion is a reversible process and if RF fibrils could be formed from NF by decreasing the pH from 2.5 to 1.5. Upon decreasing the pH of freshly formed NF from pH 2.5 to pH 1.0 no changes in VCD spectra were observed (Fig. S2, ESI†). Consequently, we find that the stability of the two opposite chiral polymorphs of insulin fibrils is different. Reversed fibrils are unstable at elevated pH (> 2.5) and easily convert into the energetically preferable normal fibrils, but not vice versa.
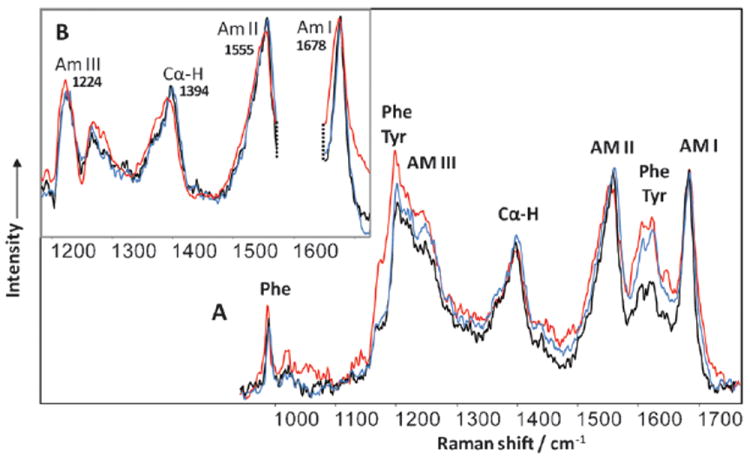
An important question to address is whether the fibril secondary structure changes upon the reversal of chirality. For this we used deep UV resonance Raman (DUVRR) spectroscopy that has been demonstrated to be a powerful tool for amyloid fibrils structure characterizations.17-20 The typical protein DUVRR spectrum is dominated by amide bands, which characterize the polypeptide backbone conformation, and aromatic amino acid bands, which report on their local environment.19 The spectra of all fibril polymorphs show sharp and intense amide I and II bands as well as high intensity of the Cα–H band that is indicative of an extended β-sheet conformation evident for all fibril spectra (Fig. 3A).
Fig. 3.

DUVRR spectra of (A) RF insulin incubated at pH 1.5 (black), the same solution of NRF after 30 min at pH 2.5 (red), NF incubated at pH 2.5 (blue). The same spectra (B) after quantitative subtraction of Phe and Tyr contribution.
The main changes in RF and NF Raman spectra are associated with the intensity of aromatic amino acid residue peaks. Tyrosine (Tyr) bands in the spectrum of NF have significantly higher intensity than in the spectrum of RF that indicates the difference in Tyr local environments in these two chiral polymorphs.21 Specifically, Tyr peak intensities at 1176 cm−1, 1204 cm−1, 1617 cm−1, and 1602 cm−1 increased when the pH of RF solution was increased. At the same time, the intensity of phenylalanine (Phe) peak at 1000 cm−1 did not change as a result of the NRF inter-conversion. The 1000 cm−1 Phe Raman band is very sensitive to the local environment.22,23 The fact that it does not change as a result of the inter-conversion indicates that Phe and Tyr residues have very different locations in insulin fibrils. Most probably, Tyr residues are located on the surface of two proto-fibrils, which are formed as a result of RF disintegration. In contrast, Phe residues are buried inside proto-fibrils and the disintegration of RF does not change its local environment. After the contribution of Tyr and Phe was quantitatively subtracted, it is evident that the positions of all amide bands in the Raman spectra of RF, NF and NRF remained the same (Fig. 3B). The latter indicates that the protein secondary structure does not change upon fibril chirality reversal. A noticeable difference in the amide I band shape might not necessarily report on the secondary structure changes, but could be due to the change in the carboxyl contribution (peak at 1687 cm−1) due to the deprotonation caused by pH increase or variations in the water contribution (a broad peak at ~1600 cm−1). Further study is necessary to understand these spectral changes. We have already reported that the amide part of the Raman spectrum found for the fibril core is the same for NF and RF.15 Similarly, the Raman spectrum of an NRF fibril core (12 hours after pH elevation) obtained using the hydrogen–deuterium exchange approach was identical to that of NF (data not shown). This means that the fibril core structure of insulin fibrils does not change during the spontaneous inter-conversion process.
This is the second example of spontaneous reconfiguration of amyloid fibrils caused by the change in environment. Spontaneous refolding of apo-α-lactalbumin fibrils caused by change in temperature and salinity has been recently reported.24 Spontaneous inter-conversion of insulin fibril chirality is most likely associated with the deprotonation of carboxyl groups on the surface of proto-filaments.15 In the case of NF, intertwining holds the proto-filaments tight and probably protects from protonation. In the case of RF, there is no intertwining and the deprotonation is possible resulting in RF disintegration. Refolding of apo-α-lactalbumin fibrils results in significant changes in the fibril core, while insulin fibril secondary structure remains the same in the two polymorphs according to DUVRR spectroscopic characterization. Based on these observations one may conclude that insulin fibril polymorphism initiates at the stage of proto-filaments while its cross-β core structure remains identical. The discovered process of spontaneous inter-conversion changes the very concept of the extraordinary stability of amyloid fibrils and indicates a new potential approach for controlling fibril biological activity.
Supplementary Material
Acknowledgments
We thank Aliaksandra Sikrzhytskaya for valuable graphical assistance. This project is supported by Award Number R01AG033719 from National Institute of Aging (IKL) and the National Science Foundation SBIR Phase II grant IIP-0945484 (RKD, LAN and XL).
Footnotes
Electronic supplementary information (ESI) available: Fig. S1, S2 and S3; additional experimental and instrumental information are available. See DOI: 10.1039/c2cc16895b
Contributor Information
Rina K. Dukor, Email: rkdukor@aol.com.
Laurence A. Nafie, Email: lnafie@syr.edu.
Igor K. Lednev, Email: ilednev@albany.edu.
Notes and references
- 1.Sipe JD. Amyloid Proteins: The Beta Sheet Conformation and Disease. Wiley-VCH, Verlag GmbH; 2005. [Google Scholar]
- 2.Storkel S, Schneider HM, Muntefering H, Kashiwagi S. Lab Invest. 1983;48:108–111. [PubMed] [Google Scholar]
- 3.Westermark P. Am J Pathol. 1998;152:1125–1127. [PMC free article] [PubMed] [Google Scholar]
- 4.Brange J, Andersen L, Laursen ED, Meyn G, Rasmussen E. J Pharm Sci. 1997;86:517–525. doi: 10.1021/js960297s. [DOI] [PubMed] [Google Scholar]
- 5.Devlin GL, Knowles TP, Squires A, McCammon MG, Gras SL, Nilsson MR, Robinson CV, Dobson CM, MacPhee CE. J Mol Biol. 2006;360:497–509. doi: 10.1016/j.jmb.2006.05.007. [DOI] [PubMed] [Google Scholar]
- 6.Jansen R, Dzwolak W, Winter R. Biophys J. 2005;88:1344–1353. doi: 10.1529/biophysj.104.048843. [DOI] [PMC free article] [PubMed] [Google Scholar]
- 7.Dzwolak W, Loksztejn A, Galinska-Rakoczy A, Adachi R, Goto Y, Rupnicki L. J Am Chem Soc. 2007;129:7517–7522. doi: 10.1021/ja066703j. [DOI] [PubMed] [Google Scholar]
- 8.Loksztejn A, Dzwolak W. J Mol Biol. 2008;379:9–16. doi: 10.1016/j.jmb.2008.03.057. [DOI] [PubMed] [Google Scholar]
- 9.Anderson M, Bocharova OV, Makarava N, Breydo L, Salnikov VV, Baskakov IV. J Mol Biol. 2006;358:580–596. doi: 10.1016/j.jmb.2006.02.007. [DOI] [PubMed] [Google Scholar]
- 10.Krishnan R, Lindquist SL. Nature. 2005;435:765–772. doi: 10.1038/nature03679. [DOI] [PMC free article] [PubMed] [Google Scholar]
- 11.Kreplak L, Aebi U. Adv Protein Chem. 2006;73:217–233. doi: 10.1016/S0065-3233(06)73007-8. [DOI] [PubMed] [Google Scholar]
- 12.Seilheimer B, Bohrmann B, Bondolfi L, Muller F, Stuber D, Dobeli H. J Struct Biol. 1997;119:59–71. doi: 10.1006/jsbi.1997.3859. [DOI] [PubMed] [Google Scholar]
- 13.Ma S, Cao X, Mak M, Sadik A, Walkner C, Freedman TB, Lednev IK, Dukor RK, Nafie LA. J Am Chem Soc. 2007;129:12364–12365. doi: 10.1021/ja074188z. [DOI] [PubMed] [Google Scholar]
- 14.Nafie LA. Vibrational Optical Activity: Principles and Applications. Wiley; 2011. [Google Scholar]
- 15.Kurouski D, Lombardi RA, Dukor RK, Lednev IK, Nafie LA. Chem Commun. 2010;46:7154–7156. doi: 10.1039/c0cc02423f. [DOI] [PubMed] [Google Scholar]
- 16.Rubin N, Perugia E, Wolf SG, Klein E, Fridkin M, Addadi L. J Am Chem Soc. 2010;132:4242–4248. doi: 10.1021/ja909345p. [DOI] [PubMed] [Google Scholar]
- 17.Xu M, Shashilov V, Lednev IK. J Am Chem Soc. 2007;129:11002–11003. doi: 10.1021/ja073798w. [DOI] [PubMed] [Google Scholar]
- 18.Sikirzhytski V, Topilina NI, Higashiya S, Welch JT, Lednev IK. J Am Chem Soc. 2008;130:5852–5853. doi: 10.1021/ja8006275. [DOI] [PubMed] [Google Scholar]
- 19.Lednev IK. Protein Structures, Methods in Protein Structures and Stability Analysis. In: Uversky VN, Permyakov EA, editors. Nova Sci. 2007. pp. 1–26. [Google Scholar]
- 20.Shashilov VA, Sikirzhytski V, Popova LA, Lednev IK. Methods. 2010;52:23–37. doi: 10.1016/j.ymeth.2010.05.004. [DOI] [PubMed] [Google Scholar]
- 21.Hildebrandt PG, Copeland RA, Spiro TG, Otlewski J, Laskowski M, Jr, Prendergast FG. Biochemistry. 1988;27:5426–5433. doi: 10.1021/bi00415a007. [DOI] [PubMed] [Google Scholar]
- 22.Xu M, Ermolenkov VV, Uversky VN, Lednev IK. J Biophotonics. 2008;1:215–229. doi: 10.1002/jbio.200710013. [DOI] [PubMed] [Google Scholar]
- 23.Xu M, Ermolenkov VV, He W, Uversky VN, Fredriksen L, Lednev IK. Biopolymers. 2005;79:58–61. doi: 10.1002/bip.20330. [DOI] [PubMed] [Google Scholar]
- 24.Kurouski D, Lauro W, Lednev IK. Chem Commun. 2010;46:4249–4251. doi: 10.1039/b926758a. [DOI] [PubMed] [Google Scholar]
Associated Data
This section collects any data citations, data availability statements, or supplementary materials included in this article.


