

Background: Microsomal triglyceride transfer protein (MTP) inhibition augments plasma transaminases, however, mechanisms are unknown.
Results: MTP inhibition increased endoplasmic reticulum (ER) stress and induced GPT/GOT1 transcription through the Ire1α/cJun pathway.
Conclusion: Transcriptional up-regulation and increased synthesis contribute to augmentations in plasma ALT/AST.
Significance: Increased transcription of the transaminase genes may reflect a mechanism for hepatocyte survival after ER stress.
Keywords: Cardiovascular Disease, Cell Metabolism, Cholesterol, Endoplasmic Reticulum Stress, Lipids, Lipid Binding Protein, Lipid Metabolism, Lipoprotein, Lipoprotein Metabolism, Liver Injury
Abstract
Microsomal triglyceride transfer protein (MTP) is a target to reduce plasma lipids because of its indispensable role in triglyceride-rich lipoprotein biosynthesis. MTP inhibition in Western diet fed mice decreased plasma triglycerides/cholesterol, whereas increasing plasma alanine/aspartate aminotransferases (ALT/AST) and hepatic triglycerides/free cholesterol. Free cholesterol accumulated in the endoplasmic reticulum (ER) and mitochondria resulting in ER and oxidative stresses. Mechanistic studies revealed that MTP inhibition increased transcription of the GPT/GOT1 genes through up-regulation of the IRE1α/cJun pathway leading to increased synthesis and release of ALT1/AST1. Thus, transcriptional up-regulation of GPT/GOT1 genes is a major mechanism, in response to ER stress, elevating plasma transaminases. Increases in plasma and tissue transaminases might represent a normal response to stress for survival.
Introduction
Apolipoprotein B (apoB)2-containing lipoprotein overproduction can cause hyperlipidemia and increase risk of atherosclerosis. The Adult Treatment Panel III guidelines advocate lowering of these lipoproteins to achieve LDL cholesterol of <70 mg/dl in high-risk patients (1), which is difficult to achieve with statin therapy alone (2). One possibility is to inhibit lipoprotein biosynthesis that requires the microsomal triglyceride transfer protein (MTP) (3). MTP inhibitors lower plasma lipids, but they increase plasma transaminases and hepatic fat (4). The aim of this study was to decipher mechanisms that lead to increases in plasma transaminases after MTP inhibition.
Plasma transaminases (ALT/AST) are used to ascertain liver function (5). It is believed that these enzymes increase due to the release of intracytosolic contents from dying/injured hepatocytes (6). But, Pratt and Kaplan (7) saw a poor correlation between liver-cell damage and plasma transaminases. Therefore, the association between hepatocyte injury and plasma transaminases is unclear and mechanisms for their increases remain unexplained. We hypothesized that increases in plasma transaminases might not be solely due to hepatocyte injury.
To understand the molecular events linking hepatic lipid accumulation to elevations in plasma transaminases, we inhibited MTP using chemical antagonists, identified biochemical changes in plasma and subcellular organelles, and explained molecular events leading to increases in plasma ALT/AST. Our studies indicate that increases in plasma transaminases are secondary to ER stress.
EXPERIMENTAL PROCEDURES
Animals
C57BL/6J male mice were from Jackson Laboratory. Ire1αfl/fl mice (8) were transduced with AAV-TBG.Cre to obtain liver-specific Ire1α−/− mice. All animals were kept in 07:00–19:00 h lighting schedule and had free access to water and chow (Lab Diet 5001, Purina Diets) or Western (Research Diet 88137, Harlan Teklad) diets. Mice were injected intraperitoneally with 100 μl containing tunicamycin (1.5 mg/kg (9)). Alternatively, mice were gavaged daily with lovastatin (50 mg/kg/day (10)), MTP inhibitor (MTPi) (1 mg of BMS212122/kg/day (11)), or pioglitazone (25 mg/kg/day (12)) in DMSO (20 μl). Animals were anesthetized and blood was collected from the heart or retro-orbital sinuses. The Institutional Animal Care and Use Committee approved all procedures.
Plasma/Tissue Lipid and Lipoprotein Analysis
Plasma-free glycerol was measured using a kit (Sigma) and was subtracted from total triglyceride (ThermoFisher Scientific). Plasma total cholesterol (ThermoFisher Scientific), free cholesterol, and free fatty acids (Wako Chemicals) were measured using kits. Esterified cholesterol was calculated by subtracting free cholesterol from total cholesterol. Plasma HDL was isolated after precipitating apoB lipoproteins using phosphotungstate/MgCl2 reagent (13) and lipids were measured.
Different Measurements
GSH was measured using GSH-Glo (Promega). Pro-inflammatory cytokines were measured using a custom mouse ELISA panel (SABiosciences). Lactate dehydrogenase was measured using a kit (Tox-7, Sigma). Luminescence was measured using the Dual Luciferase Reporter Assay System (Promega). Liver pieces (∼25 mg) were homogenized in buffer K (1 mm Tris-HCl, pH 7.6, 1 mm EGTA, 1 mm protease inhibitor mixture, PhoSTOP) and lipids were extracted (14), quantified, and normalized to cellular protein. The remaining homogenates were used for mRNA quantification, caspase assays, and Western blot analysis or were centrifuged at 13,000 × g for 30 min at 4 °C for MTP activity assay (Chylos Inc.) (15). ChIP was performed utilizing the Pierce Agarose ChIP kit (ThermoFisher Scientific). To measure transaminases, 2–5 μl of plasma or 10–20 μl of media obtained from 6-well plates were used for ALT/AST assays using specific kits from BioTron Diagnostics (Hemet, CA) according to the manufacturer's guidelines.
For caspase activity assays, liver pieces (∼25 mg) were homogenized in 1 ml of Buffer K and centrifuged (15,000 × g, 15 min, 4 °C) and used to measure different caspases. Supernatants containing 50–100 μg of protein were incubated at 37 °C for 2 h in Buffer I (25 mm HEPES buffer, pH 7.5, containing 0.1% CHAPS, 10% sucrose, 2 mm DTT, and appropriate caspase substrate). Substrate cleavage was detected at 405 nm (16). Activities were assessed by measuring changes between 0 and 2 h measurements.
Histology
Liver pieces were fixed in a 10% formalin overnight, dehydrated in a 30% sucrose, embedded in M1 cryo-preservation media at −20 °C and stored at −70 °C. Sections (7 microns) were placed on Tissue-Tack (Polysciences) slides, dehydrated in 60% isopropyl alcohol, immersed in 1% Oil Red O for 30 min at 22 °C, washed in 60% isopropyl alcohol, rinsed in tap water for 10 s, counterstained in Gills hematoxylin for at least 20 min, rinsed in tap water until clear, acidified in alcohol (0.4% HCl in 95% ETOH), rinsed in tap water again, and dipped in basic solution (0.03 n NaOH) until sections visibly darkened. Images were taken with the SPOT RT3 Digital Camera and SPOT software from Imaging Diagnostics.
Cell Culture
Huh-7 cells were grown in Dulbecco's modified Eagle's medium (CellGro) containing 10% fetal bovine serum (FBS) supplemented with l-glutamine and antibiotics. In experiments where ALT/AST activities were to be measured, cells were incubated in dye-free DMEM containing 1% serum for 24 h. Plasmids/siRNA were transfected into cells using FuGENE HD (Promega)/RNAi Max (Life Sciences Technologies), respectively, according to the manufacturer's instructions. MTPi, tunicamycin, and staurosporine treatments occurred for 24 h at specified concentrations. Media were harvested; protease inhibitor mixture was added and used to measure ALT/AST. Cells were lifted using Corning Cell Lifters in Buffer K and were used for MTP activity assays (Chylos) (15), mRNA quantifications, and Western blot analyses.
Metabolic Labeling
Huh-7 cells cultured in 6-well plates were treated with MTP inhibitors for 24 h in DMEM supplemented with 10% FBS, l-glutamine, and antibiotics. Wells were washed twice with PBS and then incubated with l-cysteine/l-methionine and serum-free DMEM. After 1 h, cells were washed twice with PBS and continuously labeled for up to 4 h with 150 μCi/well of 35S-Promix (Perkin Elmer) in l-cysteine/l-methionine-free 1% FBS containing DMEM with/without MTPi. For pulse-chase studies, cells were washed twice with PBS incubated with l-cysteine/l-methionine and serum-free DMEM with/without MTPi for 1 h, washed twice, and pulse labeled for 1 h with 300 μCi/well of 35S-Promix in l-cysteine/l-methionine and serum-free DMEM with/without MTPi. For chase, cells were washed and incubated with DMEM containing 1% FBS, 1 mm cold l-methionine and l-cysteine (Sigma) with/without MTPi. Media was harvested in the presence of protease inhibitors. Cells were washed twice with PBS prior to lysis with RIPA buffer (50 mm Tris-Cl, pH 8, 150 mm NaCl, 1% Nonidet P-40, 0.5% sodium deoxycholate, 0.1% SDS + protease inhibitor mixture). Media and lysates were immunoprecipitated, resolved on 4–15% gels, dried, placed on a phosphor screen (GE Healthcare), and imaged on the Storm 860 Molecular Imager (GE Healthcare).
Propidium Iodide Staining for Cellular Imaging and Flow Cytometry
Huh-7 Cells were grown in 6-well plates and subjected to appropriate treatments. Cells were trypsinized, centrifuged (100 × g, 10 min), and supernatants were removed. Cell pellets were washed 2 times with PBS by centrifugation and supernatants were discarded. The pellets were resuspended in 70% ethanol and incubated overnight with agitation at −20 °C for fixation. Cells were spun (100 × g, 10 min), washed twice with PBS to remove ethanol, and pellets were stained with 300 μl of DNA staining solution (150 μg/ml of PI, 20 units/ml of RNase A in PBS) for 30 min. After staining, cells were washed 2 times with PBS and finally resuspended in 1 ml of PBS. They were then analyzed by flow cytometry using BD FACScan (BD Biosciences). Cell Quest Pro version 6.0 made histograms and analyses. Cells grown on coverslips were rinsed with PBS and stained with the DNA staining solution (1 ml) as described above for cell pellets. Coverslips were then placed on slides and imaged with the Nikon Eclipse E800 camera and Volocity 5.5.1 software.
mRNA Quantifications and Primers Used
Total RNA from tissues and cells were isolated using TRIzolTM (Invitrogen). The purity and integrity of RNA were assessed by the A260/A280 ratio and 1% agarose gel electrophoresis, respectively. RNA preparations with A260/A280 ratios more than 1.7 were used for cDNA synthesis. The first strand cDNA was synthesized using Omniscript RT (Qiagen) kit. Each reaction of quantitative RT-PCR was carried out in a volume of 20 μl, consisting of 5 μl of cDNA sample (1:100 dilution of the first strand cDNA sample) and 15 μl of PCR master mix solution containing 1× PCR buffer (qPCRTM Core Kit for SYBR Green I, Eurogentec). The PCR was carried out by incubating the reaction mixture first for 10 min at 95 °C followed by 40 cycles of 15-s incubations at 95 °C and 1 min at 60 °C in the ABI 7000 SDS PCR machine. Data were analyzed using the ΔΔCT method according to the manufacturer's instruction and presented as arbitrary units. Primers used are listed in supplemental Table S1. Data were normalized to ARPp0 mRNA.
Statistical Analyses
Data are presented as mean ± S.D. Statistical significance was determined using one-way analysis of variance and comparisons between groups were analyzed using the Newman-Keuls post-test (GraphPad Prism 5).
RESULTS
Increases in Hepatic-free Cholesterol Are Associated with Elevations in Plasma ALT/AST after MTP Inhibition in Mice
Western diet fed (WDF) C57Bl6J mice were utilized because MTP inhibition and gene deletion in chow fed mice did not cause ER stress or increase plasma ALT/AST levels (17, 18). Second, MTP inhibitor therapy is under evaluation for treatment of hyperlipidemia (4, 19). MTPi in WDF mice significantly reduced hepatic MTP activity (Fig. 1A), increased triglycerides (Fig. 1B) and free cholesterol (Fig. 1C), and had no effect on free fatty acids (Fig. 1D). Increased hepatic triglyceride and free cholesterol is consistent with previous studies (17, 20). Increases in hepatic free cholesterol after MTP inhibition occur as accumulation of cholesterol ester inhibits their synthesis and enhances cellular free cholesterol accumulation (20).
FIGURE 1.
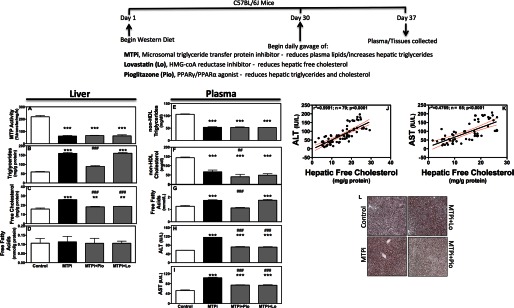
Association between hepatic free cholesterol in MTP inhibited mice and increases in plasma ALT/AST. Male C57BL/6J mice were fed a Western diet for 30 days and divided into 4 groups (n = 4/group) and continued to receive Western diet ad libitum for an additional week. During the last week, mice were gavaged daily with DMSO (Control), MTPi (1 mg of BMS212122/kg/day), MTPi + pioglitazone (MTPi + Pio, 25 mg/kg/day), or MTPi + lovastatin (MTPi + Lo, 50 mg/kg/day). Data are representative of three experiments. A–I, hepatic tissue was used to measure MTP activity and lipids (A–D). Plasma was used to quantify lipids and transaminases (E–I). Comparisons with Controls and MTPi are designated with * and #, respectively. Values are mean ± S.D.; *, #, p < 0.05; **, ##, p < 0.01; ***, ###, p < 0.001. J and K, values for hepatic free cholesterol were plotted against plasma ALT (J) and AST (K) levels from 6 independent experiments. A linear regression and Pearson correlation was performed. The black line represents the linear regression with the red dots adjacent to the line indicate the 95% confidence interval. The r2 and significance of correlation were determined after the analysis with a Pearson correlation test. L, representative Oil Red O-stained sections of livers.
MTPi significantly lowered plasma triglycerides (Fig. 1E) and cholesterol (Fig. 1F) in non-HDL apoB-lipoproteins, whereas increasing plasma free fatty acids (Fig. 1G), ALT (Fig. 1H), and AST (Fig. 1I) as compared with controls consistent with other studies (19). To determine whether hepatic lipid accumulation contributes to augmentations in plasma transaminases, we studied the effects of pioglitazone, an agonist of peroxisome proliferator-activated receptor γ/peroxisome proliferator-activated receptor α (12) that reduces hepatic triglycerides and cholesterol, and lovastatin (10), which reduces hepatic cholesterol. Pioglitazone and lovastatin had no added effect on MTP activity in MTPi-treated animals (Fig. 1A). Although pioglitazone reduced hepatic triglycerides, lovastatin did not (Fig. 1B). Both compounds reduced hepatic free cholesterol (Fig. 1C) in MTPi-treated mice. Histological staining substantiated biochemical studies regarding hepatic triglyceride changes (Fig. 1L). MTPi and MTPi + lovastatin-treated mice had higher lipid staining than control and MTPi + pioglitazone groups. These compounds had no additional effect on plasma non-HDL triglycerides and cholesterol (Fig. 1, E and F), but reduced ALT/AST (Fig. 1, H and I) compared with MTPi-treated animals. These studies showed that reductions in free cholesterol are associated with lower plasma transaminases in WDF MTPi-treated mice. Further correlation analyses demonstrated a highly significant (p < 0.0001) positive correlation between hepatic free cholesterol and ALT/AST (Fig. 1, J and K).
Identification of Subcellular Sites That Accumulate Lipids upon MTP Inhibition
We, next, identified sites of free cholesterol accretion in animals treated with MTPi or MTPi + pioglitazone after subcellular fractionation (supplemental Fig. S1). ER and Golgi contained ⅔ and ⅓ of the total MTP activity (Fig. 2A); this activity was reduced after MTPi and MTPi + pioglitazone treatments. Triglycerides were in the cytosol, mitochondria/peroxisomes, and ER of control animals (Fig. 2B). Separation of mitochondria from peroxisomes showed that triglycerides were not with mitochondria (not shown). MTPi increased triglycerides in these fractions but not when pioglitazone was also administered. Free cholesterol was mainly in the plasma membrane, but also in significant quantities in the ER and mitochondria/peroxisomes (Fig. 2C). MTPi increased free cholesterol in the ER and mitochondria/peroxisomes by 3.3- and 2.7-fold, respectively; these increases were less or not seen after pioglitazone treatment. Thus, MTPi enhances free cholesterol in the ER and mitochondria.
FIGURE 2.

MTP inhibition increases free cholesterol in different organelles and induces oxidative and ER stress. A–D, male C57BL/6J mice fed a Western diet were gavaged with DMSO (Control, n = 4), MTPi (n = 5), or MTPi + pioglitazone (MTPi + Pio, n = 5). Data are representative of 3 different experiments. Subcellular liver fractions were utilized to measure MTP activity (A), triglycerides (B), free cholesterol (C), and total GSH (D). E, Western blot analysis of ER stress response proteins. F, mRNA levels of hepatic ER stress effectors were measured by quantitative RT-PCR and normalized to ARPp0 mRNA. Comparisons with Control groups are designated with *. Comparisons with MTPi groups are designated with #. Values are mean ± S.D.; *, #, p < 0.05; **, ##, p < 0.01; ***, ###, p < 0.001.
MTP Inhibition Induces Stress Pathways
Intracellular accumulation of free cholesterol elicits different cellular responses. Increases in mitochondrial free cholesterol are associated with oxidative stress (21). Therefore, we measured antioxidant levels and found that MTPi-treated (Fig. 2D) animals had lower levels of the reduced form of glutathione (GSH) in the mitochondria/peroxisome and cytosol. These changes were avoided by pioglitazone. Excess free cholesterol causes ER stress in macrophages (22). To assess whether this occurs in hepatocytes, we measured the protein levels of p-IRE1α, p-PERK, BiP, and p-eIF2α (Fig. 2, E), and mRNA levels of Bip, Ire1α, Perk, and Atf6 (Fig. 2F). MTPi increased the protein and mRNA levels of all the studied ER stress markers and these changes were attenuated in animals co-treated with lovastatin and pioglitazone. These studies suggest that hepatic MTP inhibition elicits oxidative and ER stress that is diminished by pioglitazone.
MTP Inhibition Increases Plasma Transaminases without Affecting Cell Viability
We next aimed to understand mechanisms that increase plasma ALT/AST after MTP inhibition. Because ER and oxidative stress activate inflammatory pathways, we measured plasma cytokines; MTPi did not alter plasma pro-inflammatory cytokines compared with controls (Fig. 3A). Hepatic protein levels of IL-6 and TNFα (Fig. 3, B and C), two cytokines elevated in non-alcoholic steatohepatitis (23), were not increased in the livers of MTPi-treated mice. Thus, MTP inhibition does not affect cytokine levels.
FIGURE 3.

MTP inhibitor does not increase cytokine levels or cell death. A–C, C57BL/6J (n = 6) mice were fed Western diet for 37 days. DMSO (Control) or MTPi was administered in the last 7 days. A, ELISA was used to assay plasma cytokines (SABiosciences). Plasma samples from 2 animals were pooled. Therefore, data are average and S.D. of 3 determinations. B, Western blot analysis of proteins associated with inflammation. C, protein bands were quantified. D, lactate dehydrogenase (LDH) was assessed from plasma samples obtained from animals as described in the legend to Fig. 2. E, different caspase activities were measured in the livers of mice from Fig. 2. F, C57BL/6J mice on chow diet were injected intraperitoneally with 1.5 mg/kg of tunicamycin. Livers were collected after 24 h and used to measure caspase activities. G, Huh-7 cells on coverslips were treated with either 1 μm MTPi or staurosporine, stained with propidium iodide (PI), and photographed. Data are representative of three experiments. H–K, Huh-7 cells (n = 3) were treated with 0.5, 1, or 2 μm MTPi or staurosporine (STS) for 24 h. Media were used to measure ALT/AST (H and I). Cells were fixed, stained with PI, and analyzed by flow cytometry. Percent of dead cells (J) is plotted. Flow diagrams (K) illustrate sub-diploid/non-viable and diploid/viable cell counts. Data are representative of three experiments. Comparisons with Controls and MTPi are designated with * and #, respectively. Values are mean ± S.D.; *, #, p < 0.05; **, ##, p < 0.01; ***, ###, p < 0.001.
Because, persistent ER and oxidative stresses induce cell death (21, 22) we hypothesized that MTP inhibition might increase cell death culminating in ALT/AST release. Cell death was measured using three independent approaches. First, lactate dehydrogenase levels, generally used as a marker of cell death, were not different in control, MTPi, and MTPi + pioglitazone-treated animals (Fig. 3D). Second, caspase activities that are increased during apoptosis were similar in these animals (Fig. 3E). As a positive control, tunicamycin-treated mice showed significantly elevated caspase activities (Fig. 3F). These studies suggest that MTPi may not cause cell death. Third, we treated Huh-7 cells with MTPi or staurosporine, an inducer of apoptosis. MTPi did not increase cell death as compared with control, but staurosporine did as evidenced by enhanced propidium iodide staining (Fig. 3G). Cell sorting revealed that <10% of Huh-7 cells were non-viable in control and MTPi-treated cultures (Fig. 3, J and K). However, staurosporine treatment caused a ∼30–50% increase in dead cells (Fig. 3, J and K). MTPi and staurosporine both significantly increased media ALT/AST in a dose-dependent manner (Fig. 3, H and I), however, elevations were higher in staurosporine-treated cells. These results suggest that MTPi increases ALT/AST without causing cell death.
MTP Inhibition Increases Synthesis and Release of Hepatic ALT1 and AST1
Next, we considered other mechanisms that might contribute to ALT/AST release. These enzymes have two isoforms; the cytosolic isoforms are ALT1/AST1 (encoded by GPT/GOT1) and the mitochondrial isoforms are ALT2/AST2 (encoded by GPT2/GOT2). MTPi enhanced GPT and GOT1, but not GPT2 and GOT2, mRNA in Huh-7 cells (Fig. 4A). To ascertain whether mRNA decay contributes to increases in mRNA, MTPi-treated cells were exposed to actinomycin D to block gene transcription. The decay rates of GPT/GOT1 mRNA were similar in MTPi-treated and control cells (Fig. 4, B and C) eliminating post-transcriptional mechanisms. In contrast, MTPi enhanced luciferase activity when expressed under the control of GOT1 and GPT promoters indicating transcriptional up-regulation (Fig. 4D). Next, we tested whether tunicamycin, an inducer of ER stress, also up-regulates these enzymes and found that it also increased luciferase activity. These findings suggest that MTPi enhances ALT/AST through transcriptional up-regulation.
FIGURE 4.
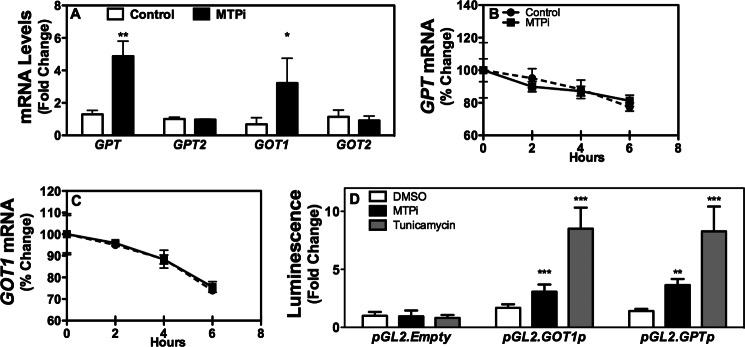
MTPi increases transcription of GPT and GOT1. A, Huh-7 cells (n = 3) were treated with 1 μm MTPi for 48 h and ALT1/2 (GPT/GPT2) and AST1/2 (GOT1/GOT2) mRNA levels were measured. B and C, Huh-7 cells were treated with or without 1 μm MTPi for 48 h. Cells then received actinomycin D (10 μg/ml) for the indicated times. Cell lysates were used to quantify mRNA levels and ratios at time 0 were normalized to 100%. Percent change with time is plotted. D, Huh-7 cells (n = 3) were transfected with plasmids (1 μg) expressing firefly luciferase under the control of GPT and GOT1 promoters for 24 h, and then treated with 1 μm MTPi or 1 μm tunicamycin for 24 h. Luminescence was determined in cell lysates (n = 3 per group). Data are representative of three experiments. Values are mean ± S.D. *, p < 0.05; **, p < 0.01; ***, p < 0.001 compared with DMSO treatment (Control).
We also expressed GPT and GOT1 under a cytomegalovirus promoter leading to enhanced ALT1 and AST1 levels in cells (supplemental Fig. S2, A and B) and media (supplemental Fig. S2, C and D); these levels were unaffected by MTPi. Next, we determined the relative distribution of ALT/AST in cells and media and found that ∼4–7% of the cellular ALT/AST was in the media under different conditions (supplemental Fig. S2, E and F). These studies suggest that GPT/GOT1 promoters are needed for MTPi to increase ALT1/AST1. Furthermore, it appears that a constant proportion of cellular ALT/AST is present in the media.
Next, we studied protein synthesis. Continuous pulse labeling demonstrated increased amounts of ALT1/AST1 in MTPi-treated cell lysates and media compared with control cells (Fig. 5, A–G). At 4 h, MTPi-treated cells and media contained ∼2–4-fold higher amounts of ALT1/AST1. Conversely, MTPi had no effect on cellular and media albumin (Fig. 5, A, F, and G). These data suggest that MTPi increases synthesis and release of ALT1/AST1.
FIGURE 5.

MTP inhibition increases synthesis of ALT1 and AST1. A, Huh-7 cells treated with 1 μm MTPi for 24 h were continuously labeled with 150 μCi of 35S-Promix for the indicated times. Different proteins were immunoprecipitated using appropriate antibodies from cell lysates and media. Representative data are from 4 experiments. B–G, quantifications of proteins shown in panel A. H, Huh-7 cells were treated with or without 1 μm MTPi for 24 h, pulse labeled with 300 μCi of 35S-Promix labeling mix for 1 h, and chased with 1% FBS containing DMEM with/without MTPi in the presence of 1 mm cold l-methionine/l-cysteine for the indicated times. Proteins were immunoprecipitated from cell lysates and media using specific antibodies. Data are representative of five experiments. I–P, quantifications of proteins shown in panel H. Values at the beginning of the chase time 0 (lysate time 0) were normalized to 100%. Values at different times in cell lysates and media represent a percentage of the values at time 0. AU, absorbance unit.
To investigate the contribution of post-translational processing to media AST/ALT, we performed pulse-chase studies (Fig. 4, H–P). As expected from Fig. 5A, at the end of the pulse there were higher amounts of ALT1/AST1 proteins in MTPi-treated cells (Fig. 5H, 0 h). After normalizing the amounts at time 0 to 100%, we observed that their rates of intracellular disappearance and appearance in the media (Fig. 5, H and I–L) were similar in control and MTPi-treated cells. Approximately, ∼3–4% of the labeled proteins were secreted to media (Fig. 5, H, J, and L). MTPi significantly inhibited apoB synthesis/secretion with no effect on albumin (Fig. 5, H and M–P). These studies indicate that MTPi does not affect post-translational processing of ALT/AST.
IRE1α Is Involved in Increasing Cellular and Media ALT1/AST1 after MTP Inhibition
The data presented thus far indicates that MTPi induces ER stress and ALT1/AST1 transcription leading to increased protein synthesis and release from cells. To identify the transducer(s) responsible for increases in media AST/ALT, we introduced different siRNAs targeting IRE1α, PERK, or ATF6 into Huh-7 cells and treated them with or without MTPi (Fig. 6A). Individual siRNAs reduced the respective ER stress transducers with no effects on others suggesting specific gene knockdown. For example, siIRE1α reduced its mRNA levels without affecting PERK, ATF-6, GPT, and GOT1. MTPi increased GPT/GOT1 mRNA in siControl, siPERK, and siATF-6, but not in siIRE1α-treated cells (Fig. 6A), suggesting that the MTPi-induced changes in GPT/GOT1 mRNA require IRE1α.
FIGURE 6.

MTPi induced elevations in plasma ALT/AST are IRE1α dependent. A, siRNA (100 pmol) targeting human IRE1α, PERK, and ATF-6 were transfected for 24 h into Huh-7 cells and then treated with or without 1 μm MTPi for an additional 24 h. mRNA were extracted to measure different transcripts by qRT-PCR. Data were normalized to ARPp0 mRNA (n = 3). Data are representative of three experiments. B–I, 14 days after the onset of Western diet feeding, Ire1αfl/fl animals were divided into 2 groups (n = 4/group) and injected intravenously with either AAV2/8.TBG.PI.luciferase.RBG (Ire1αfl/fl) or AAV2/8.TBG.PI.Cre.RBG (L-Ire1α−/−). Beginning at day 30, animals were gavaged daily with or without MTPi for 7 days. Data are representative of two experiments. Hepatic mRNA was used to measure gene expression (B). Liver homogenates were used to measure MTP activity and lipids (C–E). Plasma samples were used to quantify lipids (F and G) and transaminases (H and I). Comparisons with Ire1αfl/fl animals are designated with *. Comparisons with Ire1αfl/fl + MTPi-treated animals are designated with #. Values are mean ± S.D. *, #, p < 0.05
To verify in vivo involvement of IRE1α in promoting ALT1/AST1 transcription, we generated liver-specific Ire1α-deficient (L-Ire1α−/−) mice through intravenous injection of adeno-associated virus expressing the Cre recombinase under the control of the liver-specific thyroxin-binding globulin promoter (AAV2/8-TBG.Cre) into Ire1αfl/fl mice (8). Ire1αfl/fl mice receiving AAV2/8-TBG.Luciferase served as controls. AAV2/8-TBG.Cre significantly reduced Ire1α but not Perk, Atf6, Gpt, and Got1 mRNA compared with controls (Fig. 6B, L-Ire1α−/−) indicating specific deletion and that Ire1α ablation does not increase Perk, Atf6, Gpt, and Got1 mRNA compared with controls. MTPi increased Perk and Atf6 mRNA in both Ire1αfl/fl and L-Ire1α−/− mice (Fig. 6B). In contrast, MTPi enhanced Ire1α mRNA in Ire1αfl/fl but not in L-Ire1α−/− mice. Similarly, MTPi increased Gpt/Got1 mRNA in Ire1αfl/fl but not in L-Ire1α−/− mice (Fig. 6B). Ire1α deficiency had no significant effect on hepatic MTP activity, triglycerides, and free cholesterol levels (Fig. 6, C–E, open bars) indicating that it does not affect these parameters. MTPi inhibited MTP activity and increased hepatic triglycerides and free cholesterol in both Ire1αfl/fl and L-Ire1α−/− mice to similar extents (Fig. 6, C–E). These data illustrate that Ire1α deficiency does not affect the MTPi-mediated increase in hepatic triglycerides and free cholesterol, but prevents increases in Gpt/Got1 mRNA.
Next, we ascertained the effects of Ire1α deficiency on plasma lipids and transaminases. L-Ire1α−/− mice had significantly lower plasma lipids compared with Ire1αfl/fl mice (Fig. 6, F and G). MTPi reduced plasma lipids in both Ire1αfl/fl and L-Ire1α−/− mice; these reductions were more pronounced in Ire1αfl/fl mice. Plasma ALT/AST were similar in Ire1αfl/fl and L-Ire1α−/− mice; however, MTPi significantly increased these enzymes in Ire1αfl/fl but not in L-Ire1α−/− mice (Fig. 6, H and I) providing in vivo evidence that IRE1α is required for increases in plasma ALT/AST after MTP inhibition.
IRE1α Recruits cJun to Increase GPT/GOT1 Transcription
Next, we attempted to understand how Ire1α increases gene transcription. Activated Ire1α transduces its signal by directly splicing the XBP-1 mRNA (24) and through indirect phosphorylation of the c-Jun transcription (p-cJun) involving Traf2, Ask1, and JNK (Fig. 7A) (24). To monitor downstream mediators of Ire1α, we studied changes in spliced XBP-1 (XBP-1s) and p-cJun protein levels. MTPi increased XBP-1(s) protein and p-cJun in Ire1αfl/fl mice (Fig. 7, B and C). L-Ire1α−/− mice had lower levels of XBP-1(s) and p-cJun, which did not increase upon MTPi treatment (Fig. 7, B and C). These studies indicate that MTP inhibition leads to increases in p-cJun and XBP-1(s).
FIGURE 7.
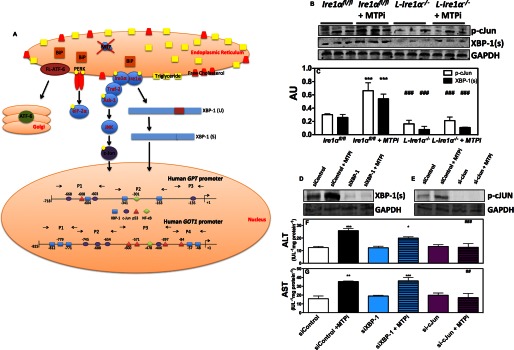
IRE1α mediates transcriptional activation of GPT and GOT1 through cJun. A, proposed schematic model of MTPi-mediated elevations in plasma/media ALT1 and AST1. Cellular free cholesterol accumulation after MTPi treatment induces ER stress. Autophosphorylation of IRE1α leads to splicing of XBP-1. Furthermore, phosphorylated IRE1α interacts with Traf-2 and Ask1 to activate JNK, leading to phosphorylation of the cJun transcription factor. In the nucleus, a schematic diagram shows conserved cis regions in GPT and GOT1 promoters for the binding of XBP-1, cJun, p53, and NF-κB identified after aligning promoter sequences from different species. P1, P2, P3, and P4 denote different promoter regions amplified using primers (→ and ←) described in supplemental Table S1. B, Western blot analysis of XBP-1(s) and p-cJun in liver homogenates of Ire1αfl/fl and L-Ire1α−/− mice treated or not with MTPi in Fig. 5. C, quantification of blots in panel B. D–G, Huh7 cells (n = 3) were transfected with 100 pmol of siRNA targeting cJun or XBP-1 for 24 h. Cells were then treated with/without 1 μm MTPi for 24 h. Lysates (D and E) and media (F and G) were harvested for Western blot analysis and ALT/AST activity measurements, respectively. Comparisons with MTPi-treated siControl cells are designated with * and #, respectively. Values are mean ± S.D. *, #, p < 0.05; **, ##, p < 0.01; ***, ###, p < 0.001.
To evaluate the role of XBP-1(s) and p-cJun in the transcription of ALT1/AST1, we exposed Huh-7 cells to si-cJun or si-XBP-1, incubated with or without MTPi, and measured the media ALT/AST activities. si-XBP-1 and si-cJun reduced their own levels in both control and MTPi-treated cells (Fig. 7, D and E). si-cJun and si-XBP-1 had no effect on basal ALT/AST levels (Fig. 7, F and G). MTPi increased ALT/AST in si-Control and si-XBP-1 cells but not in si-cJun-treated cells, signifying the importance of cJun in increasing media ALT/AST after MTP inhibition.
To determine whether p-cJun binds to GPT/GOT1 promoters, we aligned promoter regions from different animals and observed that they contain conserved putative binding sites for XBP-1(s), p53, p-cJun, and NF-κB (Fig. 7A, nucleus). Next, we performed ChIP and amplified different regions using specific primers (supplemental Table S1) to study the binding of these transcription factors to GPT/GOT1 promoters. Under basal conditions, p-cJun and XBP-1(s) did not bind to GPT (Fig. 8, A, D, and E) and GOT1 promoters (Fig. 8, B, F, and G). In contrast, RNA polymerase II was found associated with the GPT P3 (Fig. 8A) and GOT1 P3 (Fig. 8G) regions. Furthermore, polymerase II bound to the GAPDH promoter, but p-cJun and XBP-1(s) did not (Fig. 8C). MTPi significantly enhanced association of p-cJun to the GPT P3 and GOT1 P2 regions (Fig. 8, A and B) but not to other regions (Fig. 8, D–G). XBP-1(s) did not associate with the GPT or GOT1 promoters (Fig. 8, A, B, and D–G). These data suggest that MTPi increases p-cJun binding to GPT/GOT1 promoters.
FIGURE 8.

cJun binds to the GPT and GOT1 promoters in MTP inhibited cells. A–G, Huh-7 cells treated with or without 1 μm MTPi were utilized for ChIP using control IgG, anti-polymerase II, anti-p-cJun, and anti-XBP-1 antibodies. Quantitative PCR was performed to amplify different promoter regions and data are represented as a percent of input DNA. Regions that showed significant amplifications are shown. Comparisons with controls are designated with *. Values are mean ± S.D., n = 3. *, p < 0.05; **, p < 0.01; ***, p < 0.001. H–N, siControl or si-cJun (100 pmol) were transfected into Huh-7 cells for 24 h. Cells were treated with 1 μm MTPi for an additional 24 h. ChIP was performed utilizing antibodies targeting XBP-1, p-cJun, NF-κB, and p53. Positive association of transcription factors was ascertained when a minimum of 0.1% input DNA was amplified. Comparisons with siControl-treated cells are designated with *. Values are mean ± S.D. *, p < 0.05; **, p < 0.01; ***, p < 0.001; n = 3 per group.
To evaluate further the role of p-cJun, we performed ChIP in cells transfected with siControl or si-cJun and treated with MTPi. No significant binding of XBP-1(s), NF-κB, or p53 to different regions of the GPT/GOT1 promoters was observed in cells treated with either siControl/MTPi or si-cJun/MTPi (Fig. 8, H–N). However, there was significant binding of p-cJun to the GPT P3 and GOT1 P2 (Fig. 8, H and I) but not to other regions (Fig. 8, J–N) in siControl/MTPi-treated cells. This binding was not seen in si-cJun/MTPi-treated cells (Fig. 8, H and I). These studies suggest that p-cJun does not interact with GPT/GOT1 promoters under basal conditions; however, MTPi treatment enhances its binding to specific regions in these promoters.
DISCUSSION
These studies demonstrate that IRE1α and p-cJun are involved in elevating plasma transaminases after MTP inhibition. p-cJun interacts with specific cis-elements in the promoters of GPT/GOT1 thereby enhancing transcription and increasing synthesis and release of these enzymes from cells.
Due to the established role of MTP in the biosynthesis of triglyceride-rich lipoproteins, it is assumed that elevations in plasma ALT/AST associated with MTP inhibition are secondary to accumulation of triglycerides. But, cells synthesize triglycerides to avoid toxicities associated with free fatty acids. In this study we show that elevations in plasma transaminases are ameliorated when hepatic free cholesterol levels were reduced using lovastatin. Furthermore, there appears to be a significant correlation between hepatic free cholesterol levels and increases in plasma transaminases; however, we cannot rule out that free cholesterol is a surrogate marker.
There are conflicting reports about MTP inhibition and increases in plasma ALT/AST in animal studies. Antisense oligonucleotides targeting MTP increased hepatic lipids and plasma ALT/AST in high fat fed mice (25). Björkegren and associates (18) did not see elevations of plasma ALT/AST in chow fed L-MTP−/− mice, but Miyazaki et al. (26) found ALT/AST elevations in female rats fed chow diet and MTP inhibitors. Similarly, reports of ALT/AST elevations after MTP inhibition are inconsistent in humans. Implitapide increased ALT/AST in 12–27% of hyperlipidemic patients (27). CP-346086 elevated plasma transaminases in 3/8 healthy individuals (28). BMS-201038 increased these enzymes in 4/6 familial hypercholesterolemic subjects (4). AEGR-733 elevated transaminases in 32% of moderate hypercholesterolemic patients (19). In most studies, elevations in transaminases are reported as fold-change of the upper limit of the normal range, underestimating responses in individuals with low baselines. Thus, diet, dose, period of treatment, individual responses, and data evaluation strategies might have contributed to variable reports. We observed that MTPi-treated mice fed a Western diet showed modest but statistically significant increases in plasma transaminases that were avoided when pioglitazone or lovastatin was administered along with MTPi.
Although there are reports that exclude ER stress after MTP inhibition in chow fed animals (17) our data illustrates that MTP inhibition in WDF mice increases ER stress. Lee and Glimcher (30) explain that the varied responses to hepatic lipid accumulation might be due to the “limited specificity/sensitivity of the reagents used to detect ER stress markers.”
In our studies, WDF L-Ire1α−/− mice showed slightly reduced MTP activity but these differences did not reach statistical significance. A recent study showed that Ire1α regulates hepatic MTP by modulating PDI levels after 16 h fasting or feeding a high fructose diet for 12 weeks (31). The authors purport that modest reductions in MTP activity are not enough to prevent apoB lipidation (31) and therefore liver-specific Ire1α deficiency alone is unlikely to recapitulate the effects of MTP inhibition.
Our studies identified IRE1α as a key transducer increasing plasma ALT/AST levels after MTPi treatment (supplemental Fig. S3A). IRE1α utilizes the spliced form of XBP-1 or cJun to transduce its signals (24). We identify p-cJun as the mediator of ALT/AST up-regulation. Yu et al. (32) have shown that ob/ob mice treated with antisense oligonucleotides targeting JNK1, an upstream regulator of cJun, had reduced plasma transaminases. Therefore, it is possible that p-cJun-mediated transcriptional up-regulation of ALT/AST is involved in other disease models.
GPT/GOT1 promoters contain several putative binding sites for p-c-Jun, XBP-1(s), NF-κB, and p53. These transcription factors are up-regulated under different stress conditions. Hence, we speculate that ALT/AST might play an important, yet unidentified, novel role in the resolution of various stress responses. One potential function for these enzymes could be related to glutamate metabolism. Besides the synthesis of gluconeogenic substrates, ALT/AST produce glutamate as a by-product that is used for glutathione (GSH) synthesis, a central player that prevents damage during oxidative stress (21). Thus, it is plausible that increases in intracellular ALT and AST provide the glutamate substrate for GSH synthesis.
Glutamate is required for GSH biosynthesis by various tissues except for red blood cells (RBCs). The RBC membrane is impermeable to glutamate and, thus, requires exogenous α-ketoglutarate to synthesize glutamate (33). Plasma glutamate is elevated in metabolic disorders such as NAFLD (34, 35). However, excess glutamate is neurotoxic (36). Therefore, increases in plasma ALT/AST might reduce plasma glutamate by converting it to α-ketoglutarate (supplemental Fig. S3B), which can be taken up by RBCs through sodium-coupled transporters (37). Additionally, these reductions in plasma glutamate lower cerebrospinal fluid glutamate and therefore, provides protection against neurotoxicity (36). We did not evaluate these possibilities, but a few studies manipulating plasma glutamine, a precursor of glutamate, support this hypothesis. Hong et al. (29), demonstrated that glutamine supplementation is associated with decreases in plasma transaminases and increases in hepatic GSH levels in acetaminophen-treated rats. Metabolite profiling revealed an association between the high glutamine:glutamate ratio and lower risk for hepatic insulin resistance (34). Exogenous glutamine administration increased glucose tolerance and decreased blood pressure (35). Thus, it is likely that ALT/AST increase cellular GSH synthesis and reduces plasma glutamate. Our studies have demonstrated that MTP inhibition significantly depletes GSH. Therefore, it is conceivable that induction of these enzymes might increase cellular GSH levels and reduce plasma glutamate levels.
Acknowledgments
We acknowledge the help of Dr. Carol Novotney, Allison Maurice, Elizabeth Rivera, and Kerel Ferguson with animal experiments; David Bowman in Oil Red O staining; Gopalan Gnanaguru and Dr. William Brunken in cellular imaging; Patricia Bettinger, Maria Lopez, Danielle Joseph, Dr. Christopher Roman, and Dr. Stacy Blain in flow cytometry. MTP inhibitor, BMS 212122-01, was kindly provided by Dr. David Gordon, Bristol-Myers Squibb.
This work was supported, in whole or in part, by National Institutes of Health Grant HL095924 (to M. M. H.).

This article contains supplemental Figs. S1–S3 and Table S1.
- apoB
- apolipoprotein B
- ALT
- alanine aminotransferase
- AST
- aspartate aminotransferase
- DMSO
- dimethyl sulfoxide
- ER
- endoplasmic reticulum
- GPT
- glutamic pyruvic transaminase
- GOT
- glutamic oxaloacetic transaminase
- GSH
- reduced glutathione
- HDL
- high density lipoprotein
- MTP
- microsomal triglycerides transfer protein
- MTPi
- MTP inhibitor
- p-eIF2α
- phosphorylated eukaryotic initiation factor 2α
- PI
- propidium iodide
- p-IRE1α
- phosphorylated inositol require enzyme 1α
- p-PERK
- phosphorylated protein kinase like-endoplasmic reticulum kinase
- WDF
- Western diet fed
- XBP-1
- Xbox binding protein-1.
REFERENCES
- 1. Grundy S. M., Cleeman J. I., Merz C. N., Brewer H. B., Jr., Clark L. T., Hunninghake D. B., Pasternak R. C., Smith S. C., Jr., Stone N. J., and Coordinating Committee of the National Cholesterol Education Program (2004) Implications of recent clinical trials for the National Cholesterol Education Program Adult Treatment Panel III Guidelines. J. Am. Coll. Cardiol. 44, 720–732 [DOI] [PubMed] [Google Scholar]
- 2. LaRosa J. C., Grundy S. M., Waters D. D., Shear C., Barter P., Fruchart J.-C., Gotto A. M., Greten H., Kastelein J. J., Shepherd J., Wenger N. K., and Treating to New Targents (TNT) Investigators (2005) Intensive lipid lowering with atorvastatin in patients with stable coronary disease. N. Engl. J. Med. 352, 1425–1435 [DOI] [PubMed] [Google Scholar]
- 3. Hussain M. M., Rava P., Walsh M., Rana M., Iqbal J. (2012) Multiple functions of microsomal triglyceride transfer protein. Nutr. Metab. 9, 14. [DOI] [PMC free article] [PubMed] [Google Scholar]
- 4. Cuchel M., Bloedon L. T., Szapary P. O., Kolansky D. M., Wolfe M. L., Sarkis A., Millar J. S., Ikewaki K., Siegelman E. S., Gregg R. E., Rader D. J. (2007) Inhibition of microsomal triglyceride transfer protein in familial hypercholesterolemia. N. Engl. J. Med. 356, 148–156 [DOI] [PubMed] [Google Scholar]
- 5. Liu R., Pan X., Whitington P. F. (2009) Increased hepatic expression is a major determinant of serum alanine aminotransferase elevation in mice with nonalcoholic steatohepatitis. Liver Int. 29, 337–343 [DOI] [PubMed] [Google Scholar]
- 6. Reichling J. J., Kaplan M. M. (1988) Clinical use of serum enzymes in liver disease. Dig. Dis. Sci. 33, 1601–1614 [DOI] [PubMed] [Google Scholar]
- 7. Pratt D. S., Kaplan M. M. (2000) Evaluation of abnormal liver-enzyme results in asymptomatic patients. N. Engl. J. Med. 342, 1266–1271 [DOI] [PubMed] [Google Scholar]
- 8. Iwawaki T., Akai R., Yamanaka S., Kohno K. (2009) Function of IRE1α in the placenta is essential for placental development and embryonic viability. Proc. Natl. Acad. Sci. U.S.A. 106, 16657–16662 [DOI] [PMC free article] [PubMed] [Google Scholar]
- 9. Nair S., Xu C., Shen G., Hebbar V., Gopalakrishnan A., Hu R., Jain M. R., Liew C., Chan J. Y., Kong A.-N. (2007) Toxicogenomics of endoplasmic reticulum stress inducer tunicamycin in the small intestine and liver of Nrf2 knockout and C57BL/6J mice. Toxicol. Lett. 168, 21–39 [DOI] [PMC free article] [PubMed] [Google Scholar]
- 10. McKenney J. M. (1988) Lovastatin. A new cholesterol-lowering agent. Clin. Pharm. 7, 21–36 [PubMed] [Google Scholar]
- 11. Robl J. A., Sulsky R., Sun C. Q., Simpkins L. M., Wang T., Dickson J. K., Jr., Chen Y., Magnin D. R., Taunk P., Slusarchyk W. A., Biller S. A., Lan S. J., Connolly F., Kunselman L. K., Sabrah T., Jamil H., Gordon D., Harrity T. W., Wetterau J. R. (2001) A novel series of highly potent benzimidazole-based microsomal triglyceride transfer protein inhibitors. J. Med. Chem. 44, 851–856 [DOI] [PubMed] [Google Scholar]
- 12. Kubota N., Terauchi Y., Kubota T., Kumagai H., Itoh S., Satoh H., Yano W., Ogata H., Tokuyama K., Takamoto I., Mineyama T., Ishikawa M., Moroi M., Sugi K., Yamauchi T., Ueki K., Tobe K., Noda T., Nagai R., Kadowaki T. (2006) Pioglitazone ameliorates insulin resistance and diabetes by both adiponectin-dependent and -independent pathways. J. Biol. Chem. 281, 8748–8755 [DOI] [PubMed] [Google Scholar]
- 13. Burstein M., Scholnick H. R., Morfin R. (1970) Rapid method for the isolation of lipoproteins from human serum by precipitation with polyanions. J. Lipid. Res. 11, 583–595 [PubMed] [Google Scholar]
- 14. Bligh E. G., Dyer W. J. (1959) A rapid method of total lipid extraction and purification. Can. J. Biochem. Phys. 37, 911–917 [DOI] [PubMed] [Google Scholar]
- 15. Athar H., Iqbal J., Jiang X. C., Hussain M. M. (2004) A simple, rapid, and sensitive fluorescence assay for microsomal triglyceride transfer protein. J. Lipid. Res. 45, 764–772 [DOI] [PubMed] [Google Scholar]
- 16. Arduino D. M., Esteves A. R., Domingues A. F., Pereira C. M., Cardoso S. M., Oliveira C. R. (2009) ER-mediated stress induces mitochondrial-dependent caspases activation in NT2 neuron-like cells. BMB. Rep. 42, 719–724 [DOI] [PubMed] [Google Scholar]
- 17. Liao W., Hui T. Y., Young S. G., Davis R. A. (2003) Blocking microsomal triglyceride transfer protein interferes with apoB secretion without causing retention or stress in the ER. J. Lipid. Res. 44, 978–985 [DOI] [PubMed] [Google Scholar]
- 18. Björkegren J., Beigneux A., Bergo M. O., Maher J. J., Young S. G. (2002) Blocking the secretion of hepatic very low density lipoproteins renders the liver more susceptible to toxin-induced injury. J. Biol. Chem. 277, 5476–5483 [DOI] [PubMed] [Google Scholar]
- 19. Samaha F. F., McKenney J., Bloedon L. T., Sasiela W. J., Rader D. J. (2008) Inhibition of microsomal triglyceride transfer protein alone or with ezetimibe in patients with moderate hypercholesterolemia. Nat. Clin. Pract. Cardiovasc. Med. 5, 497–505 [DOI] [PubMed] [Google Scholar]
- 20. Iqbal J., Rudel L. L., Hussain M. M. (2008) Microsomal triglyceride transfer protein enhances cellular cholesteryl esterification by relieving product inhibition. J. Biol. Chem. 283, 19967–19980 [DOI] [PMC free article] [PubMed] [Google Scholar]
- 21. Marí M., Caballero F., Colell A., Morales A., Caballeria J., Fernandez A., Enrich C., Fernandez-Checa J. C., García-Ruiz C. (2006) Mitochondrial free cholesterol loading sensitizes to TNF- and Fas-mediated steatohepatitis. Cell. Metab. 4, 185–198 [DOI] [PubMed] [Google Scholar]
- 22. Tabas I. (2002) Consequences of cellular cholesterol accumulation. Basic concepts and physiological implications. J. Clin. Invest. 110, 905–911 [DOI] [PMC free article] [PubMed] [Google Scholar]
- 23. Vuppalanchi R., Chalasani N. (2009) Nonalcoholic fatty liver disease and nonalcoholic steatohepatitis. Selected practical issues in their evaluation and management. Hepatology 49, 306–317 [DOI] [PMC free article] [PubMed] [Google Scholar]
- 24. Walter P., Ron D. (2011) The unfolded protein response. From stress pathway to homeostatic regulation. Science 334, 1081–1086 [DOI] [PubMed] [Google Scholar]
- 25. Crooke R., Baker B., Wedel M. (2008) in Antisense Drug Technology: Principles, Strategies, and Applications (Taylor & Francis Group, L., ed) pp. 614, CRC Press, Boca Raton, FL [Google Scholar]
- 26. Miyazaki, Miwa S., Kodama H., Yamada H., Nagata K., Toriumi W., Kitamura K., Kume E. (2007) Hepatic and intestinal changes in rats treated with T-0126, a microsomal triglyceride transfer protein (MTP) inhibitor. J. Toxicol. Sci. 32, 161–177 [DOI] [PubMed] [Google Scholar]
- 27. Chang G., Ruggeri R. B., Harwood H. J. (2002) Microsomal triglyceride transfer protein (MTP) inhibitors. Discovery of clinically active inhibitors using high-throughput screening and parallel synthesis paradigms. Curr. Opin. Drug Discov. Devel. 5, 562–570 [PubMed] [Google Scholar]
- 28. Chandler C. E., Wilder D. E., Pettini J. L., Savoy Y. E., Petras S. F., Chang G., Vincent J., Harwood H. J. (2003) CP-346086. An MTP inhibitor that lowers plasma cholesterol and triglycerides in experimental animals and in humans. J. Lipid. Res. 44, 1887–1901 [DOI] [PubMed] [Google Scholar]
- 29. Hong R. W., Rounds J. D., Helton W. S., Robinson M. K., Wilmore D. W. (1992) Glutamine preserves liver glutathione after lethal hepatic injury. Ann. Surg. 215, 114–119 [DOI] [PMC free article] [PubMed] [Google Scholar]
- 30. Lee A. H., Glimcher L. H. (2009) Intersection of the unfolded protein response and hepatic lipid metabolism. Cell. Mol. Life Sci. 66, 2835–2850 [DOI] [PMC free article] [PubMed] [Google Scholar]
- 31. Wang S., Chen Z., Lam V., Han J., Hassler J., Finck B. N., Davidson N. O., Kaufman R. J. (2012) IRE1α-XBP1s induces PDI expression to increase MTP activity for hepatic VLDL assembly and lipid homeostasis. Cell. Metab. 16, 473–486 [DOI] [PMC free article] [PubMed] [Google Scholar]
- 32. Yu X. X., Murray S. F., Watts L., Booten S. L., Tokorcheck J., Monia B. P., Bhanot S. (2008) Reduction of JNK1 expression with antisense oligonucleotide improves adiposity in obese mice. Am. J. Physiol. Endocrinol. Metab. 295, E436–445 [DOI] [PubMed] [Google Scholar]
- 33. Whillier S., Garcia B., Chapman B. E., Kuchel P. W., Raftos J. E. (2011) Glutamine and α-ketoglutarate as glutamate sources for glutathione synthesis in human erythrocytes. FEBS J. 278, 3152–3163 [DOI] [PubMed] [Google Scholar]
- 34. Cheng S., Rhee E. P., Larson M. G., Lewis G. D., McCabe E. L., Shen D., Palma M. J., Roberts L. D., Dejam A., Souza A. L., Deik A. A., Magnusson M., Fox C. S., O'Donnell C. J., Vasan R. S., Melander O., Clish C. B., Gerszten R. E., Wang T. J. (2012) Metabolite profiling identifies pathways associated with metabolic risk in humans. Circulation 125, 2222–2231 [DOI] [PMC free article] [PubMed] [Google Scholar]
- 35. Sookoian S., Pirola C. J. (2012) Alanine and aspartate aminotransferase and glutamine-cycling pathway: their roles in pathogenesis of metabolic syndrome. World J. Gastroenterol. 18, 3775–3781 [DOI] [PMC free article] [PubMed] [Google Scholar]
- 36. Leibowitz A., Boyko M., Shapira Y., Zlotnik A. (2012) Blood glutamate scavenging. Insight into neuroprotection. Int. J. Mol. Sci. 13, 10041–10066 [DOI] [PMC free article] [PubMed] [Google Scholar]
- 37. Pajor A. M. (1999) Sodium-coupled transporters for Krebs cycle intermediates. Annu. Rev. Physiol. 61, 663–682 [DOI] [PubMed] [Google Scholar]