

Abstract
Humans, like other mobile organisms, rely on spatial representations to guide navigation from place to place. Although previous work has identified neural systems involved in wayfinding, the specific spatial codes supported by these systems are not well understood. We use functional magnetic resonance imaging to identify regions within the human medial temporal and medial parietal lobes that encode two fundamental spatial quantities—location and facing direction—in a manner that abstracts away from sensory inputs. University students were scanned while viewing photographs taken at several familiar campus locations. Multivoxel pattern analyses indicated that the left presubiculum, retrosplenial complex, and parietal-occipital sulcus coded location identity even across non-overlapping views, whereas the right presubiculum coded facing direction even across noncontiguous locations. The location and direction codes supported by these regions may be critical to our ability to navigate within the extended environment and to understand its large-scale spatial structure.
Introduction
Spatial navigation—getting from point A to point B in large-scale space—is a challenge that must be addressed by all mobile organisms. To solve this problem, many animals, including humans, rely on representations of the large-scale spatial structure of the world, mentally dividing their environment into different locations (or “places”) and remembering directional relationships between them. To use this knowledge, a navigator must be able to represent its current location and facing direction, and imagine other locations and facing directions. Here we investigate the neuroanatomical substrates of these location and direction codes.
Previous neurophysiological work, primarily in rodents, has implicated medial temporal lobe and Papez circuit structures in the coding of location and direction, revealing cell types that represent location (“place cells”; O'Keefe and Dostrovsky, 1971), facing direction [“head direction (HD) cells”; Taube et al., 1990], and distances between points in space (“grid cells”; Hafting et al., 2005). The human neuroimaging (Epstein, 2008) and neuropsychological (Aguirre and D'Esposito, 1999) literatures, on the other hand, tend to implicate retrosplenial and medial parietal cortices [a region we label the “retrosplenial complex” (RSC)] in addition to the medial temporal lobe. Both RSC and medial temporal lobe regions (hippocampus and parahippocampal cortex) activate during virtual navigation (Aguirre et al., 1996; Maguire et al., 1998) (Fig. 1), and RSC is especially strongly engaged during retrieval of long-term spatial knowledge about familiar environments (Wolbers and Büchel, 2005; Epstein et al., 2007). Furthermore, damage to RSC leads to a profound inability to understand the spatial relationships between locations (Takahashi et al., 1997), a deficit that is not observed after damage to the hippocampus (Teng and Squire, 1999; Rosenbaum et al., 2000) or parahippocampal cortex (Habib and Sirigu, 1987). Thus, the neuropsychological and neuroimaging data (Maguire, 2001), together with studies of anatomical and functional connectivity (Kravitz et al., 2011b), support a model of human spatial navigation in which both medial temporal regions and RSC play central roles (Byrne et al., 2007; Vann et al., 2009). However, information about the specific spatial codes supported by these regions in humans has been sparse (although see Baumann and Mattingley, 2010).
Figure 1.

Meta-analysis of brain regions activated during studies of navigation. Neurosynth (www.neurosynth.org; Yarkoni et al., 2011) was used to perform an automated meta-analysis of 24 fMRI studies of navigation, revealing common activation across these studies in precuneus, retrosplenial cortex, parahippocampal cortex, and hippocampus. Map is thresholded with a false discovery rate of 0.05.
Here we address this lacuna by using multivoxel pattern analysis (MVPA) of functional magnetic resonance imaging (fMRI) data to identify the regions that encode location and facing direction in the human brain. We scanned University of Pennsylvania students while they viewed photographs taken facing different directions at several different locations around the University of Pennsylvania campus. We then attempted to decode location and facing direction based on multivoxel codes elicited while viewing these photographs. To anticipate, our results show that distributed activity patterns in RSC and the left presubicular region within the medial temporal lobe contain information about location, whereas activity patterns in the right presubicular region contain information about facing direction; furthermore, they represent this information in a way that abstracts away from sensory features and thus is purely spatial.
Materials and Methods
Subjects.
Fourteen healthy subjects (9 female; mean age, 22 ± 0.5 years) with normal or corrected-to-normal vision were recruited from the University of Pennsylvania community and scanned with fMRI. An additional two subjects were scanned, but their data were not analyzed because of excessive head motion (N = 1) or falling asleep during the experiment (N = 1). All subjects were either current upper-class undergraduate students or recent graduates, and all had extensive knowledge of the campus (campus experience, 2.9 ± 0.2 years). Before scanning, we confirmed their knowledge of the campus by asking them to indicate the location (e.g., 34th and Walnut Street) and facing direction (e.g., North) of photographs depicting eight campus intersections not used in the main experiment. Subjects provided written informed consent in compliance with procedures approved by the University of Pennsylvania Institutional Review Board.
MRI acquisition.
Scanning was performed at the Hospital of the University of Pennsylvania using a 3T Siemens Trio scanner equipped with a 32-channel head coil. High-resolution T1-weighted anatomical images were acquired using a three-dimensional magnetization-prepared rapid acquisition gradient echo pulse sequence [repetition time (TR), 1620 ms; echo time (TE), 3 ms; inversion time, 950 ms; voxel size, 0.9766 × 0.9766 × 1 mm; matrix size, 192 × 256 × 160]. T2*-weighted images sensitive to blood oxygenation level-dependent contrasts were acquired using a gradient echo echoplanar pulse sequence (TR, 4000 ms; TE, 30 ms; voxel size, 3 × 3 × 2 mm; matrix size, 64 × 64 × 65).
Stimuli and procedure.
Stimuli consisted of digitized color photographs taken facing the four compass directions (North, East, South, West) at eight intersections on the University of Pennsylvania campus (Fig. 2). For each of these 32 views (8 locations × 4 directions), 17 different photographs were acquired, making a total of 544 images in all. The stimulus set was split in half such that subjects saw all 272 images corresponding to 4 of the intersections (Fig. 2, intersections 1, 3, 6, and 8) twice over the course of four runs lasting 10 min 52 s each and then saw all 272 images corresponding to the four remaining intersections (Fig. 2, intersections 2, 4, 5, and 7) twice during four more runs of equal length.
Figure 2.
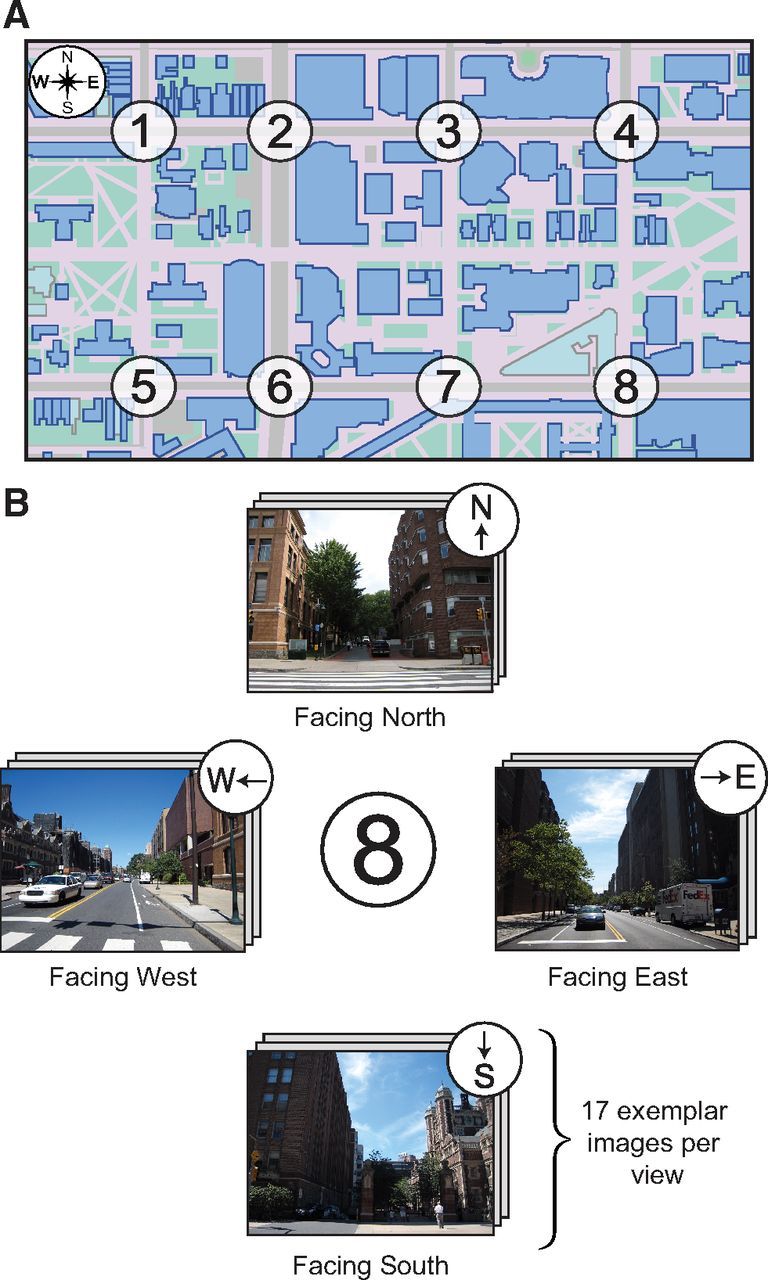
Map and example stimuli used in the experiment. A, Map of the eight locations (i.e., intersections) on the University of Pennsylvania campus. B, For each intersection, 17 photographs were taken facing each of the cardinal directions (i.e., North, East, South, West).
Each scan run of the main experiment was divided into 137 or 139 stimulus trials interspersed with 7 or 8 null trials. On each stimulus trial, subjects viewed a single image from the stimulus set at 1024 × 768 pixel resolution for 3 s followed by a 1 s interstimulus interval. Their task was to determine the direction that the camera was facing when the image was taken (North, East, South, or West). Because subjects typically find it impossible to identify facing direction without first identifying the location of the image, performance of this task ensures that neural systems representing both location and facing direction are activated. Subjects responded either by pressing the button on a four-button response box corresponding to that direction or by covertly identifying the direction and making a button press (i.e., the same button for all directions). Null trials consisted of 8 s of a gray screen with black fixation cross during which subjects made no response.
Trials were ordered according to a continuous carryover sequence—a serially balanced design in which each view follows every other view including itself exactly once (Aguirre, 2007). Subjects viewed two full carryover sequences for each set of intersections, with each sequence spanning 2 scan runs. A unique carryover sequence was generated for each subject for each set of intersections. Subjects switched response instructions after every carryover sequence (i.e., every two scan runs) so that facing direction was not confounded by motor response in the multivoxel pattern analyses.
In addition to the main experiment, subjects also completed a functional localizer scan lasting 9 min 52 s, which consisted of 16 s blocks of scenes, objects, and scrambled objects. Images were presented for 490 ms with a 490 ms interstimulus interval as subjects performed a one-back task on image repetition.
Data preprocessing.
Functional images were corrected for differences in slice timing by resampling slices in time to match the first slice of each volume. Images were then realigned to the first volume of the scan run and spatially normalized to the Montreal Neurological Institute template. Data for the functional localizer scan were smoothed with a 6 mm full-width at half-maximum Gaussian filter; data for multivoxel pattern analyses were not smoothed.
Functional regions of interest.
Data from the functional localizer scan were used to identify two scene-responsive regions, the parahippocampal place area (PPA) and RSC, which have been previously implicated in place recognition and navigation. These regions were defined as the set of contiguous voxels in the vicinity of the parahippocampal/lingual boundary (i.e., PPA) or retrosplenial cortex/parietal-occipital sulcus (POS; i.e., RSC) that responded more strongly to scenes than to objects. Thresholds were determined separately for each subject to be consistent with ROIs found in previous studies and ranged from t > 1.5 to t > 3.5 (mean t = 2.7 ± 0.2). Data from one subject's functional localizer scan could not be used, so for this subject we used the across-subject ROI intersection that most closely matched the average size of each ROI in the remaining 13 subjects. We identified bilateral PPA in all 13 of the remaining subjects, left RSC in 11 of 13 subjects, and right RSC in 12 of 13 subjects.
Anatomical regions of interest.
Because neurons sensitive to spatial quantities have been identified throughout the medial temporal lobe, we created six anatomical ROIs that covered this region: anterior hippocampus, posterior hippocampus, presubiculum (a structure on the medial parahippocampal gyrus situated between the subiculum and entorhinal cortex), entorhinal cortex, perirhinal cortex, and parahippocampal cortex (see Fig. 4a). The hippocampus and presubiculum were defined using the fully automated segmentation protocol in FreeSurfer 5.1 (Van Leemput et al., 2009). This technique uses Bayesian inference on an upsampled version of the T1 structural image to determine the likely hippocampal subfield identity of 0.5 × 0.5 × 0.5 mm voxels. We first assigned a subfield identity to each “mini-voxel” by selecting the subfield with the highest probability. We then assigned the identity of each 3 × 3 × 2 mm functional voxel according to the most commonly occurring subfield across the 144 mini-voxels. The hippocampus ROI was defined as the union of the CA1, CA2/3, CA4/dentate gyrus, and subiculum. We then divided the hippocampus into anterior and posterior subregions at y = −26. Entorhinal, perirhinal, and parahippocampal cortices were defined based on manual parcellation of the T1 anatomical image following the protocol in Pruessner et al. (2002), with the additional constraint that the parahippocampal cortex ROI did not contain any PPA voxels.
Figure 4.

Coding of spatial quantities in multivoxel patterns in the medial temporal lobe. A, Six anatomical regions were defined in the medial temporal lobes of each subject as described in Materials and Methods. The six regions from one subject are displayed on two coronal slices. B, Multivoxel patterns in presubiculum distinguished between directions and between locations. No other region showed coding of spatial quantities. C, Data for presubiculum, shown separately for each hemisphere, which suggests a difference in spatial coding across hemispheres. Left presubiculum distinguished between locations, whereas right presubiculum distinguished between directions. Presub, Presubiculum; Hipp, hippocampus; Parahipp, parahippocampal. **p < 0.01; *p < 0.05. Error bars indicate mean ± SEM.
Multivoxel pattern analysis.
To determine whether each ROI contained information about location, facing direction, or the identity of the specific view, we calculated correlations between multivoxel patterns elicited in different carryover sequences (Haxby et al., 2001). Data from the first half of the experiment (in which four of the eight intersections were shown in two carryover sequences) were analyzed separately from data from the second half of the experiment, and the results were averaged together. Below we describe the analysis procedure for each half.
The first step of the analysis was to obtain the multivoxel activity patterns reflecting the response to each view for each carryover sequence. To create these, we first passed the time course of MR activity for each voxel through a general linear model (GLM) containing 32 regressors (16 views × 2 carryover sequences). The resulting β values corresponded to an estimate of the average response to each view within each carryover sequence. Multivoxel activity patterns were then constructed by simply concatenating these response values across voxels. GLMs were implemented in VoxBo (www.voxbo.org) and included an empirically derived 1/f noise model, filters that removed high and low temporal frequencies, and nuisance regressors to account for global signal variations and differences in mean signal between scan runs.
The second step of the analysis was to assess similarity between activity patterns by calculating correlations between patterns in different carryover sequences (Fig. 3). First, we normalized the patterns by calculating the mean pattern across all views separately for each carryover sequence and subtracting this mean pattern from each of the individual patterns. Next, we created a 16 × 16 correlation matrix by calculating the cross-sequence Pearson correlations between patterns for all pairs of views, including both same-view pairs (e.g., View 1 in Sequence 1 vs View 1 in Sequence 2) and different-view pairs (e.g., View 1 in Sequence 1 vs View 2 in Sequence 2). Each cell of the correlation matrix belonged to one of four possible groups based on shared spatial quantities, as follows: (1) same location same direction (SLSD; i.e., same view); (2) same location different direction (SLDD; e.g., Location 1 facing North vs Location 1 facing East); (3) different location same direction (DLSD; e.g., Location 1 facing North vs Location 2 facing North); and (4) different location different direction (DLDD; e.g., Location 1 facing North vs Location 2 facing West).
Figure 3.

Coding of spatial quantities in multivoxel patterns in PPA and RSC. A, Multivoxel pattern correlations between each pair of views were sorted into four groups based on shared spatial information between the views. Here we show example pairings for each group. B, Condition matrix showing all pairings between views, with assignment to groups. Numbered circles refer to campus locations in Figure 2; locations to the left of the slash were shown in the first half of the experiment and locations to the right of the slash were shown in the second half of the experiment. Categorical regressors for direction, location, and view were created by contrasting these conditions as shown. Each regressor was used in a separate multiple regression analysis (see Materials and Methods). C, When conditions were compared directly without controlling for visual similarity, multivoxel patterns in PPA distinguished between locations and also distinguished between views, and multivoxel patterns in RSC distinguished among directions, locations, and views. Bars represent the difference in pattern similarity between the conditions that constitute each categorical regressor, as measured by the β weight on that regressor in the multiple regression; error bars indicate mean ± SEM. D, When visual similarity was controlled using a parametric regressor, multivoxel patterns in PPA distinguished between views, but not locations or directions, whereas multivoxel patterns in RSC distinguished between both views and locations. ***p < 0.001; **p < 0.01; *p < 0.05; †p < 0.10.
The third step of the analysis was to evaluate whether the correlation values determined in step 2 reflected coding of view, location, or direction. To assess this, we performed six separate multiple regressions on these correlation values. Three of these models examined view, location, and direction coding before controlling for visual similarity; the remaining three examined view, location, and direction coding after controlling for visual similarity. The independent variables in the first set of models (before controlling for visual similarity) were a binary categorical regressor for the contrast of interest and a constant term; the models that controlled for visual similarity contained the same regressors plus a parametric regressor for visual similarity (see below for details). To test for coding of view, we used a categorical regressor that contrasted between SLSD and the average of SLDD, DLSD, and DLDD—that is, same view versus all of the different-view groups. To test for coding of location independent of view, we used a categorical regressor that contrasted SLDD with DLDD—that is, same versus different location under the constraint that direction (and hence view) is always different. To test for coding of direction independent of view, we used a categorical regressor that contrasted DLSD with DLDD—that is, same versus different direction under the constraint that location (and hence view) is always different. These analyses were performed on the full dataset for 11 of the 14 subjects; for the remaining 3 subjects, they were performed on a partial dataset consisting of only one half of the experiment, because these subjects either did not complete both halves of the experiment (N = 1) or fell asleep during scan runs from one half of the experiment (N = 2). All independent variables were standardized before running the model by subtracting the mean of the regressor and then dividing by the SD of the regressor.
To create a parametric regressor for visual similarity, we calculated the visual similarity between all pairs of images using a simple texture model that has previously been shown to approximate human performance on scene identification at very brief (<70 ms) exposures (Renninger and Malik, 2004). Images were first converted to grayscale and then passed through V1-like Gabor filters of varying orientations and sizes to identify the 100 most common texture features across images (Matlab code available at www.renningerlab.org). For each image, we generated a histogram reflecting the frequency of each of the 100 texture features. For every pair of images, we computed visual dissimilarity by comparing the distributions of texture features using a χ2 measure (smaller χ2 corresponds to less visual dissimilarity). Then, to calculate visual dissimilarity between a pair of views, we averaged over all the relevant pairwise combinations of images. Finally, we converted the visual dissimilarity values to visual similarity by subtracting each χ2 from the maximum χ2.
Searchlight analysis.
To test for coding of spatial quantities outside of our ROIs, we implemented a searchlight procedure (Kriegeskorte et al., 2006), which performs the same calculations described above, but in small spherical ROIs (radius 5 mm) centered on each voxel of the brain in turn. Thus, we determined the average correlation between each pair of views in the local neighborhood of each voxel, performed the multiple regressions as described above, and assigned the β weight for the regressor of interest to the center voxel of the spherical ROI. This procedure generated six whole-brain maps for each subject corresponding to coding for view, location, and direction in each half of the experiment. For each type of spatial coding, we averaged together the maps from each half of the experiment and then submitted this average map to a second-level random-effects analysis to identify voxels that reliably exhibit spatial coding across subjects. To find the true type I error rate for each type of spatial coding, we performed Monte Carlo simulations, which involved sign permutations of the whole-brain data from individual subjects (Nichols and Holmes, 2002). We then report voxels that are significant at p < 0.05 after correcting for multiple comparisons across the entire brain.
Tuning for facing direction.
To further explore direction coding revealed by the main MVPA analyses described above, we calculated tuning curves for each direction to test whether all directions are equally well represented. This involved a modification to steps 2 and 3 of the analysis procedure described above. After computing the 16 × 16 matrix for similarity between views, we grouped these correlation values according to their direction–direction pairing (e.g., East-East, East-North). Because we wanted to examine direction coding independent of location or view, we excluded same-location pairings (i.e., SLSD and SLDD) from these groupings. We then performed a multiple regression on the correlation values to obtain estimates of the average correlation for each of the 10 direction-direction groupings while taking visual similarity into account. These data were then further analyzed by comparing the within-direction (DLSD) β weight for each direction (North, South, East, West) to the between-direction β values (DLDD) for that direction (e.g., East-East vs East-North, East-South, and East-West). Finally, we performed a 4 × 2 repeated-measures ANOVA on direction (North, East, South, West) and pattern similarity type (within direction, between directions).
Tuning for location.
To further explore location coding revealed by the main MVPA analyses described above, we looked for evidence of graded coding of location by testing whether pattern similarity varied based on the real-world Euclidean distance between intersections. In contrast to the previous analyses, where we analyzed correlations separately for each set of four intersections and then averaged the results together, here we examined correlations between all eight intersections to maximize the variability in between-location distances. We therefore excluded from this analysis three subjects for whom we did not have data from both halves of the experiment. For the remaining 11 subjects, we calculated the across-carryover sequence correlations between all pairs of DLSD and DLDD views and then grouped together all view pairs from the same pair of locations. For example, the location pair “Location 1-Location 2” would include view pairs such as “Location 1 East-Location 2 North” and “Location 1 South-Location 2 West.” We then defined the neural distance between two locations as the average pattern dissimilarity (i.e., 1 − r) across all view pairs from that location pair. We then fit these neural distance values to a multiple regression model that included regressors for visual similarity, the real-world Euclidean distance between locations, and a constant term. We extracted the β weights for the Euclidean distance regressor for each subject and compared them to zero using a two-tailed t test.
fMRI adaptation.
To test for a reduction in response after repetitions of view, location, or direction, we combined the data from all eight intersections and created a model in which each trial is defined based on shared spatial quantities with the previous trial. Thus, there were regressors for Repeat View, Repeat Location (but change direction), Repeat Direction (but change location), and Nonrepeat trials (i.e., change direction and change location). The model also included a regressor for trials that followed null trials, a regressor that modeled low-level visual similarity, and nuisance regressors as described above. We extracted β values for each regressor and performed three planned two-tailed t tests. To test for effects of view repetition, we compared Repeat View to the average of Repeat Location, Repeat Direction, and Nonrepeat, since those three regressors all reflect activity during trials for which the view is different from the previous trial. To test for effects of location repetition, we compared Repeat Location to Nonrepeat. Finally, to test for effects of direction repetition, we compared Repeat Direction to Nonrepeat.
Results
Behavioral performance
On each trial, subjects reported the facing direction (North, South, East, West) for an image of the University of Pennsylvania campus. This task requires subjects to retrieve spatial information about the depicted location that goes beyond simple perceptual analysis of the image. Subjects performed this task rapidly and accurately [average reaction time (RT) for all trials, 1331 ± 62 ms; average accuracy for the 50% of trials in which subjects explicitly reported direction, 88.1 ± 2.5%], which was expected given the grid-like structure of the University of Pennsylvania campus (Fig. 2) and the fact that we prescreened subjects to ensure they could perform the task using eight different campus intersections not shown in the main experiment.
Using these behavioral responses, we looked for evidence of behavioral priming by sorting the trials into four trial types based on whether the image shown on the trial depicted the same or different spatial information as the image shown on the immediately preceding trial. On Repeated View trials, both location and direction were maintained across the successive trials (e.g., Intersection 1 Facing East → Intersection 1 Facing East). On Repeated Location trials, location was maintained, but direction differed (e.g., Intersection 1 Facing East → Intersection 1 Facing North). On Repeated Direction trials, direction was maintained, while location differed (e.g., Intersection 1 Facing East → Intersection 2 Facing East). Finally, on Nonrepeat trials, both location and direction changed (e.g., Intersection 1 Facing East → Intersection 2 Facing South). We then compared the average reaction times across the four trial types to look for evidence of priming for view, direction, or location. Note that the images shown on successive trials were never exactly identical, even on repeated view trials, as each individual image was shown only twice during the experiment and never more than once within the same scan run.
This analysis revealed behavioral priming effects for repetition of the same view [Repeated View RT, 1218 ± 56 ms vs Change View RT (average of Repeated Location, Repeated Direction, and Nonrepeat RTs), 1368 ± 64 ms; t(13) = −7.37, p = 0.000005] and repetition of the same location (Repeated Location RT, 1346 ± 66 ms vs Nonrepeat RT, 1377 ± 66 ms; t(13) = −3.2, p = 0.007), but no priming for repetition of the same direction (Repeated Direction RT, 1383 ± 61 ms vs Nonrepeat RT, 1377 ± 66 ms; t(13) = 0.6, p = 0.54). Thus, subjects exhibited priming when either view or location was repeated on successive trials, even though they were performing a direction task. The presence of a location priming effect and the absence of a direction priming effect is not surprising given that subjects typically find it impossible to identify facing direction without first identifying location. Thus, when location is repeated across trials, subjects exhibit a benefit because they accessed the same location on the previous trial. However, when direction is repeated, it provides no benefit since direction cannot be directly ascertained from the image.
Multivoxel decoding of view, location, and facing direction
We then turned to the main question of the study: how is information about views, locations, and facing directions encoded in different brain regions? To assess this, we measured similarity between multivoxel activity patterns evoked by different stimuli. We hypothesized that if a region contains information about a particular spatial quantity, such as location, the evoked activity patterns for two stimuli that share that quantity (e.g., same location) should be more similar than the evoked activity patterns for two stimuli that do not share that quantity (e.g., different locations). Because previous work suggested that the PPA and RSC might be especially involved in coding spatial quantities, we first focused on these regions before examining medial temporal lobe regions, and finally considering patterns in all regions of the brain.
We first performed three multiple regressions on the pattern similarity data to test for coding of views, locations, and directions, respectively (Fig. 3). Patterns in PPA distinguished between views (t(13) = 5.8, p < 0.0001) and locations (t(13) = 2.3, p = 0.04), but distinctions between directions (t(13) = 2.0, p = 0.07) fell short of significance. That is, patterns elicited by the same view in different scan runs were more similar than patterns elicited by different views, and patterns elicited by different views at the same location were more similar than patterns elicited by different locations. Patterns in RSC not only distinguished between specific views (t(12) = 5.7, p < 0.0001) and locations (t(12) = 4.3, p = 0.001), but also distinguished between facing directions (t(12) = 2.8, p = 0.015).
Because the multivoxel patterns compared in the same view condition reflect the response to the same set of images, view coding could not be fully disentangled from image coding or visual feature coding in this experiment. In contrast, the analyses for location and direction coding were designed to minimize the effects of visual similarity since the pairs of views in the same location (SLDD) and same direction (DLSD) conditions did not contain overlapping visual information. However, this design may not have fully controlled for effects of visual similarity because there might be low-level visual features in common across same-location and same-direction images that could give rise to the increased pattern similarity. To account for this possibility, we performed three additional multiple regressions for view, location, and direction, each of which included a covariate for low-level visual similarity (see Materials and Methods for more details on the visual similarity measure). After controlling for visual similarity, activity patterns in PPA distinguished between views (t(13) = 5.1, p = 0.0002), but did not distinguish between locations (t(13) = 1.5, p = 0.15) or directions (t(13) = 0.4, p = 0.71; Fig. 3). Activity patterns in RSC distinguished between views (t(12) = 3.8, p = 0.003) and locations (t(12) = 3.3, p = 0.006), but the distinction between directions was reduced to a marginal trend (t(12) = 1.9, p = 0.09). Thus, once visual similarity is controlled for, PPA no longer exhibits coding for spatial quantities, and the evidence for coding of direction in RSC becomes less clear. Because visual similarity affected our estimates of pattern similarity in PPA and RSC, we included visual similarity as a covariate in all subsequent analyses of pattern similarity.
We then looked for evidence of spatial coding in medial temporal lobe regions. Rodent extracellular recordings strongly implicate these regions in coding for location (hippocampus; O'Keefe and Dostrovsky, 1971) and head direction (presubiculum; Taube et al., 1990). However, the extent to which these regions are involved in spatial coding in humans is unclear. The hippocampus is activated in some neuroimaging studies of navigation (Ghaem et al., 1997; Maguire et al., 1998), but not in others (Aguirre et al., 1996; Aguirre and D'Esposito, 1997; Rosenbaum et al., 2004). Furthermore, although putative place cells have been identified in this region (Ekstrom et al., 2003), humans with hippocampal damage retain the ability to navigate through familiar environments (Teng and Squire, 1999). As for human presubiculum, there is currently no evidence implicating this region in coding of spatial quantities, though HD cells have been identified there in nonhuman primates (Robertson et al., 1999). Because the contributions of these and nearby medial temporal regions to human spatial coding are yet unresolved, we specifically targeted them in the following analyses.
Anterior and posterior hippocampus (including the CA fields, dentate gyrus, and subiculum), and extrahippocampal regions (presubiculum, entorhinal cortex, perirhinal cortex, and parahippocampal cortex exclusive of PPA) were defined anatomically as described in Materials and Methods (Fig. 4). We then performed the same tests for view, location, and direction coding described above and submitted the results of each test to one-way repeated-measures ANOVAs with Region as a factor. These analyses revealed that coding for location and direction did indeed differ between ROIs, as evidenced by significant effects of Region (Location: F(5,65) = 4.3, p = 0.002; Direction: F(5,65) = 4.7, p = 0.001); coding for view did not differ between regions (F(5,65) = 0.5, p = 0.78). When we explicitly tested the location, direction, and view effects within each region, we found that presubiculum coded for direction (t(13) = 3.0, p = 0.01) and location (t(13) = 3.3, p = 0.006). No other regions coded for direction or location; nor did any region distinguish between different views (Fig. 4).
These results are consistent with animal neurophysiology literature indicating that presubiculum contains a mixture of cells that convey information about direction and location, including HD cells (Boccara et al., 2010), grid cells (Boccara et al., 2010), and theta-modulated place-by-direction cells (Cacucci et al., 2004). Inspection of the data suggested that presubiculum coding for these two types of information differed across hemispheres. To further characterize these hemispheric effects, we performed a 2 × 2 repeated-measures ANOVA with Hemisphere and Information Type (location and direction) as factors. There were no significant main effects, but there was a significant interaction between Hemisphere and Information Type (F(1,13) = 7.5, p = 0.02), indicating that the degree to which presubiculum coded for location and direction differed by hemisphere. Specifically, left presubiculum distinguished between locations (t test vs 0, t(13) = 3.3, p = 0.005) but not directions (t(13) = 1.7, p = 0.11), whereas right presubiculum distinguished between directions (t(13) = 3.4, p = 0.005) but not locations (t < 1, n.s.; Fig. 4). Furthermore, direction coding was stronger than location coding in right presubiculum (t(13) = 2.3, p = 0.04), although the reverse was not true for left presubiculum (t(13) = 1.7, p = 0.11).
Whole-brain searchlight analyses
Having identified multivoxel activity patterns corresponding to coding of view, location, and direction in our preselected ROIs, we then performed a searchlight analysis (Kriegeskorte et al., 2006) to determine whether these quantities could be decoded elsewhere in the brain. The resulting significance maps confirmed the effects found in the ROI analysis and identified additional areas that show sensitivity to these quantities (Fig. 5).
Figure 5.
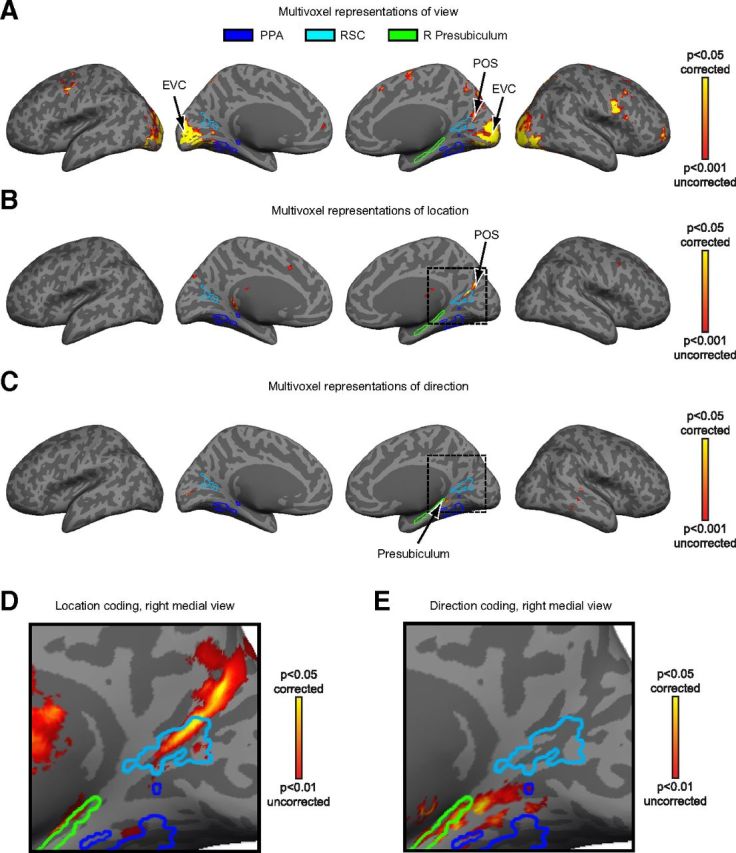
Whole-brain searchlight analyses of multivoxel coding of view, location, and direction information. A, Views of campus were distinguishable in early visual cortex (EVC) and POS. Results are plotted on the inflated surface of one participant's brain, where dark gray represents sulci and light gray represents gyri. Voxels in yellow are significant (p < 0.05) after correcting for multiple comparisons via Monte Carlo simulation. Outlines for PPA and RSC were created by calculating the across-subject ROI intersection that most closely matched the average size of each ROI. Outline of right presubiculum was created based on the anatomy of the participant's brain used for visualization. B, Locations were distinguishable in RSC and POS. C, Directions were distinguishable in right presubiculum. D, Enlarged view of location coding within the portion of the right medial surface indicated by the dotted lines in B. Data are presented at a lower threshold than in B to show the extent of location coding. Note that location coding is evident in RSC at this threshold. E, Enlarged view of direction coding within the portion of the right medial surface indicated by the dotted lines in C, showing that direction information was primarily present in the anterior calcarine sulcus, and posterior presubiculum. Same threshold as in D.
Location could be decoded from multivoxel patterns within a swath of cortex along the POS that overlapped with posterior RSC and continued posteriorly and superiorly into the precuneus. In contrast, direction was decodable in more anterior regions that included the anterior calcarine sulcus and a region partially overlapping with the posterior presubiculum. Finally, individual views could be decoded from multivoxel patterns throughout visual cortex, including early visual cortex and territory in the object-selective lateral occipital complex. The fact that views could be decoded in early visual regions suggests that there are similarities between same-view images that are not captured by our visual similarity model, which focuses on texture similarities without consideration of color or the spatial distribution of features within the image.
Tuning for facing direction
To further investigate the nature of direction coding in right presubiculum, we constructed directional tuning curves for this region (Fig. 6). This involved plotting the correlations for each direction pairing separately, rather than averaging over all same-direction and all different-direction view pairings as we did previously. As in the earlier analyses, we considered correlations between views from different locations to ensure that similarities in direction were not confounded by similarities in view or location, and we included a regressor to control for low-level visual similarity.
Figure 6.

Direction tuning curves for right presubiculum. β weights, reflecting the average correlation between multivoxel patterns elicited by views in one scan run and patterns elicited by views in the complementary scan run, are plotted as a function of the facing directions of the views. For example, for a given North view, the average correlation was calculated between the pattern for that view and the pattern for all other views facing to the North, East, South, and West (excluding pairs of views obtained at the same intersection); these values were then grouped by direction to give average correlation values for North-North, North-East, North-South, and North-West. Note that there are peaks at North-North, East-East, and South-South, indicating that right presubiculum distinguishes the same versus different direction for North, East and South. Error bars indicate mean ± SEM.
To test whether right presubiculum exhibited directional tuning for all directions or just a subset of directions, we performed a 4 (North, East, South, West) × 2 (within-direction, between-directions) repeated-measures ANOVA comparing pattern similarity within a direction (e.g., East-East) to pattern similarity between directions (e.g., East-North, East-South, East-West), separately for each direction. Pattern similarities showed a main effect of Within-Direction vs Between-Directions (F(1,13) = 10.6, p = 0.006), confirming that this region distinguishes between directions. There was no interaction effect (F(3,39) = 0.6, p = 0.61), suggesting that right presubiculum does not show preferential tuning for a subset of the four directions. Thus, the directional tuning observed here is similar to that observed in rodent HD cells insofar as all directions are equally well represented.
Tuning for location
The location coding results reported above indicate that the multivoxel activity patterns in RSC, left presubiculum, and POS are capable of distinguishing between different campus locations. Yet this analysis does not reveal whether these locations are represented in a map-like (i.e., metric) fashion, whereby locations that are closer together in the real world are representationally more similar than locations that are farther apart. We have previously shown using fMRI adaptation that the bulk activity in left anterior hippocampus is parametrically modulated by the real-world distance between places (Morgan et al., 2011), but this type of coding has not yet been demonstrated using multivoxel patterns. To test this possibility, we regressed the “neural distance” between activity patterns against the real-world Euclidean distance between the corresponding locations. Neural distance was defined as the average pattern dissimilarity (i.e., 1 − r) between all pairs of views belonging to a pair of locations. As in the previous analyses, this model also included a regressor for the low-level visual similarity between locations. We performed this analysis in regions that demonstrated a location effect in the earlier analyses, but found no evidence for this type of coding in RSC (mean β = 0.05, p = 0.10), left presubiculum (mean β = −0.004, p = 0.79), or the region along the POS identified in the location searchlight analysis (mean β = 0.04, p = 0.16). These results suggest that although distributed patterns in these regions can distinguish between real-world locations, they might not contain information about the underlying metric structure of the environment. When we repeated this analysis across the entire brain using a searchlight method, we did not find any voxels that demonstrated a relationship between pattern similarity and Euclidean distance between locations. Nor did we find any effects in PPA or the remaining medial temporal lobe ROIs (all p values > 0.32).
fMRI adaptation
A second technique used to infer representational distinctions within a region is fMRI adaptation—a reduction in response when stimulus features are repeated (Grill-Spector et al., 2006). Previous studies that have assessed neural representations using both MVPA and fMRI adaptation have reported inconsistencies in the results obtained by these two techniques (Drucker and Aguirre, 2009; Epstein and Morgan, 2012). These discrepancies do not appear to reflect a difference in sensitivity between MVPA and fMRI adaptation (but see Sapountzis et al., 2010), but rather suggest a difference in the precise features of the neuronal code interrogated by these two techniques (Drucker and Aguirre, 2009; Epstein and Morgan, 2012). As such, fMRI adaptation analyses have the potential to provide complementary results to those obtained by MVPA.
Because we used a continuous carryover sequence in which each view was presented after every other view including itself equally often, adaptation effects were independent of the main effects analyzed by MVPA in our experiment and could be independently assessed. We therefore examined the effects of repeating view, location, or direction across pairs of trials. As in the analysis of the behavioral data, we sorted trials into four trial types based on the shared spatial information with the immediately preceding trial: Repeated View, Repeated Location, Repeated Direction, or Nonrepeat. We then looked for a reduction in fMRI response in the current trial caused by repetition of spatial information from the previous trial.
We first looked for adaptation to view repetitions by comparing the mean fMRI signal of Repeated View trials to the mean fMRI signal of all different view trials (i.e., the average of Repeated Location, Repeated Direction, and Nonrepeat). In line with previous experiments, we found robust adaptation to repeated view in PPA and RSC (PPA: t(13) = −9.5, p < 0.0001; RSC: t(12) = −6.6, p < 0.0001). In addition, many of the medial temporal lobe ROIs, with the exception of entorhinal and perirhinal cortices, exhibited adaptation to repeated view (anterior hippocampus: t(13) = −2.5, p = 0.03; posterior hippocampus: t(13) = −4.5, p = 0.0006; presubiculum: t(13) = −4.9, p = 0.0003; parahippocampal cortex: t(13) = −5.1, p = 0.0002). We next looked for adaptation to repetitions of location (under the constraint that direction always differed) by comparing the repeated location trials to the baseline Nonrepeat trials. Although the response to Repeated Location was numerically smaller than the response to Nonrepeat trials in RSC, there were no significant effects of repeating location in this or any other ROI (all p values > 0.11).
Finally, we looked for adaptation to repetitions of direction (under the constraint that location always differed) by comparing the Repeated Direction trials to the baseline Nonrepeat trials. Here, we find an unexpected effect of antiadaptation (i.e., a greater response when direction was repeated) in RSC (t(12) = 2.9, p = 0.01) and parahippocampal cortex (t(13) = 2.2, p = 0.048), and a trend for antiadaptation in PPA (t(13) = 1.8, p = 0.09). We observed no effects of repeating facing direction in the remaining ROIs (all p values > 0.56). A recent fMRI adaptation experiment observed reduced response in a medial parietal region within RSC when facing direction was repeated across trials—the opposite effect to what we observe here (Baumann and Mattingley, 2010). An important difference between the two studies is that subjects in the previous experiment performed an orthogonal location task, whereas here subjects actively reported facing direction on every trial. Because our task led subjects to focus on direction, the repeated direction trials may have been particularly salient and engaged additional attention and hence increased rather than reduced response, a hypothesis supported by predictive coding models of antiadaptation (Segaert et al., 2013).
In sum, as observed in previous studies, fMRI adaptation results were partially consistent and partially inconsistent with those obtained by MVPA. Both methods found evidence for view coding in PPA and RSC, and some degree of evidence for direction coding in RSC. However, location coding in RSC and medial temporal lobe regions was only observed with MVPA, while view coding in medial temporal lobe ROIs was only observed with adaptation. These findings are broadly consistent with previous results indicating that fMRI adaptation effects tend to index representational distinctions that are more stimulus specific than those indexed by MVPA, either because the locus of the effect is closer to the single unit (Drucker and Aguirre, 2009), or even the synapse (Sawamura et al., 2006), or because it reflects the operation of dynamic recognition mechanisms that are more tied to individual items than to general categories (Summerfield et al., 2008; for additional discussion, see Epstein and Morgan, 2012).
Discussion
The principal finding of this study is that distributed patterns of fMRI activity in the medial temporal lobe and medial parietal cortex contain information about location and facing direction within a familiar, real-world environment. Specifically, patterns in RSC, POS, and left presubiculum contain information about location, while patterns in right presubiculum contain information about facing direction. These results demonstrate the coding of navigationally relevant spatial information in specific regions in the human brain.
Our first main finding is that locations are represented in both medial temporal (left presubiculum) and medial parietal regions (RSC and more posterior territory along the POS, i.e., precuneus). This was demonstrated by the finding of similarity between multivoxel patterns elicited by different views taken at the same intersection. This result cannot be explained by coding of visual features since we compared pairs of views with non-overlapping visual information and explicitly modeled low-level visual similarity between the views. Indeed, it would be virtually impossible for an observer to know which views corresponded to which locations without long-term knowledge about the spatial location of the views. Nor can the results be explained by coding of behavioral responses corresponding to the different locations because the task required subjects to report facing direction, not location. Rather, these findings demonstrate the existence of a purely abstract representation of location in medial temporal and medial parietal regions whereby different topographical features corresponding to the same location elicit a common neural response.
By showing a neural representation of location per se in RSC and POS, these findings go beyond previous multivoxel studies that have demonstrated decoding of scene categories (Walther et al., 2009), the geometric structure of scenes (Kravitz et al., 2011a; Park et al., 2011), and individual landmarks (Morgan et al., 2011; Epstein and Morgan, 2012) in several cortical regions, including the PPA and RSC. Furthermore, whereas previous neuroimaging work has implicated RSC in the retrieval of spatial quantities—for example by showing that fMRI activity in RSC increases when subjects retrieve long-term spatial knowledge (Epstein et al., 2007) or move through an environment for which they have obtained survey knowledge (Wolbers and Büchel, 2005)—those studies could not exclude the possibility that RSC mediates general mnemonic processes that facilitate encoding or retrieval. The current findings provide more convincing evidence for the proposition that RSC represents location, since multivoxel codes in RSC (and POS) reliably distinguished between locations, even though location was not reducible to differences in visual features. In contrast, multivoxel codes in the PPA distinguished between views but did not distinguish between locations when visual similarity was controlled. These findings are consistent with the view that PPA is a visual region that primarily represents the local scene, whereas RSC and other parietal regions support spatial representations that connect the local scene to the broader environment (Epstein et al., 2007; Park and Chun, 2009).
The finding of location coding in RSC/POS fits well with a previous report of location-sensitive neurons in monkey medial parietal cortex (Sato et al., 2006). In that study, monkeys navigated along different routes to goal locations in a virtual environment, and a subset of medial parietal neurons fired whenever the monkey occupied a particular virtual location, regardless of the route. Compared with place cells in the hippocampus, these place-related cells in the medial parietal lobe have been less studied, and less is known about the precise spatial quantities they might encode. One possibility is that location representations in medial parietal cortex might be more schematic, whereas location representations in hippocampus might be more metric. Consistent with this view, similarities between location patterns in RSC and POS did not relate to real-world Euclidean distances between locations. Although we did not detect location coding in the hippocampus in the current experiment, we have previously shown using an adaptation paradigm that the hippocampus has access to metric information about which locations are closer to each other and which are farther away (Morgan et al., 2011). Thus, RSC and POS might encode locations (and, possibly, directional vectors between locations) but might not organize locations according to their exact coordinates within a continuous spatial map (Gallistel, 1990). This could explain previous findings that hippocampal amnesic patients (whose RSC is intact) can navigate premorbidly familiar environments, but display deficits when the navigation task requires fine-grained spatial information (Teng and Squire, 1999; Maguire et al., 2006). In any case, the current observation of abstract coding of location in RSC and POS indicates that place representations are not restricted to the medial temporal lobe, but can also be found in medial parietal regions.
We also observed location coding in presubiculum, a finding that is consistent with results from rodent neurophysiology studies, which have identified cells that exhibit location coding in this region, including grid cells (Boccara et al., 2010) and theta-modulated place-by-direction cells (Cacucci et al., 2004). This result resembles a previously reported finding that multivoxel patterns in the hippocampus could distinguish between corners of a newly learned virtual room (Hassabis et al., 2009). Complementing this, here we show that fMRI patterns in left presubiculum (in addition to RSC/POS) distinguish between real-world locations within a much larger environment (350 × 270 m in the current study vs 15 × 15 m in the previous study) for which the subjects have years of experience. Differences in size and familiarity between the environments might partially explain why spatial codes were found in different regions in the two experiments: the hippocampus may be more important for coding location within small and/or newly learned environments, whereas presubiculum and RSC/POS may be more important for coding location within large and/or highly familiar environments (Smith et al., 2012). Alternatively, the apparent discrepancies between experiments might be attributable to differences in ROI definition and fMRI acquisition parameters: the previous study did not attempt to distinguish between coding in the presubiculum and coding in the hippocampus and did not acquire data from RSC; on the other hand, it used smaller voxels that might have made it more sensitive to hippocampal differences. Further experiments are needed to fully characterize the properties of the location codes in these regions and under what circumstances they arise.
The second main result of the current study is that allocentric facing directions are represented in the right presubiculum. This was demonstrated by the increased pattern similarity between views facing the same direction (e.g., North) across different intersections. Although this finding is somewhat confounded by the fact that our subjects were performing a direction task during the experiment, it cannot be simply explained in terms of response preparation or execution because we always compared neural activity across the two response modalities—subjects either indicated facing direction via button press or covertly identified the facing direction. These results fit well with the animal literature since HD cells have been found in the presubiculum of rats (Taube et al., 1990) and nonhuman primates (Robertson et al., 1999). Furthermore, the presubiculum is thought to be critical for updating the HD signal based on visual landmark information (Yoder et al., 2011), which was the only directional cue available in this experiment, given the absence of vestibular and self-motion information in the scanner.
Some of our MVPA data suggested that RSC might also code for allocentric facing direction; however, this result did not maintain significance when low-level visual similarity between directions was controlled. The human literature supports this role for RSC since patients with damage to retrosplenial cortex are described as having “lost their sense of direction” (Takahashi et al., 1997) and medial parietal cortex exhibits neural adaptation to repetitions of heading directions (Baumann and Mattingley, 2010). Indeed, we also find differences in RSC activity after direction is repeated, though we observed an increase (i.e., antiadaptation) rather than a decrease in activity. There is also evidence from rodent studies for HD cells in RSC (Chen et al., 1994; Cho and Sharp, 2001). Thus, the failure to observe significant distributed direction coding in RSC should not be taken as evidence that this region does not represent this information. Rather, it may simply reflect the fact that allocentric direction was correlated with low-level visual properties in our stimulus set. Alternatively, it is possible that RSC might have coded direction separately for each intersection rather than using a single representation that applied across the entire campus, or coded direction in terms of distal landmarks that were only partially consistent across locations. These results warrant future experiments using different stimuli for which allocentric direction is fully unconfounded from these factors.
In summary, our study demonstrates neural coding of spatial quantities necessary for navigation within a large-scale, real-world environment. We find that location and facing direction are represented in distributed patterns in specific brain regions, with medial temporal and medial parietal regions coding location, and medial temporal regions coding facing direction. These results link the animal neurophysiology, human neuropsychology, and human neuroimaging literatures, and are a first step toward understanding how spatial information might be represented in both the medial temporal lobe and higher-level association areas.
Notes
Supplemental material for this article is available at http://www.psych.upenn.edu/epsteinlab/pdfs/JN2013_FigS1.pdf. The material consists of example stimuli showing each of the 32 views and the 17 exemplar images of one view. This material has not been peer reviewed.
Footnotes
This work was supported by National Institutes of Health Grants R01-EY016464 (to R.A.E.) and F31-NS074729 (to L.K.V.), and National Science Foundation Grant SBE-0541957. We thank Geoffrey Aguirre, Steven Marchette, Teresa Pegors, and Anthony Stigliani for their thoughtful comments and suggestions.
The authors declare no competing financial interests.
References
- Aguirre GK. Continuous carry-over designs for fMRI. Neuroimage. 2007;35:1480–1494. doi: 10.1016/j.neuroimage.2007.02.005. [DOI] [PMC free article] [PubMed] [Google Scholar]
- Aguirre GK, D'Esposito M. Environmental knowledge is subserved by separable dorsal/ventral neural areas. J Neurosci. 1997;17:2512–2518. doi: 10.1523/JNEUROSCI.17-07-02512.1997. [DOI] [PMC free article] [PubMed] [Google Scholar]
- Aguirre GK, D'Esposito M. Topographical disorientation: a synthesis and taxonomy. Brain. 1999;122:1613–1628. doi: 10.1093/brain/122.9.1613. [DOI] [PubMed] [Google Scholar]
- Aguirre GK, Detre JA, Alsop DC, D'Esposito M. The parahippocampus subserves topographical learning in man. Cereb Cortex. 1996;6:823–829. doi: 10.1093/cercor/6.6.823. [DOI] [PubMed] [Google Scholar]
- Baumann O, Mattingley JB. Medial parietal cortex encodes perceived heading direction in humans. J Neurosci. 2010;30:12897–12901. doi: 10.1523/JNEUROSCI.3077-10.2010. [DOI] [PMC free article] [PubMed] [Google Scholar]
- Boccara CN, Sargolini F, Thoresen VH, Solstad T, Witter MP, Moser EI, Moser MB. Grid cells in pre- and parasubiculum. Nat Neurosci. 2010;13:987–994. doi: 10.1038/nn.2602. [DOI] [PubMed] [Google Scholar]
- Byrne P, Becker S, Burgess N. Remembering the past and imagining the future: a neural model of spatial memory and imagery. Psychol Rev. 2007;114:340–375. doi: 10.1037/0033-295X.114.2.340. [DOI] [PMC free article] [PubMed] [Google Scholar]
- Cacucci F, Lever C, Wills TJ, Burgess N, O'Keefe J. Theta-modulated place-by-direction cells in the hippocampal formation in the rat. J Neurosci. 2004;24:8265–8277. doi: 10.1523/JNEUROSCI.2635-04.2004. [DOI] [PMC free article] [PubMed] [Google Scholar]
- Chen LL, Lin LH, Green EJ, Barnes CA, McNaughton BL. Head-direction cells in the rat posterior cortex. I. Anatomical distribution and behavioral modulation. Exp Brain Res. 1994;101:8–23. doi: 10.1007/BF00243212. [DOI] [PubMed] [Google Scholar]
- Cho J, Sharp PE. Head direction, place, and movement correlates for cells in the rat retrosplenial cortex. Behav Neurosci. 2001;115:3–25. doi: 10.1037/0735-7044.115.1.3. [DOI] [PubMed] [Google Scholar]
- Drucker DM, Aguirre GK. Different spatial scales of shape similarity representation in lateral and ventral LOC. Cereb Cortex. 2009;19:2269–2280. doi: 10.1093/cercor/bhn244. [DOI] [PMC free article] [PubMed] [Google Scholar]
- Ekstrom AD, Kahana MJ, Caplan JB, Fields TA, Isham EA, Newman EL, Fried I. Cellular networks underlying human spatial navigation. Nature. 2003;425:184–188. doi: 10.1038/nature01964. [DOI] [PubMed] [Google Scholar]
- Epstein RA. Parahippocampal and retrosplenial contributions to human spatial navigation. Trends Cogn Sci. 2008;12:388–396. doi: 10.1016/j.tics.2008.07.004. [DOI] [PMC free article] [PubMed] [Google Scholar]
- Epstein RA, Morgan LK. Neural responses to visual scenes reveals inconsistencies between fMRI adaptation and multivoxel pattern analysis. Neuropsychologia. 2012;50:530–543. doi: 10.1016/j.neuropsychologia.2011.09.042. [DOI] [PMC free article] [PubMed] [Google Scholar]
- Epstein RA, Parker WE, Feiler AM. Where am I now? Distinct roles for parahippocampal and retrosplenial cortices in place recognition. J Neurosci. 2007;27:6141–6149. doi: 10.1523/JNEUROSCI.0799-07.2007. [DOI] [PMC free article] [PubMed] [Google Scholar]
- Gallistel CR. The organization of learning. Cambridge, MA: Bradford Books/MIT; 1990. [Google Scholar]
- Ghaem O, Mellet E, Crivello F, Tzourio N, Mazoyer B, Berthoz A, Denis M. Mental navigation along memorized routes activates the hippocampus, precuneus, and insula. Neuroreport. 1997;8:739–744. doi: 10.1097/00001756-199702100-00032. [DOI] [PubMed] [Google Scholar]
- Grill-Spector K, Henson R, Martin A. Repetition and the brain: neural models of stimulus-specific effects. Trends Cogn Sci. 2006;10:14–23. doi: 10.1016/j.tics.2005.11.006. [DOI] [PubMed] [Google Scholar]
- Habib M, Sirigu A. Pure topographical disorientation: a definition and anatomical basis. Cortex. 1987;23:73–85. doi: 10.1016/s0010-9452(87)80020-5. [DOI] [PubMed] [Google Scholar]
- Hafting T, Fyhn M, Molden S, Moser MB, Moser EI. Microstructure of a spatial map in the entorhinal cortex. Nature. 2005;436:801–806. doi: 10.1038/nature03721. [DOI] [PubMed] [Google Scholar]
- Hassabis D, Chu C, Rees G, Weiskopf N, Molyneux PD, Maguire EA. Decoding neuronal ensembles in the human hippocampus. Curr Biol. 2009;19:546–554. doi: 10.1016/j.cub.2009.02.033. [DOI] [PMC free article] [PubMed] [Google Scholar]
- Haxby JV, Gobbini MI, Furey ML, Ishai A, Schouten JL, Pietrini P. Distributed and overlapping representations of faces and objects in ventral temporal cortex. Science. 2001;293:2425–2430. doi: 10.1126/science.1063736. [DOI] [PubMed] [Google Scholar]
- Kravitz DJ, Peng CS, Baker CI. Real-world scene representations in high-level visual cortex: it's the spaces more than the places. J Neurosci. 2011a;31:7322–7333. doi: 10.1523/JNEUROSCI.4588-10.2011. [DOI] [PMC free article] [PubMed] [Google Scholar]
- Kravitz DJ, Saleem KS, Baker CI, Mishkin M. A new neural framework for visuospatial processing. Nat Rev Neurosci. 2011b;12:217–230. doi: 10.1038/nrn3008. [DOI] [PMC free article] [PubMed] [Google Scholar]
- Kriegeskorte N, Goebel R, Bandettini P. Information-based functional brain mapping. Proc Natl Acad Sci U S A. 2006;103:3863–3868. doi: 10.1073/pnas.0600244103. [DOI] [PMC free article] [PubMed] [Google Scholar]
- Maguire EA. The retrosplenial contribution to human navigation: a review of lesion and neuroimaging findings. Scand J Psychol. 2001;42:225–238. doi: 10.1111/1467-9450.00233. [DOI] [PubMed] [Google Scholar]
- Maguire EA, Burgess N, Donnett JG, Frackowiak RS, Frith CD, O'Keefe J. Knowing where and getting there: a human navigation network. Science. 1998;280:921–924. doi: 10.1126/science.280.5365.921. [DOI] [PubMed] [Google Scholar]
- Maguire EA, Nannery R, Spiers HJ. Navigation around London by a taxi driver with bilateral hippocampal lesions. Brain. 2006;129:2894–2907. doi: 10.1093/brain/awl286. [DOI] [PubMed] [Google Scholar]
- Morgan LK, Macevoy SP, Aguirre GK, Epstein RA. Distances between real-world locations are represented in the human hippocampus. J Neurosci. 2011;31:1238–1245. doi: 10.1523/JNEUROSCI.4667-10.2011. [DOI] [PMC free article] [PubMed] [Google Scholar]
- Nichols TE, Holmes AP. Nonparametric permutation tests for functional neuroimaging: a primer with examples. Hum Brain Mapp. 2002;15:1–25. doi: 10.1002/hbm.1058. [DOI] [PMC free article] [PubMed] [Google Scholar]
- O'Keefe J, Dostrovsky J. The hippocampus as a spatial map. Preliminary evidence from unit activity in the freely-moving rat. Brain Res. 1971;34:171–175. doi: 10.1016/0006-8993(71)90358-1. [DOI] [PubMed] [Google Scholar]
- Park S, Chun MM. Different roles of the parahippocampal place area (PPA) and retrosplenial cortex (RSC) in panoramic scene perception. Neuroimage. 2009;47:1747–1756. doi: 10.1016/j.neuroimage.2009.04.058. [DOI] [PMC free article] [PubMed] [Google Scholar]
- Park S, Brady TF, Greene MR, Oliva A. Disentangling scene content from spatial boundary: complementary roles for the parahippocampal place area and lateral occipital complex in representing real-world scenes. J Neurosci. 2011;31:1333–1340. doi: 10.1523/JNEUROSCI.3885-10.2011. [DOI] [PMC free article] [PubMed] [Google Scholar]
- Pruessner JC, Köhler S, Crane J, Pruessner M, Lord C, Byrne A, Kabani N, Collins DL, Evans AC. Volumetry of temporopolar, perirhinal, entorhinal and parahippocampal cortex from high-resolution MR images: considering the variability of the collateral sulcus. Cereb Cortex. 2002;12:1342–1353. doi: 10.1093/cercor/12.12.1342. [DOI] [PubMed] [Google Scholar]
- Renninger LW, Malik J. When is scene identification just texture recognition? Vision Res. 2004;44:2301–2311. doi: 10.1016/j.visres.2004.04.006. [DOI] [PubMed] [Google Scholar]
- Robertson RG, Rolls ET, Georges-François P, Panzeri S. Head direction cells in the primate pre-subiculum. Hippocampus. 1999;9:206–219. doi: 10.1002/(SICI)1098-1063(1999)9:3<206::AID-HIPO2>3.0.CO;2-H. [DOI] [PubMed] [Google Scholar]
- Rosenbaum RS, Priselac S, Köhler S, Black SE, Gao F, Nadel L, Moscovitch M. Remote spatial memory in an amnesic person with extensive bilateral hippocampal lesions. Nat Neurosci. 2000;3:1044–1048. doi: 10.1038/79867. [DOI] [PubMed] [Google Scholar]
- Rosenbaum RS, Ziegler M, Winocur G, Grady CL, Moscovitch M. “I have often walked down this street before”: fMRI studies on the hippocampus and other structures during mental navigation of an old environment. Hippocampus. 2004;14:826–835. doi: 10.1002/hipo.10218. [DOI] [PubMed] [Google Scholar]
- Sapountzis P, Schluppeck D, Bowtell R, Peirce JW. A comparison of fMRI adaptation and multivariate pattern classification analysis in visual cortex. Neuroimage. 2010;49:1632–1640. doi: 10.1016/j.neuroimage.2009.09.066. [DOI] [PMC free article] [PubMed] [Google Scholar]
- Sato N, Sakata H, Tanaka YL, Taira M. Navigation-associated medial parietal neurons in monkeys. Proc Natl Acad Sci U S A. 2006;103:17001–17006. doi: 10.1073/pnas.0604277103. [DOI] [PMC free article] [PubMed] [Google Scholar]
- Sawamura H, Orban GA, Vogels R. Selectivity of neuronal adaptation does not match response selectivity: a single-cell study of the FMRI adaptation paradigm. Neuron. 2006;49:307–318. doi: 10.1016/j.neuron.2005.11.028. [DOI] [PubMed] [Google Scholar]
- Segaert K, Weber K, de Lange FP, Petersson KM, Hagoort P. The suppression of repetition enhancement: a review of fMRI studies. Neuropsychologia. 2013;51:59–66. doi: 10.1016/j.neuropsychologia.2012.11.006. [DOI] [PubMed] [Google Scholar]
- Smith DM, Barredo J, Mizumori SJ. Complimentary roles of the hippocampus and retrosplenial cortex in behavioral context discrimination. Hippocampus. 2012;22:1121–1133. doi: 10.1002/hipo.20958. [DOI] [PMC free article] [PubMed] [Google Scholar]
- Summerfield C, Trittschuh EH, Monti JM, Mesulam MM, Egner T. Neural repetition suppression reflects fulfilled perceptual expectations. Nat Neurosci. 2008;11:1004–1006. doi: 10.1038/nn.2163. [DOI] [PMC free article] [PubMed] [Google Scholar]
- Takahashi N, Kawamura M, Shiota J, Kasahata N, Hirayama K. Pure topographic disorientation due to right retrosplenial lesion. Neurology. 1997;49:464–469. doi: 10.1212/wnl.49.2.464. [DOI] [PubMed] [Google Scholar]
- Taube JS, Muller RU, Ranck JB., Jr Head-direction cells recorded from the postsubiculum in freely moving rats. I. Description and quantitative analysis. J Neurosci. 1990;10:420–435. doi: 10.1523/JNEUROSCI.10-02-00420.1990. [DOI] [PMC free article] [PubMed] [Google Scholar]
- Teng E, Squire LR. Memory for places learned long ago is intact after hippocampal damage. Nature. 1999;400:675–677. doi: 10.1038/23276. [DOI] [PubMed] [Google Scholar]
- Van Leemput K, Bakkour A, Benner T, Wiggins G, Wald LL, Augustinack J, Dickerson BC, Golland P, Fischl B. Automated segmentation of hippocampal subfields from ultra-high resolution in vivo MRI. Hippocampus. 2009;19:549–557. doi: 10.1002/hipo.20615. [DOI] [PMC free article] [PubMed] [Google Scholar]
- Vann SD, Aggleton JP, Maguire EA. What does the retrosplenial cortex do? Nat Rev Neurosci. 2009;10:792–802. doi: 10.1038/nrn2733. [DOI] [PubMed] [Google Scholar]
- Walther DB, Caddigan E, Fei-Fei L, Beck DM. Natural scene categories revealed in distributed patterns of activity in the human brain. J Neurosci. 2009;29:10573–10581. doi: 10.1523/JNEUROSCI.0559-09.2009. [DOI] [PMC free article] [PubMed] [Google Scholar]
- Wolbers T, Büchel C. Dissociable retrosplenial and hippocampal contributions to successful formation of survey representations. J Neurosci. 2005;25:3333–3340. doi: 10.1523/JNEUROSCI.4705-04.2005. [DOI] [PMC free article] [PubMed] [Google Scholar]
- Yarkoni T, Poldrack RA, Nichols TE, Van Essen DC, Wager TD. Large-scale automated synthesis of human functional neuroimaging data. Nat Methods. 2011;8:665–670. doi: 10.1038/nmeth.1635. [DOI] [PMC free article] [PubMed] [Google Scholar]
- Yoder RM, Clark BJ, Taube JS. Origins of landmark encoding in the brain. Trends Neurosci. 2011;34:561–571. doi: 10.1016/j.tins.2011.08.004. [DOI] [PMC free article] [PubMed] [Google Scholar]