Abstract
Imaging plays a key role in the diagnosis of central nervous system (CNS) metastasis. Imaging is used to detect metastases in patients with known malignancies and new neurological signs or symptoms, as well as to screen for CNS involvement in patients with known cancer. Computed tomography (CT) and magnetic resonance imaging (MRI) are the key imaging modalities used in the diagnosis of brain metastases. In difficult cases, such as newly diagnosed solitary enhancing brain lesions in patients without known malignancy, advanced imaging techniques including proton magnetic resonance spectroscopy (MRS), contrast enhanced magnetic resonance perfusion (MRP), diffusion weighted imaging (DWI), and diffusion tensor imaging (DTI) may aid in arriving at the correct diagnosis. This image-rich review discusses the imaging evaluation of patients with suspected intracranial involvement and malignancy, describes typical imaging findings of parenchymal brain metastasis on CT and MRI, and provides clues to specific histological diagnoses such as the presence of hemorrhage. Additionally, the role of advanced imaging techniques is reviewed, specifically in the context of differentiating metastasis from high-grade glioma and other solitary enhancing brain lesions. Extra-axial CNS involvement by metastases, including pachymeningeal and leptomeningeal metastases is also briefly reviewed.
Keywords: Brain metastasis, computed tomography, diffusion weighted imaging, magnetic resonance imaging, magnetic resonance spectroscopy, magnetic resonance perfusion
INTRODUCTION
Imaging is increasingly important in the diagnosis and management of central nervous system (CNS) metastatic disease. Imaging may provide initial confirmation of previously unsuspected malignancy in patients with neurologic symptoms, may confirm metastatic disease in the setting of known systemic malignancy, and may be used to stage and restage CNS involvement during the course of treatment.
Although magnetic resonance imaging (MRI) is more sensitive than computed tomography (CT) for detection of brain metastases, CT remains a vital tool for initial work-up and perioperative management. Advanced MRI techniques such as magnetic resonance spectroscopy (MRS), magnetic resonance perfusion (MRP), diffusion weighted imaging (DWI), and diffusion tensor imaging (DTI) may also be utilized to help distinguish brain metastases from other pathologies, and also to monitor treatment response. Nuclear medicine studies including 18 fluorodeoxyglucose positron emission tomography (FDG-PET) and other molecular imaging may play a larger role in the future.
This review discusses imaging features common to brain metastases, with a focus on CT and MRI. The role of advanced MRI techniques in the diagnosis and management of brain metastases is discussed, as is the utility of these techniques for problem solving in patients with de novo brain masses.
WHO SHOULD UNDERGO IMAGING?
Brain metastases occur in 15-40% of patients with cancer,[27,49] many of whom are asymptomatic. Certain malignancies are often associated with brain metastases, including cancers of the lung, breast, skin, colon, pancreas, testes, ovary, cervix, renal cell carcinoma, and melanoma,[5,15,49] although many case reports of intracranial metastatic disease from various other cancers exist.
The detection of brain metastases is important for initial staging of patients with systemic malignancy. In some cases, the presence of brain metastases comes to clinical attention through new neurological signs and symptoms, and imaging is therefore indicated in such patients.[48] Symptoms may include headache, seizure, syncope, focal neurological deficit, or papilledema.[27,48,49] Nonenhanced CT (NECT) is the first line imaging modality for patients with new neurological deficits because it is easily obtained, well tolerated, and can rapidly exclude life threatening emergencies such as hemorrhage, hydrocephalus, or significant mass effect.[5] Subsequent evaluation with contrast-enhanced CT (CECT) or MRI may be indicated, as is discussed later.
Brain metastases are asymptomatic up to 60-75% of the time.[49] The presence of asymptomatic brain metastases may alter the staging of certain malignancies, thereby changing treatment strategy. For example, in nonsmall cell lung cancer, the presence of brain metastases may change the treatment paradigm from potentially curative surgical resection of the primary lesion to palliative chemotherapy and/or radiation therapy.[29,39,48]
LOCATION OF CNS METASTASES
Metastatic disease can involve different compartments of the CNS. Most commonly, metastatic disease affects the skull and/or brain parenchyma. Metastases can also involve the leptomeninges and pachymeninges.[35] This chapter primarily focuses on brain parenchymal metastases.
CONVENTIONAL IMAGING OF BRAIN METASTASES
Brain metastases display certain cross-sectional imaging features on both CT and MRI [Figure 1]. They tend to be located at the gray–white junction and at border zones between major arterial vascular territories.[15,25] Up to 80% of brain metastases occur in the cerebral hemispheres, 15% in the cerebellum, and 3% in the basal ganglia.[40,41] Certain cancers may preferentially metastasize to the posterior fossa, including uterine, prostate, and gastrointestinal primary tumors[15] [Figure 2]. Occasionally, tumors may metastasize to the choroid plexus, ventricles, pituitary gland, or leptomeninges.[35] Rarely, some malignancies including lymphoma may spread along or within the cerebral vessels.[54,55]
Figure 1.
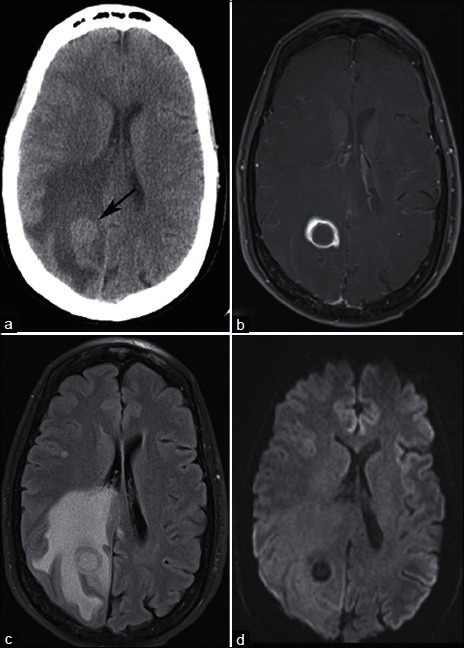
A 59-year-old smoker with headache and balance problems. (a) NECT demonstrates a right parietal mass at the gray–white junction with surrounding vasogenic edema. Postcontrast T1-weighted MRI (b) demonstrates ring enhancement, and FLAIR (c) confirms extensive vasogenic edema. (d) DWI demonstrates no restricted diffusion centrally, helping to differentiate this lesion from pyogenic abscess. Needle guided biopsy of a lung mass revealed nonsmall cell lung cancer. The patient underwent stereotactic radiosurgery of the brain mass for presumed lung cancer metastasis
Figure 2.
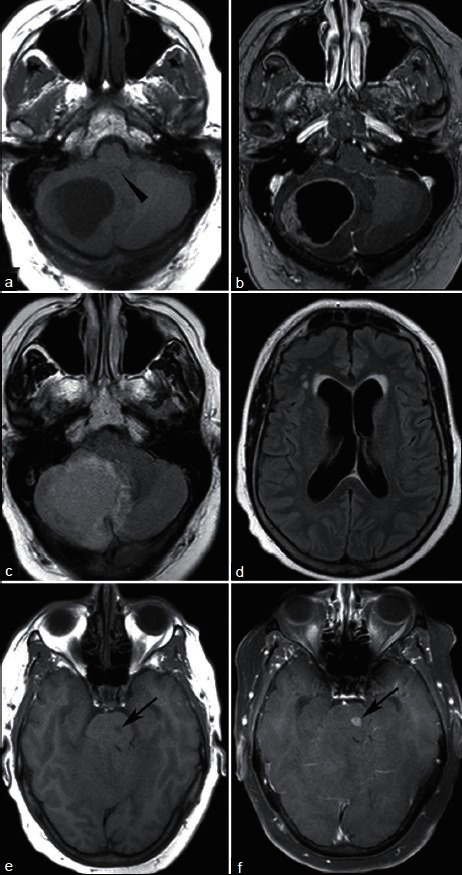
A 61-year-old woman with endometrial cancer and new headache. T1-weighted MRI without (a) and with (b) contrast demonstrates a ring enhancing lesion causing mass effect on the fourth ventricle (arrowhead). FLAIR sequence shows surrounding vasogenic edema (c) and enlarged lateral ventricles (d) without transependymal CSF flow to indicate acute hydrocephalus. A second enhancing lesion within the pons (e, T1; f, T1 postcontrast, arrows) was presumed metastatic, and the patient was treated with whole brain irradiation. Pathologic evaluation of the cerebellar mass confirmed endometrial cancer
Brain metastases may be solitary or multiple. Brain metastases are solitary approximately 50% of the time;[44] 20% of the time there are two lesions, and 30% of the time, three or more lesions are identified.[15] Some tumors, including breast, renal cell, colon, and thyroid cancers are more commonly solitary, while others such as lung cancer and melanoma tend to be multiple.[5] Nevertheless, the number of metastases is insufficient to reliably suggest tissue type.
Imaging characteristics of metastases may suggest an underlying pathologic diagnosis. For example, metastases may hemorrhage, and certain malignancies are more susceptible to hemorrhage [Figure 3]. Metastases that classically hemorrhage include melanoma,[34,50] choriocarcinoma,[50] renal cell carcinoma,[51] and thyroid cancer. Lung metastases are also known to hemorrhage.[51] Of all hemorrhagic metastases, however, lung and breast cancers are the most common etiologies due to their higher overall prevalence.
Figure 3.
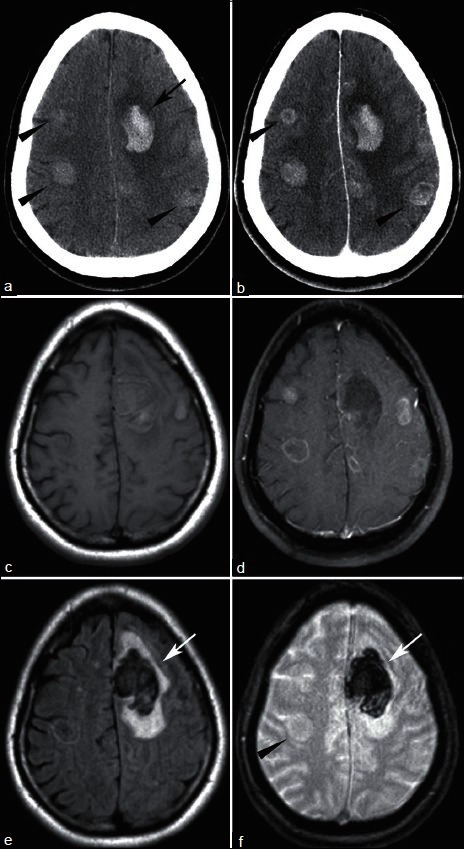
44 year-old found down. (a) NECT shows left frontal hemorrhage (arrow) with additional hyperdense lesions (arrowheads). (b) CECT shows enhancement, better delineating some of the masses (arrowheads). T1-weighted MRI without (c) and with (d) contrast shows multiple enhancing lesions. FLAIR (e) shows vasogenic edema surrounding the hemorrhage (arrow), but little edema associated with other lesions. T2* sequence (f) redemonstrates left frontal hemorrhage (arrow) but no blood within with the other lesions (arrowhead). Pathology revealed small cell lung cancer
COMPUTED TOMOGRAPHY
NECT may be the first imaging modality a patient with brain metastases undergoes, either in the setting of previously unrecognized malignancy, or with the development of new neurologic findings and a known malignancy. NECT alone is not sensitive enough to screen for cerebral metastases,[19] but findings on NECT can suggest the diagnosis.
Brain metastases on CT appear as solitary or multiple mass lesions with variable surrounding vasogenic edema. In the absence of hemorrhage, metastases may be hypodense, isodense, or hyperdense compared with the brain.[41] Acutely hemorrhagic metastases appear hyperdense to brain tissue [Figure 3]. Melanoma metastases tend to be hyperdense to brain on CT even in the absence of hemorrhage.[18,34]
Brain metastases generally do not calcify, although there are several reports of this in the literature.[38] The presence of calcification may lead to the consideration of alternative diagnoses, but metastases should remain on the differential diagnoses in the appropriate clinical setting.
Iodinated contrast enhancement is vital to the detection of metastases on CT, and brain metastases may demonstrate ring, nodular, or solid enhancement. Several reports in the literature have found that more metastases are visible on delayed imaging,[7,46] and the size of a given metastasis may appear to increase on delayed imaging.[7,47]
CECT may be used to screen for metastases if MRI is contraindicated or unavailable, and CECT has been shown to be more sensitive than noncontrast MRI for the detection of cerebral metastases[51] [Figure 4]. CECT is less sensitive than contrast-enhanced brain MRI, however, as multiple studies have shown.[14,29,44,56] In some earlier studies, CECT was found to be equivalent to MRI, which may be related to volume averaging artifact due to thicker slices used in earlier MRI imaging.[2]
Figure 4.
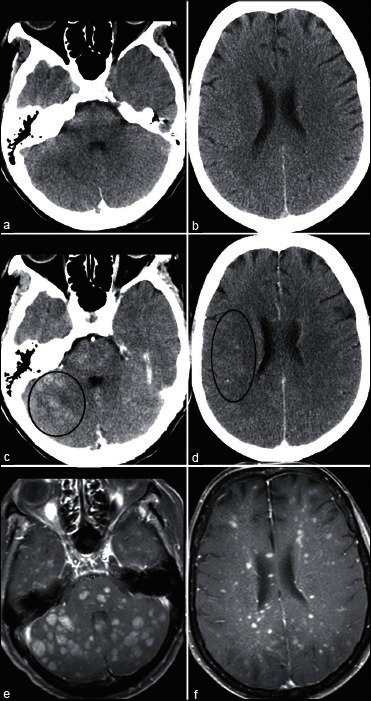
A 67-year-old woman with recurrent ovarian cancer and 3 weeks of progressive difficulty walking. Nonenhanced CT (a and b) was normal. After contrast administration, multiple ill-defined nodules become evident (e.g., circles in c and d). Innumerable enhancing nodules are more conspicuous on contrast enhanced T1-weighted MRI (e and f)
CECT is recommended on equal footing with MRI for the detection of asymptomatic nonsmall cell lung cancer metastases in the 2007 evidence-based ACCP guidelines,[48] in part because no improvement in survival has been reported based on screening with MRI versus CT.[56] If MRI is planned based on the NECT, and is available in a reasonable time frame, there may be little added value of giving contrast at the time of CT scanning. Alternatively, if CECT shows multiple brain metastases, there may be little added value of obtaining brain MRI.[49]
CONVENTIONAL MAGNETIC RESONANCE IMAGING
MRI is a sensitive screening test for brain metastasis. It is also useful to further evaluate mass lesions found on NECT in order to refine the differential diagnosis. Additionally, the 2006 European Federation of Neurological Societies guidelines for the diagnosis and treatment of brain metastases suggests MRI in cases where surgery or radiosurgery is planned, in order to detect additional lesions; in cases where CT is negative but there is a strong clinical suspicion for metastases in patients with known malignancy; and in patients for whom CT is not conclusive in determining whether a lesion is neoplastic or nonneoplastic.[49]
On MRI, metastases are usually iso- or hypointense on T1, hyperintense on T2, and exhibit avid enhancement [Figure 1]. Some metastases, such as melanoma, are T1 hyperintense due to the paramagnetic effects of melanin [Figure 3]. Hemorrhagic metastases may also demonstrate T1 signal hyperintensity, depending on the age of hemorrhage. DWI usually demonstrates facilitated diffusion (i.e., bright on apparent diffusion coefficient (ADC) map), rather than diffusion restriction. This is discussed more in depth below.
Vasogenic edema can be substantial, and is unrelated to lesion size. Some reports found a significantly increased ratio of vasogenic edema to contrast enhancing lesion size in metastases compared with high-grade primary brain tumors,[12,21] although metastases may display little or no vasogenic edema.[41] Small cortically based metastases may not demonstrate any visible edema, and must therefore be looked for carefully.[1]
Gadolinium contrast enhancement is vital to detect small metastases. Several studies have documented the utility of contrast in the detection of additional lesions compared with noncontrast studies[4,23,57] [Figure 3]. In these studies, contrast administration improved diagnostic confidence. Contrast administration is also important to distinguish nonneoplastic white matter disease (such as chronic microvascular ischemic disease, which does not enhance) from metastases.
The standard gadolinium contrast dose for evaluation for brain lesions is 0.1 mmol/kg based on patient weight. Several studies have evaluated increasing contrast doses to improve lesion detection. While increasing contrast dose may reveal additional metastases, the added value of these findings has yet to be established. For example, studies utilizing incremental doses of gadoteridol and gadodiamide found that 0.3 mmol/kg dose resulted in more lesions detected and improved lesion visualization compared with 0.1 mmol/kg.[2,43,57] Similarly, a study utilizing incremental doses of gadobenate up to 0.2 mmol/kg found additional lesions with increasing contrast dose.[4]
The utility of finding additional lesions in the setting of multiple brain metastases has not been established. In the gadoteridol study mentioned above, 31 of the study patients with additional metastases detected by the higher contrast dose were reviewed by a neuro-oncologist, and in only three cases (roughly 10%) would the additional findings have changed management.[57]
Thin slice (2.4 mm or less) spoiled gradient-recalled echo (SPGR) postcontrast MRI performed in a head frame for gamma knife treatment planning has been shown to be more sensitive for the detection of small metastases than standard T1 spin echo-weighted imaging,[37] with additional lesions identified in 34% of patients. Of patients thought to have single metastases, 16% were found to have multiple lesions by T1 SPGR. Although some of the increased detection may be due to rigid head fixation, which is not feasible for a screening examination, thin section postcontrast T1 SPGR imaging is likely itself more sensitive.
MR SPECTROSCOPY
Proton MR Spectroscopy is a useful tool to distinguish whether a brain mass is neoplastic or nonneoplastic, but has not been shown to reliably distinguish metastasis from high-grade primary glial neoplasm such as glioblastoma[8,24] [Figure 5]. Studies have evaluated the use of both single voxel and multivoxel spectroscopy. Although either can be useful, advantages of multivoxel spectroscopy are finer spatial resolution and greater extent of coverage, which allows evaluation of different components of heterogeneous masses. Some areas within a tumor may be more metabolically active than others. For example, MR spectroscopy of the central nonenhancing portion of ring-enhancing brain tumors may show evidence of necrosis and/or anaerobic metabolism, while the central nonenhancing portions of pyogenic abscesses may reveal byproducts of fermentation. Additionally, spectra from contrast enhancing tumor tissues and peritumeral edema can be compared in order to evaluate the presence or absence of peritumoral white matter infiltration by nonenhancing tumor.
Figure 5.
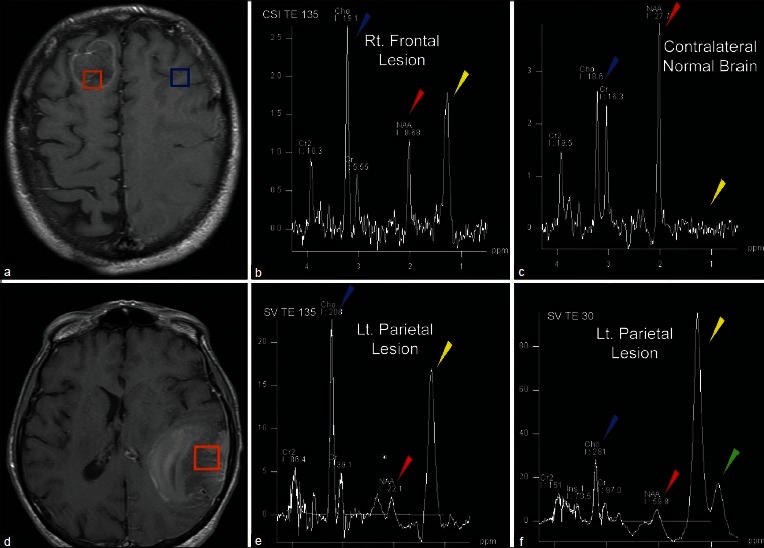
A 59-year-old with pulmonary TB and word finding difficulty. Post-contrast MRI demonstrates two lesions, right frontal (a), and left parietal (d). Multivoxel MRS (b and c) demonstrates decreased NAA (red arrowhead) and elevated Cho/Cr ratio (Blue arrowhead) in the tumor (b) compared to normal white matter (c). Additionally, lactate is observed in the tumor (yellow arrowhead) but not in normal brain. Single voxel MRS at intermediate TE (e) and short TE (f) demonstrates abnormal metabolite ratios (e and f). Lipid peaks are evident on short TE spectra (green arrowhead) within the lesion. These findings indicate the lesions are metastases rather than tuberculomas
Metabolites commonly evaluated in brain spectroscopy include: choline at 3.2 ppm, a marker of cell membrane turnover; N-acetyl aspartate (NAA) at 2.0 ppm, a marker of neuronal integrity; lactate at 1.3 ppm, a marker of anaerobic metabolism; and lipid between 0.9 and 1.4 ppm, a by-product of necrosis. Creatine (3.0 ppm, a marker for energy metabolism) is often used as an internal control against which other metabolite peaks are compared. Common ratios evaluated in proton spectroscopy of the brain include the choline/creatine ratio and the choline/NAA ratio. Ratios may be calculated from either the maximum height of the peak, or from the area under the curve of the metabolite peak. Discussion of the relative merits of these methods is beyond the scope of this paper.
The enhancing components of both brain metastases and high-grade gliomas demonstrate increased choline/creatine peak ratios compared with normal brain.[3,8,13,17] Although some studies report statistically significant differences in choline/creatine ratios between high-grade gliomas and metastases, the values are often variable and there is overlap among tumors of each group, so this ratio alone is not reliable in differentiating the two entities.[30,45] In fact, studies vary on whether the choline/creatine ratio is higher or lower in metastases compared with high-grade glial neoplasms.
Other metabolites have also been evaluated in the quest to distinguish metastases from high-grade gliomas. Lipid and lactate may be elevated in brain tumors due to necrosis. While brain metastases have been reported to demonstrate elevated lipid and lactate peaks,[3] these peaks have not been found reliable in distinguishing the brain metastases from high-grade gliomas, which may also be necrotic.[8,17,26,30,45] High-grade gliomas tend to have elevated myoinosital peaks, and this has not been reported in brain metastases.[6,17] Both tumor types may have depressed NAA.[3,13]
While no clear means of differentiating metastases from high-grade gliomas by spectroscopy of the enhancing component of the tumor has become evident, evaluation of the nonenhancing T2-hyperintense areas around the enhancing mass has shown promise for differentiating primary glial tumors from metastases. The pathologic basis behind this lies on the infiltrative nature of gliomas compared with metastases.[6,30] Specifically, the T2-hyperintense region surrounding enhancing brain metastases represents pure vasogenic edema, while in glial tumors, this often represents a combination of vasogenic edema and infiltrative neoplastic cells.
Multiple studies have shown that the metabolite profile of the T2-hyperintense, nonenhancing area surrounding the enhancing mass of high-grade gliomas demonstrates significantly elevated choline/creatine ratios compared with metastases. Spectra of the T2-hyperintense area around enhancing metastases demonstrate spectra more similar to normal white matter,[13,17] or a pattern of depressed metabolites.[30]
Even if the peak ratios on spectroscopy are significantly different between cohorts of metastases and high-grade glial neoplasms, it is important to recognize there may be overlap between values for individual tumors, rendering diagnosis in specific cases difficult. Server et al. compared metabolite ratios between 53 high-grade gliomas and 20 metastases.[45] This study compared metabolic peak area ratios obtained using a multivoxel, two-dimensional chemical shift imaging (2D CSI) technique at an echo time of 135 on a 1.5 Tesla magnet. With this technique, spectroscopic evaluation of the peritumoral area was the most accurate method for distinguishing metastasis from high-grade glial neoplasms by receiver-operator curve analysis using cut-off values of choline/creatine ratios of 1.24 in the peritumoral region, and choline/NAA ratios of 1.11. Please note that the exact ratio values may vary depending on magnet strength, acquisition technique, echo time and other local technical factors, and therefore a specific numerical cut off threshold is best interpreted as a general guideline in complement to other imaging findings.
MR PERFUSION
MR perfusion may be performed using a variety of methods. Most commonly, perfusion imaging is acquired during administration of gadolinium-based contrast while repeatedly sampling signal from brain tissues of interest. This may be performed using T2-weighted or T2FNx01-weighted dynamic susceptibility contrast (DSC) or T1-weighted dynamic contrast-enhanced (DCE) technique. Technical differences between these techniques are beyond the scope of this review. Additionally, newer methods of evaluating brain perfusion using arterial spine labeling (ASL), which do not require contrast administration, are rapidly being developed. The studies described in this section predominantly utilize DSC perfusion techniques, unless otherwise noted.
A commonly reported perfusion parameter obtained from both DSC and DCE techniques is the relative cerebral blood volume (rCBV). This is calculated by comparing the cerebral blood volume in a region of interest drawn over the lesion of concern to the CBV of an identical region of interest placed over the normal-appearing white matter in the contralateral cerebral hemisphere. Additional parameters may be calculated from perfusion studies, including evaluation of time to peak contrast level, estimation of cerebral blood flow, and estimation of capillary permeability.
Brain metastases are often highly vascular lesions that tend to exhibit elevated rCBV compared with contralateral normal white matter, as do many high-grade glial neoplasms, and most glioblastomas in particular. Thus, comparison of rCBV of the enhancing component of the tumor is not able to accurately differentiate between these two groups.[6,10,13,21] More detailed evaluation of the perfusion data may yield additional information that can distinguish between the two entities, including evaluation of signal recovery DSC perfusion imaging, a proposed measure of capillary permeability.[11]
As in MR spectroscopy, evaluation of the T2-hyperintense region around the contrast-enhancing tumor has shown promise in differentiating primary glial neoplasms from brain metastases. High-grade gliomas demonstrate elevated rCBV or elevated peak height (a proposed measure of capillary volume) in the peritumoral T2-hyperintense component of the lesion, compared with metastases.[11,13,21,30] Again, this is felt to be in keeping with the infiltrative nature of glial neoplasms compared with metastases. A cut-off value of rCBV of 0.46 in the peritumoral nonenhancing T2-hyperintense component of lesions has been proposed, with a sensitivity and specificity of 77.3% and 96.2%, respectively, derived from a series of 48 tumors.[21]
While differentiating metastases from primary brain tumors using MR perfusion imaging is difficult, perfusion imaging may help differentiate between brain metastases and cerebral abscesses, which can appear identical on anatomic imaging. Unlike metastases, cerebral abscesses demonstrate reduced rather than elevated rCBV.[20] Additionally, perfusion MRI may help distinguish CNS lymphoma from metastasis and high-grade glioma, as lymphoma demonstrates lower rCBV compared with these two entities.[6,20]
Perfusion characteristics of brain tumors depend on the nature of the capillaries within them. In the case of metastases, this will depend on the primary tumor as well as relative differentiation of the tumor cells. Thus, hypervascular metastases such as renal cell carcinoma and melanoma may show markedly elevated relative cerebral blood flow compared with less vascular metastases.[28] While limited reports comparing perfusion characteristics of different metastatic lesions have not yielded significant differences,[20] this is an intriguing area for future research.
DIFFUSION WEIGHTED IMAGING/DIFFUSION TENSOR IMAGING
Metastases tend to demonstrate facilitated diffusion in the form of elevated ADC values,[3] as do primary glial neoplasms, compared with normal white matter. Evaluation of ADC values in the nonenhancing T2-hyperintense areas surrounding an enhancing tumor may help distinguish high-grade gliomas from metastasis, with lower ADC values in infiltrated areas of primary neoplasms compared with metastases. DWI may also distinguish metastases from pyogenic abscesses, which demonstrate markedly restricted diffusion in their central nonenhancing portions.[36]
ADC values tend to be higher in both the contrast-enhancing portion of the tumor as well as in the peritumoral area for metastases compared with high-grade gliomas.[13,31] While some studies found the ADC values of the enhancing tumor to be significantly different between the two entities,[13] others have not.[8,10,31,53] Evaluation of ADC values in the nonenhancing surrounding area of T2-hyperintensity may help distinguish high-grade gliomas from metastases, with lower values in infiltrated areas of primary neoplasms compared with metastases.[31] One group suggested a cut-off value of the minimum ADC of nonenhancing T2-hyperintense lesion of 1.3 × 10⁻³ mm2/s to distinguish metastasis from high-grade glioma: Values less than this indicate high-grade glioma rather than metastasis, with a sensitivity of 83% and a specificity of 79%.
Other studies aiming to utilize ADC values to distinguish lymphoma from high-grade glioma or metastasis have not found this value to be diagnostic.[10] While lymphomas tend to exhibit lower ADC values compared with high-grade glial neoplasms and metastases, this finding may be suggestive of (rather than diagnostic for) CNS lymphoma.[10]
A small study evaluating DWI signal intensity and ADC values of various histologic types of metastases found lower DWI signal intensity in enhancing portions of well-differentiated adenocarcinomas as compared with poorly differentiated carcinomas.[22] Additionally, lower normalized ADC values were correlated with higher tumor cellularity. Other studies have not found any correlation between restricted diffusion or ADC values and tumor histology.[16]
DTI is a technique evaluating diffusion measurements in multiple (at least six) directions, as opposed to the three directions generally sampled in standard DWI imaging. This allows more detailed evaluation of diffusivity as well as evaluation of the integrity of fiber tracts. Comparison of the mean diffusivity of the enhancing portion of glioblastomas and metastasis found significantly increased diffusivity in glioblastomas.[9] Interrogation of the peritumoral region of metastases and high-grade glial neoplasms found increased mean diffusivity in both, although that of metastases was significantly greater than high-grade gliomas.[9,32] Physiologically, this finding is similar to the finding of increased ADC values in peritumoral region of metastases compared with high-grade gliomas.
Fractional anisotropy, a measure of the directional organization of tissue architecture, is decreased in the peritumoral region of both tumor types compared with normal white matter. While one study found fractional anistropy to be significantly elevated in the enhancing component of glioblastoma compared with metastasis,[53] others have found no significant difference between the two.[9,52] One study reported significantly lower fractional anisotropy within the peritumeral region of metastases compared with high-grade gliomas,[9] but others have not.[32,52]
To summarize, many studies have attempted to differentiate enhancing parenchymal lesions, particularly metastasis and high-grade glioma, based on advanced MRI techniques. While several individual parameters have potential to differentiate the two entities, heterogeneity of the tumor components of high-grade gliomas, and differences in histologic subtype of metastases likely limits the utility of any particular measure. Rather, careful consideration of a combination of findings from MRS, MRP, DWI, and DTI is likely the best approach to accurately diagnose the nature of a solitary enhancing parenchymal mass.[53]
ANGIOGRAGHY
At present, catheter angiography plays no role in the diagnosis of brain metastases.
FDG-PET
FDG-PET and PET-CT are increasingly utilized tools in the staging of cancers, particularly in lung cancer.[39] Although FDG-PET plays an important role in staging elsewhere in the body, it has not been found to be as sensitive as MRI in the evaluation of brain metastases.[29,33,39,42] Cerebral cortex is highly FDG avid, and metastases often appear as focal areas of hypometabolism, which may also be seen in nonneoplastic entities such as infarction. Some lesions do manifest as focal areas of hypermetabolism, although this can be difficult to detect in the setting of normal physiologic gray matter metabolism.
The sensitivity of FDG PET is also limited for small lesions.[42] If performed in conjunction with contrast enhanced CT, more lesions may be detected or confirmed by CT. However, in a recent study of 104 patients with lung cancer, PET-CT was only 27% sensitive compared with contrast-enhanced MRI for brain metastases. In almost all of the cases, brain metastases detected by PET-CT were evident only on the CECT portion of the examination, with FDG-PET only detecting altered metabolism in 1/8 patients with disease detectible by PET-CT.[29] Similarly, FDG-PET was not as sensitive as whole body MRI in the detection of brain metastases in a small study including only 7/90 patients with brain metastases.[39] While more sensitive than FDG-PET, whole body MRI was not as sensitive as conventional brain MRI for the detection of intracranial metastases in this small sample.
NONPARENCHYMAL CENTRAL NERVOUS SYSTEM METASTASES
Pachymeningeal metastases are based in the dura mater. While dural involvement commonly results from local invasion by a skull metastasis, malignant lesions can also primarily involve the dura. Particular cancers are associated with dural-based metastases, including breast, lung, prostate cancers, and lymphoma.[5,35] Dural-based metastases appear as focal nodular or diffuse enhancing dural masses [Figure 6]. Dural-based metastases often spare the subarachnoid space, but can invade adjacent brain parenchyma.
Figure 6.
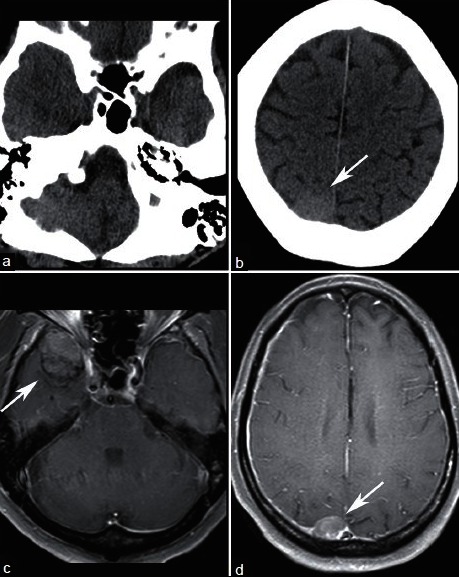
A 63-year-old male with known metastatic prostate cancer who presented with somnolence and word finding difficulty. NECT (a and b) demonstrates a hyperdense right parietal lesion (arrow) and equivocal fullness in the right middle cranial fossa. Contrast enhanced T1-weighted MRI clearly shows dural-based enhancing lesions in the right middle cranial fossa (c), and right parietal convexity (d). Lesions were new compared with MRI obtained 7 months prior and are consistent with pachymeningeal metastases
Differentiating a dural-based metastasis from meningioma can be difficult. Both may be hyperdense on noncontrast CT and enhance avidly.[18] Known history of malignancy, presence of both dural-based and parenchymal lesions, and development of a new dural lesion compared with prior imaging may be helpful to suggest a diagnosis of dural metastasis rather than meningioma.
Leptomeningeal carcinomatosis refers to metastastic seeding of the pia arachnoid or subarachnoid space [Figure 7]. This can occur in a sheetlike or nodular pattern.[5] Common locations to be affected by leptomeningeal spread of tumors include the basilar cisterns and cerebellar folia. Leptomeningeal involvement can be difficult to detect by CT, and cytological evaluation of cerebral spinal fluid is an important component in the evaluation for leptomeningeal spread.[18]
Figure 7.
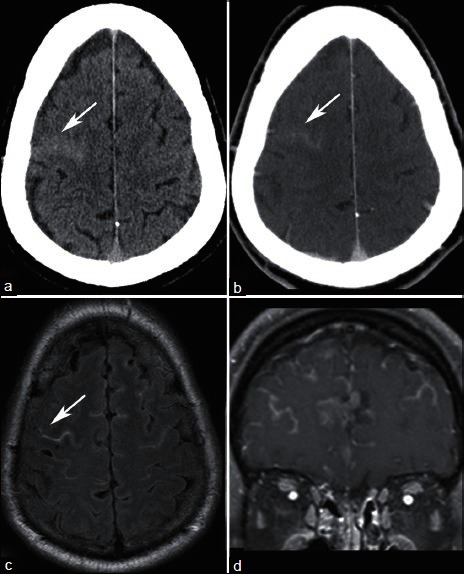
A 62-year-old with metastatic ocular melanoma who underwent staging CT. NECT demonstrates hyperdense material in a right frontal sulcus (a, arrow), which enhances (b). MRI obtained within 1 week demonstrates FLAIR hyperintense material in the subarachnoid space (c) that enhances (d), consistent with leptomeningeal carcinomatosis. Subsequent lumbar puncture confirmed malignant cells in the cerebral spinal fluid
Rarely, metastases can manifest in the ventricles [Figure 8], often in the choroid plexus.
Figure 8.
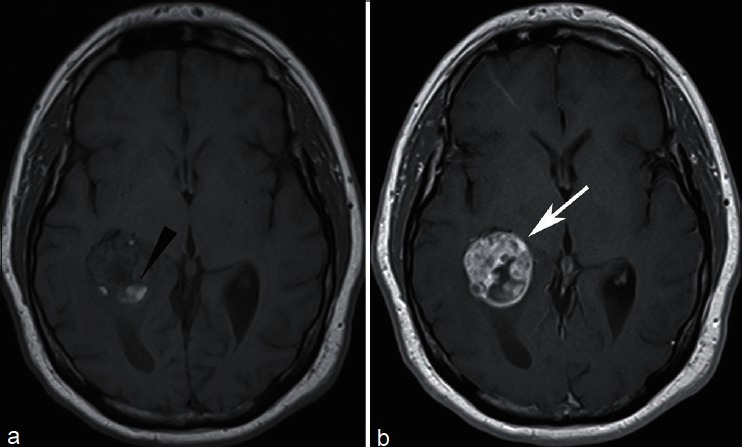
A 57-year-old with recurrent renal cell carcinoma who presented with headaches. MRI revealed a lesion in the atrium of the right lateral ventricle, with areas of intrinsic T1 signal hyperintensity consistent with hemorrhage (a, arrowhead), and marked enhancement (b). Patient underwent gamma knife radiosurgery for solitary intraventricular metastasis
SUMMARY
CT and MRI remain the primary modalities utilized for the detection of metastatic tumors of the CNS. CT is extremely useful in the setting of new neurological signs or symptoms, with or without a history of malignancy. MRI is highly sensitive for the detection of brain metastases, but currently both MRI and CECT are accepted methods of screening for brain metastases.
Advanced MRI techniques including proton spectroscopy, perfusion, DWI, and DTI have all been evaluated primarily in the context of distinguishing brain metastases from other entities such as high-grade primary glial neoplasms, CNS lymphoma, and abscess. To date, the best means of differentiating solitary metastasis from primary high-grade glioma involves evaluating the peritumeral edema of the two lesions, either by MRS, MRP, DWI, or DTI. Additionally, though any individual parameter may not accurately distinguish the two entities, careful evaluation of the imaging findings together may lead to the correct diagnosis.
While certain findings on standard and advanced imaging are suggestive of a particular diagnosis, to date imaging is not able to reliably predict the histology of a brain metastasis. As research in the area advances, and the field of molecular imaging matures, this may become feasible in the future.
Footnotes
Available FREE in open access from: http://www.surgicalneurologyint.com/text.asp?2013/4/5/209/111298
Contributor Information
Kathleen R. Fink, Email: ktozer@u.washington.edu.
James R. Fink, Email: jamesrfink@u.washington.edu.
REFERENCES
- 1.Atlas SW, Atlas SW, editors. 4th ed. Vol. 2. Philadelphia: Wolters Kluwer Health/Lippincott Williams and Wilkins; 2009. Magnetic Resonance Imaging of the Brain and Spine. [Google Scholar]
- 2.Akeson P, Larsson EM, Kristoffersen DT, Jonsson E, Holtås S. Brain metastases-comparison of gadodiamide injection-enhanced MR imaging at standard and high dose, contrast-enhanced CT and non-contrast-enhanced MR imaging. Acta Radiol. 1995;36:300–6. [PubMed] [Google Scholar]
- 3.Al-Okaili RN, Krejza J, Wang S, Woo JH, Melhem ER. Advanced MR imaging techniques in the diagnosis of intraaxial brain tumors in adults. Radiographics. 2006;26(Suppl 1):S173–89. doi: 10.1148/rg.26si065513. [DOI] [PubMed] [Google Scholar]
- 4.Balériaux D, Colosimo C, Ruscalleda J, Korves M, Schneider G, Bohndorf K, et al. Magnetic resonance imaging of metastatic disease to the brain with gadobenate dimeglumine. Neuroradiology. 2002;44:191–203. doi: 10.1007/s002340100636. [DOI] [PubMed] [Google Scholar]
- 5.Barajas RF, Cha S. Imaging diagnosis of brain metastasis. Prog Neurol Surg. 2012;25:55–73. doi: 10.1159/000331174. [DOI] [PubMed] [Google Scholar]
- 6.Bendini M, Marton E, Feletti A, Rossi S, Curtolo S, Inches I, et al. Primary and metastatic intraaxial brain tumors: prospective comparison of multivoxel 2D chemical-shift imaging (CSI) proton MR spectroscopy, perfusion MRI, and histopathological findings in a group of 159 patients. Acta Neurochir (Wien) 2011;153:403–12. doi: 10.1007/s00701-010-0833-0. [DOI] [PubMed] [Google Scholar]
- 7.Blatt DR, Friedman WA, Agee OF. Delayed computed tomography contrast enhancement patterns in biopsy proven cases. Neurosurgery. 1993;32:560–9. doi: 10.1227/00006123-199304000-00011. [DOI] [PubMed] [Google Scholar]
- 8.Bulakbasi N, Kocaoglu M, Ors F, Tayfun C, Uçöz T. Combination of single-voxel proton MR spectroscopy and apparent diffusion coefficient calculation in the evaluation of common brain tumors. AJNR Am J Neuroradiol. 2003;24:225–33. [PMC free article] [PubMed] [Google Scholar]
- 9.Byrnes TJ, Barrick TR, Bell BA, Clark CA. Diffusion tensor imaging discriminates between glioblastoma and cerebral metastases in vivo. NMR Biomed. 2011;24:54–60. doi: 10.1002/nbm.1555. [DOI] [PubMed] [Google Scholar]
- 10.Calli C, Kitis O, Yunten N, Yurtseven T, Islekel S, Akalin T. Perfusion and diffusion MR imaging in enhancing malignant cerebral tumors. Eur J Radiol. 2006;58:394–403. doi: 10.1016/j.ejrad.2005.12.032. [DOI] [PubMed] [Google Scholar]
- 11.Cha S, Lupo JM, Chen MH, Lamborn KR, McDermott MW, Berger MS, et al. Differentiation of glioblastoma multiforme and single brain metastasis by peak height and percentage of signal intensity recovery derived from dynamic susceptibility-weighted contrast-enhanced perfusion MR imaging. AJNR Am J Neuroradiol. 2007;28:1078–84. doi: 10.3174/ajnr.A0484. [DOI] [PMC free article] [PubMed] [Google Scholar]
- 12.Chen XZ, Ying XM, Ai L, Chen Q, Li SW, Dai JP. Differentiation between Brain Glioblastoma Multiforme and Solitary Metastasis: Qualitative and Quantitative Analysis Based on Routine MR Imaging. AJNR Am J Neuroradiol. 2012;33:1907–12. doi: 10.3174/ajnr.A3106. [DOI] [PMC free article] [PubMed] [Google Scholar]
- 13.Chiang IC, Kuo YT, Lu CY, Yeung KW, Lin WC, Sheu FO, et al. Distinction between high-grade gliomas and solitary metastases using peritumoral 3-T magnetic resonance spectroscopy, diffusion, and perfusion imagings. Neuroradiology. 2004;46:619–27. doi: 10.1007/s00234-004-1246-7. [DOI] [PubMed] [Google Scholar]
- 14.Davis PC, Hudgins PA, Peterman SB, Hoffman JC. Diagnosis of cerebral metastases: Double-dose delayed CT vs contrast-enhanced MR imaging. AJNR Am J Neuroradiol. 1991;12:293–300. [PMC free article] [PubMed] [Google Scholar]
- 15.Delattre JY, Krol G, Thaler HT, Posner JB. Distribution of brain metastases. Arch Neurol. 1988;45:741–4. doi: 10.1001/archneur.1988.00520310047016. [DOI] [PubMed] [Google Scholar]
- 16.Duygulu G, Ovali GY, Calli C, Kitis O, Yünten N, Akalin T, et al. Intracerebral metastasis showing restricted diffusion: correlation with histopathologic findings. Eur J Radiol. 2010;74:117–20. doi: 10.1016/j.ejrad.2009.03.004. [DOI] [PubMed] [Google Scholar]
- 17.Fan G, Sun B, Wu Z, Guo Q, Guo Y. In vivo single-voxel proton MR spectroscopy in the differentiation of high-grade gliomas and solitary metastases. Clin Radiol. 2004;59:77–85. doi: 10.1016/j.crad.2003.08.006. [DOI] [PubMed] [Google Scholar]
- 18.Ginaldi S, Wallace S, Shalen P, Luna M, Handel S. Cranial computed tomography of malignant melanoma. AJR Am J Roentgenol. 1981;136:145–9. doi: 10.2214/ajr.136.1.145. [DOI] [PubMed] [Google Scholar]
- 19.Grossman ZD. Cost-effective diagnostic imaging: The clinician's guide. 4th ed. Philadelphia, Pa: Mosby; 2006. [Google Scholar]
- 20.Hakyemez B, Erdogan C, Bolca N, Yildirim N, Gokalp G, Parlak M. Evaluation of different cerebral mass lesions by perfusion-weighted MR imaging. J Magn Reson Imaging. 2006;24:817–24. doi: 10.1002/jmri.20707. [DOI] [PubMed] [Google Scholar]
- 21.Hakyemez B, Erdogan C, Gokalp G, Dusak A, Parlak M. Solitary metastases and high-grade gliomas: Radiological differentiation by morphometric analysis and perfusion-weighted MRI. Clin Radiol. 2010;65:15–20. doi: 10.1016/j.crad.2009.09.005. [DOI] [PubMed] [Google Scholar]
- 22.Hayashida Y, Hirai T, Morishita S, Kitajima M, Murakami R, Korogi Y, et al. Diffusion-weighted imaging of metastatic brain tumors: Comparison with histologic type and tumor cellularity. AJNR Am J Neuroradiol. 2006;27:1419–25. [PMC free article] [PubMed] [Google Scholar]
- 23.Healy ME, Hesselink JR, Press GA, Middleton MS. Increased detection of intracranial metastases with intravenous Gd-DTPA. Radiology. 1987;165:619–24. doi: 10.1148/radiology.165.3.3317496. [DOI] [PubMed] [Google Scholar]
- 24.Hollingworth W, Medina LS, Lenkinski RE, Shibata DK, Bernal B, Zurakowski D, et al. A systematic literature review of magnetic resonance spectroscopy for the characterization of brain tumors. AJNR Am J Neuroradiol. 2006;27:1404–11. [PMC free article] [PubMed] [Google Scholar]
- 25.Hwang TL, Close TP, Grego JM, Brannon WL, Gonzales F. Predilection of brain metastasis in gray and white matter junction and vascular border zones. Cancer. 1996;77:1551–5. doi: 10.1002/(SICI)1097-0142(19960415)77:8<1551::AID-CNCR19>3.0.CO;2-Z. [DOI] [PubMed] [Google Scholar]
- 26.Ishimaru H, Morikawa M, Iwanaga S, Kaminogo M, Ochi M, Hayashi K. Differentiation between high-grade glioma and metastatic brain tumor using single-voxel proton MR spectroscopy. Eur Radiol. 2001;11:1784–91. doi: 10.1007/s003300000814. [DOI] [PubMed] [Google Scholar]
- 27.Kaal EC, Taphoorn MJ, Vecht CJ. Symptomatic management and imaging of brain metastases. J Neurooncol. 2005;75:15–20. doi: 10.1007/s11060-004-8094-5. [DOI] [PubMed] [Google Scholar]
- 28.Kremer, Grand, Berger, Hoffmann, Pasquier, Rémy, et al. Dynamic contrast-enhanced MRI: differentiating melanoma and renal carcinoma metastases from high-grade astrocytomas and other metastases. Neuroradiology. 2003;45:44–9. doi: 10.1007/s00234-002-0886-8. [DOI] [PubMed] [Google Scholar]
- 29.Krüger S, Mottaghy FM, Buck AK, Maschke S, Kley H, Frechen D, et al. Brain metastasis in lung cancer.Comparison of cerebral MRI and 18F-FDG-PET/CT for diagnosis in the initial staging. Nuklearmedizin. 2011;50:101–6. doi: 10.3413/Nukmed-0338-10-07. [DOI] [PubMed] [Google Scholar]
- 30.Law M, Cha S, Knopp EA, Johnson G, Arnett J, Litt AW. High-grade gliomas and solitary metastases: Differentiation by using perfusion and proton spectroscopic MR imaging. Radiology. 2002;222:715–21. doi: 10.1148/radiol.2223010558. [DOI] [PubMed] [Google Scholar]
- 31.Lee EJ, terBrugge K, Mikulis D, Choi DS, Bae JM, Lee SK, et al. Diagnostic value of peritumoral minimum apparent diffusion coefficient for differentiation of glioblastoma multiforme from solitary metastatic lesions. AJR Am J Roentgenol. 2011;196:71–6. doi: 10.2214/AJR.10.4752. [DOI] [PubMed] [Google Scholar]
- 32.Lu S, Ahn D, Johnson G, Cha S. Peritumoral diffusion tensor imaging of high-grade gliomas and metastatic brain tumors. AJNR Am J Neuroradiol. 2003;24:937–41. [PMC free article] [PubMed] [Google Scholar]
- 33.Marom EM, McAdams HP, Erasmus JJ, Goodman PC, Culhane DK, Coleman RE, et al. Staging non-small cell lung cancer with whole-body PET. Radiology. 1999;212:803–9. doi: 10.1148/radiology.212.3.r99se21803. [DOI] [PubMed] [Google Scholar]
- 34.McGann GM, Platts A. Computed tomography of cranial metastatic malignant melanoma: Features, early detection and unusual cases. Br J Radiol. 1991;64:310–3. doi: 10.1259/0007-1285-64-760-310. [DOI] [PubMed] [Google Scholar]
- 35.Meyer PC, Reah TG. Secondary neoplasms of the central nervous system and meninges. Br J Cancer. 1953;7:438–48. doi: 10.1038/bjc.1953.44. [DOI] [PMC free article] [PubMed] [Google Scholar]
- 36.Nadal Desbarats L, Herlidou S, de Marco G, Gondry-Jouet C, Le Gars D, Deramond H, et al. Differential MRI diagnosis between brain abscesses and necrotic or cystic brain tumors using the apparent diffusion coefficient and normalized diffusion-weighted images. Magn Reson Imaging. 2003;21:645–50. doi: 10.1016/s0730-725x(03)00084-5. [DOI] [PubMed] [Google Scholar]
- 37.Nagai A, Shibamoto Y, Mori Y, Hashizume C, Hagiwara M, Kobayashi T. Increases in the number of brain metastases detected at frame-fixed, thin-slice MRI for gamma knife surgery planning. Neuro Oncol. 2010;12:1187–92. doi: 10.1093/neuonc/noq084. [DOI] [PMC free article] [PubMed] [Google Scholar]
- 38.Nakase H, Sakaki T, Fujita T, Tsunoda S, Nakamura M, Imai T, et al. Multiple calcified metastatic brain tumor--case report. Neurol Med Chir (Tokyo) 1991;31:787–91. doi: 10.2176/nmc.31.787. [DOI] [PubMed] [Google Scholar]
- 39.Ohno Y, Koyama H, Nogami M, Takenaka D, Yoshikawa T, Yoshimura M, et al. Whole-body MR imaging vs.FDG-PET: Comparison of accuracy of M-stage diagnosis for lung cancer patients. J Magn Reson Imaging. 2007;26:498–509. doi: 10.1002/jmri.21031. [DOI] [PubMed] [Google Scholar]
- 40.Osborn AG. Diagnostic imaging: Brain. Volume 2 of Diagnostic Imaging Series. illustrated ed. Salt Lake City, Utah: Amirsys; 2004. [Google Scholar]
- 41.Potts DG, Abbott GF, von Sneidern JV. National Cancer Institute study evaluation of computed tomography in the diagnosis of intracranial neoplasms. III. Metastatic tumors. Radiology. 1980;136:657–64. doi: 10.1148/radiology.136.3.7403544. [DOI] [PubMed] [Google Scholar]
- 42.Rohren EM, Provenzale JM, Barboriak DP, Coleman RE. Screening for cerebral metastases with FDG PET in patients undergoing whole-body staging of non-central nervous system malignancy. Radiology. 2003;226:181–7. doi: 10.1148/radiol.2261010920. [DOI] [PubMed] [Google Scholar]
- 43.Runge VM, Kirsch JE, Burke VJ, Price AC, Nelson KL, Thomas GS, et al. High-dose gadoteridol in MR imaging of intracranial neoplasms. J Magn Reson Imaging. 1992;2:9–18. doi: 10.1002/jmri.1880020103. [DOI] [PubMed] [Google Scholar]
- 44.Schellinger PD, Meinck HM, Thron A. Diagnostic accuracy of MRI compared to CCT in patients with brain metastases. J Neurooncol. 1999;44:275–81. doi: 10.1023/a:1006308808769. [DOI] [PubMed] [Google Scholar]
- 45.Server A, Josefsen R, Kulle B, Maehlen J, Schellhorn T, Gadmar Ø, et al. Proton magnetic resonance spectroscopy in the distinction of high-grade cerebral gliomas from single metastatic brain tumors. Acta Radiol. 2010;51:316–25. doi: 10.3109/02841850903482901. [DOI] [PubMed] [Google Scholar]
- 46.Shalen PR, Hayman LA, Wallace S, Handel SF. Protocol for delayed contrast enhancement in computed tomography of cerebral neoplasia. Radiology. 1981;139:397–402. doi: 10.1148/radiology.139.2.7220885. [DOI] [PubMed] [Google Scholar]
- 47.Sidhu KP, Cooper P, Ramani R, Schwartz M, Franssen E, Davey P. Delineation of brain metastases on CT images for planning radiosurgery: Concerns regarding accuracy. Br J Radiol. 2004;77:39–42. doi: 10.1259/bjr/68080920. [DOI] [PubMed] [Google Scholar]
- 48.Silvestri GA, Gould MK, Margolis ML, Tanoue LT, McCrory D, Toloza E, et al. Noninvasive staging of non-small cell lung cancer: ACCP evidenced-based clinical practice guidelines (2nd edition) Chest. 2007;132(3 Suppl):178S–201. doi: 10.1378/chest.07-1360. [DOI] [PubMed] [Google Scholar]
- 49.Soffietti R, Cornu P, Delattre JY, Grant R, Graus F, Grisold W, et al. EFNS Guidelines on diagnosis and treatment of brain metastases: Report of an EFNS Task Force. Eur J Neurol. 2006;13:674–81. doi: 10.1111/j.1468-1331.2006.01506.x. [DOI] [PubMed] [Google Scholar]
- 50.Sze G, Krol G, Olsen WL, Harper PS, Galicich JH, Heier LA, et al. Hemorrhagic neoplasms: MR mimics of occult vascular malformations. AJR Am J Roentgenol. 1987;149:1223–30. doi: 10.2214/ajr.149.6.1223. [DOI] [PubMed] [Google Scholar]
- 51.Sze G, Shin J, Krol G, Johnson C, Liu D, Deck MD. Intraparenchymal brain metastases: MR imaging versus contrast-enhanced CT. Radiology. 1988;168:187–94. doi: 10.1148/radiology.168.1.3380956. [DOI] [PubMed] [Google Scholar]
- 52.Tsuchiya K, Fujikawa A, Nakajima M, Honya K. Differentiation between solitary brain metastasis and high-grade glioma by diffusion tensor imaging. Br J Radiol. 2005;78:533–7. doi: 10.1259/bjr/68749637. [DOI] [PubMed] [Google Scholar]
- 53.Wang S, Kim S, Chawla S, Wolf RL, Knipp DE, Vossough A, et al. Differentiation between glioblastomas, solitary brain metastases, and primary cerebral lymphomas using diffusion tensor and dynamic susceptibility contrast-enhanced MR imaging. AJNR Am J Neuroradiol. 2011;32:507–14. doi: 10.3174/ajnr.A2333. [DOI] [PMC free article] [PubMed] [Google Scholar]
- 54.Williams RL, Meltzer CC, Smirniotopoulos JG, Fukui MB, Inman M. Cerebral MR imaging in intravascular lymphomatosis. AJNR Am J Neuroradiol. 1998;19:427–31. [PMC free article] [PubMed] [Google Scholar]
- 55.Yamamoto A, Kikuchi Y, Homma K, O’uchi T, Furui S. Characteristics of intravascular large B-cell lymphoma on cerebral MR imaging. AJNR Am J Neuroradiol. 2012;33:292–6. doi: 10.3174/ajnr.A2770. [DOI] [PMC free article] [PubMed] [Google Scholar]
- 56.Yokoi K, Kamiya N, Matsuguma H, Machida S, Hirose T, Mori K, et al. Detection of brain metastasis in potentially operable non-small cell lung cancer: A comparison of CT and MRI. Chest. 1999;115:714–9. doi: 10.1378/chest.115.3.714. [DOI] [PubMed] [Google Scholar]
- 57.Yuh WT, Fisher DJ, Runge VM, Atlas SW, Harms SE, Maravilla KR, et al. Phase III multicenter trial of high-dose gadoteridol in MR evaluation of brain metastases. AJNR Am J Neuroradiol. 1994;15:1037–51. [PMC free article] [PubMed] [Google Scholar]


