

Abstract
Cross-bridge kinetics were studied at 20 °C in cardiac muscle strips from transgenic (Tg) mice expressing N-terminal 43 amino acid truncation mutation (Δ43) of myosin essential light chain (ELC), and the results were compared to those from Tg-wild type (WT) mice. Sinusoidal length changes were applied to activated skinned papillary muscle strips to induce tension transients, from which two exponential processes were deduced to characterize the cross-bridge kinetics. Their two rate constants were studied as functions of ATP, phosphate (Pi), ADP, and Ca2+ concentrations to characterize elementary steps of the cross-bridge cycle consisting of six states. Our results demonstrate for the first time that the cross-bridge kinetics of Δ43 are accelerated owing to an acceleration of the rate constant k2 of the cross-bridge detachment step, and that the number of strongly attached cross-bridges are decreased because of a reduction of the equilibrium constant K4 of the force generation step. The isometric tension and stiffness of Δ43 are diminished compared to WT, but the force per cross-bridge is not changed. Stiffness measurement during rigor induction demonstrates a reduction in the stiffness in Δ43, indicating that the N-terminal extension of ELC forms an extra linkage between the myosin cross-bridge and actin. The tension-pCa study demonstrates tht there is no Ca2+ sensitivity change with Δ43, but the cooperativity is diminished. These results demonstrate the importance of the N-terminal extension of ELC in maintaining the myosin motor function during force generation and optimal cardiac performance.
Keywords: Cardiac muscle, Muscle mechanics, Elementary steps, Sinusoidal analysis, Cross-bridge cycle, Cardiomyopathy, Cross-bridge kinetics, Tension transients, Rate constants
Introduction
Muscle contraction is vital for vertebrate locomotion. Myosin II is a well-known dimeric motor protein located in muscle cells, and converts chemical energy stored in ATP into mechanical work by interacting with actin-containing thin filaments. In addition to two heavy chains that form the head, neck, and tail domains, myosin II also contains two pairs of light chains called the essential light chain (ELC) and the regulatory light chain (RLC) (Weeds and Lowey 1971; Lowey and Trybus 2010). Both ELC and RLC are bound to the myosin’s neck region (Rayment et al. 1993) and play important roles in the structure and function of myosin in striated muscles (Morano 1999b; Ushakov 2008; Szczesna 2003; Hernandez et al. 2007). Vertebrate striated muscles contain two types of ELC: a long isoform (A1) and a short isoform (A2), which differ in their N-terminal domain (Hernandez et al. 2007). The A1 isoform contains a 40–45 residue-extension at the N-terminus (Buckingham et al. 1998; Timson 2003; Frank and Weeds 1974). Fast-twitch skeletal muscles express both ELC isoforms, but slow-twitch skeletal muscles and cardiac muscles express only the long isoform. The short isoform is exclusively expressed in myosin of smooth and scallop muscles (Timson 2003; Hernandez et al. 2007; Houdusse and Cohen 1996). Previous studies have demonstrated that the positively charged N-terminus (MAPKKP) of the long ELC isoform can make direct contacts with the negatively charged C-terminus of actin (Winstanley et al. 1977; Sutoh 1982; Timson et al. 1999, 1998; Milligan et al. 1990; Morano et al. 1995). The muscle strips in which the long isoform was exchanged with the short isoform exhibited significantly faster cross-bridge kinetics than those containing exclusively long isoform (Sweeney 1995). It is possible that the ELC’s N-terminal domain can modulate cross-bridge kinetics, and that any abnormalities in this region (e.g. FHC-linked A57G mutant) may contribute to pathophysiology of the heart (Muthu et al. 2011). Interestingly, in transgenic (Tg) mice lacking the N-terminal ELC extension (Δ43), a large reduction in maximal force generation was observed in papillary muscle strips from 3 and/or 7 month old Tg-Δ43 mice (Kazmierczak et al. 2009), yet the cardiac function assessed by MRI and histological examination showed no differences between Δ43 and wild type mice (Muthu et al. 2011; Kazmierczak et al. 2009). As mice aged, Δ43 hearts were significantly hypertrophied while those of WT mice showed no age-dependent change (Muthu et al. 2011; Kazmierczak et al. 2009).
In our previous study (Muthu et al. 2011), we reported the basic data on ELC Δ43 mutant fibre mechanics, which included equilibrium constants. In this report, we further studied the rate constant of the elementary steps of the cross-bridge cycle in ELC Δ43. Papillary muscle strips from Tg-WT mice (Kazmierczak et al. 2009) carrying the full length human ventricular ELC were used as controls. The experimental method included small amplitude (0.125 %) sinusoidal length changes at varying frequencies, and analysis of the concomitant tension transients (time course) with two exponential processes. The study of the effects of MgATP, phosphate (Pi), and MgADP on the exponential processes enabled us to characterize the elementary steps of the cross-bridge cycle with six states, and provided rate and association constants of all elementary steps. We found that: (1) isometric tension and stiffness slightly decreased in Δ43 due to a decrease in the number of attached cross-bridges but not the tension in each cross-bridge; (2) cross-bridge kinetics accelerated in the mutant owing to an acceleration of the cross-bridge detachment step.
Materials and methods
Preparation of muscle strips
Tg mice (Δ43 and WT) were generated previously at the University of Miami Miller School of Medicine (Muthu et al. 2011; Kazmierczak et al. 2009), in accordance with institutional guidelines and protocols approved by the Animal Care and Use Committee (ACUC). The University of Miami has an Animal Welfare Assurance (A-3224-01, effective July 11, 2007) on file with the Office of Laboratory Animal Welfare (OLAW), National Institutes of Health. The sequence comparison of murine and human cardiac ELC isoforms as well as the truncation mutant (Δ43) are presented (Kazmierczak et al. 2009). In this report we used papillary muscle strips from Tg-WT and Tg-Δ43 mice, which express the human ventricle wild type ELC and the 43-amino-acid N-terminal ELC deletion mutant, respectively (Kazmierczak et al. 2009). The information on these two mouse models is listed in Table 1. Since no significant differences in results were found between different animal lines and ages of the WT mouse model, all results for WT lines were averaged.
Table 1.
Information of the transgenic mouse models used in the current study
| Mouse model | Line | Tg expression (%) | Age (mo) |
|---|---|---|---|
| WT | L3 | 36 | 2.1 |
| L3 | 36 | 7.6 | |
| L3 | 36 | 7.6 | |
| L4 | 71 | 2.7 | |
| L4 | 71 | 6.4 | |
| L4 | 71 | 7.0 | |
| L4 | 71 | 7.6 | |
| L4 | 71 | 8.0 | |
| Δ43 | L8 | 34–39 | 5.2 |
| L8 | 34–39 | 10.9 |
Muscle bundles were prepared as described previously (Muthu et al. 2011). Briefly, after euthanasia, the hearts were quickly removed from the mice and rinsed with ice-cold 0.9 % NaCl. Papillary muscle bundles ~1 mm in diameter and ~2.5 mm in length were dissected from the left ventricle in ice-cold solution that contained 10−8 MCa2+, 1 mM Mg2+, 7 mM EGTA, 2.5 mM MgATP2−, 15 mM creatine phosphate (Na2CP), 30 mM BDM, 15 % glycerol, 20 mM MOPS, ionic strength (IS) adjusted to 150 mM with K propionate, and pH adjusted to 7.0. After dissection, the bundles were transferred to the same solution mixed with 50 % glycerol (“storage solution”), and incubated for 1 h on ice. Then the bundles were transferred to fresh storage solution mixed with 1 % Triton X-100 for 24 h at 4 °C. The bundles were finally transferred to a fresh storage solution, kept at −20 °C, and shipped on ice to the Kawai lab in Iowa. Muscle bundles were subjected to mechanical studies between 2 days and 6 weeks after the shipment.
Experimental procedure
On the day of the experiment, cardiac muscle strips about 1 mm in length and 100 μm in diameter were dissected from a glycerinated muscle bundle and mounted on the experimental apparatus by attaching their ends to two stainless-steel hooks with a small amount of nail polish. One hook was connected to a length driver, and the other to a tension transducer. Strips were then soaked in the relaxing solution containing (in mM) K2H2EGTA 6, Na2H2ATP 7, H1.5K1.5Pi 8, MgAc2 2, NaAc 41, KAc 70.5, MOPS 10 (Ac = acetate and Pi = phosphate) for a few minutes followed by 20 min skinning in the same solution containing 1 % Triton X-100. Then the strips were washed again in the relaxing solution and their length was adjusted to remove the slack. This procedure resulted in sarcomere length (SL) of 2.1–2.2 μm as judged by the first order optical diffraction using He–Ne laser (wavelength: 0.6328 μm). Generally, the diffraction pattern at this SL was poor and/or not visible, but greatly improved at longer SL (2.5–4.0 μm). This is because the I-band width becomes more significant at SL 2.5 μm than at 2.1 μm, hence there is a good difference in the refractive index across the length of the sarcomere. At SL 2.1 μm, the I band width approaches 0, hence there is little change in refractive index across the length of the sarcomere, which results in a disappearance of the diffraction pattern (Eqs. 16 and 19 of Kawai and Kuntz 1973: Cn and In approach 0; n = 1, 2, 3, …). Consequently, the poor diffraction pattern at 2.1 μm SL does not reflect the quality of the muscle strips. Extrapolation along the linear relationship between SL and the muscle length allowed us to determine the initial SL, which was 2.16 ± 0.03 μm (±SE, n = 6) for WT, 2.14 ± 0.05 μm (n = 6) for Δ43, and 2.11 ± 0.06 μm (n = 7) for non transgenic mouse strips. These values were not significantly different from each other, and their average value was 2.13 ± 0.03 μm (n = 19). The strip length (L0) and the cross-sectional area were also recorded at this SL.
To characterize the kinetic constants of the elementary steps (based on the six-state cross-bridge model as presented in Scheme 1), each strip was tested in the standard activating solution (Fig. 1a) containing (in mM) K2CaE-GTA 6, Na2H2ATP 6.1, Na2CP 15, H1.5K1.5Pi 8, MgAc2 6.6, NaAc 12.8, KAc 53.5, KCl 12, KOH 17.5, MOPS 10 and creatine kinase (CK) 160 U/ml, followed by studies of pCa (7.0–4.55), MgATP (S: 0.05–10 mM), Pi (P: 0–30 mM), and MgADP (D: 0–3 mM) as shown in Fig. 1. Solutions of the pCa study (Fig. 1b) were created by taking the proper ratio [K2CaEGTA]:[K2H2EGTA] for each pCa, and by keeping the total [EGTA] at 6 mM. Solutions for ATP (Fig. 1c) and Pi (Fig. 1d) studies contained the same ingredients as the standard activating solution, except for the changed [ATP] and [Pi], respectively. Solutions for ADP study (0D–3D) contained 2 mM ATP, 10 mM NaN3, and 0.1 mM A2P5 (P1,P5-di(adenosine-5′) pentaphosphate, Li3 salt), but no Na2CP (Fig. 1e). 00D contained 15 mM Na2CP and 160 U/ml CK, but no ADP or A2P5. All solutions were adjusted to pH 7.00 ± 0.02, IS to 200 mM, and contained 1 mM Mg2+ and 160 U/ml CK. pCa of these solutions was ~4.55, except for those of the pCa study. The composition of the standard activating solution, the 5S solution (that contains 5 mM MgATP) in the ATP study, and the 8P solution (that contains 8 mM Pi) in the Pi study were the same. Hence, the results were averaged to generate the data for the standard activation and listed in Table 2. After these studies, the standard activation was repeated to measure the tension reproducibility (Fig. 1f). Rigor solution (mM: 8 K1.5H1.5Pi, 55 NaAc, 122 KAc, and 10 MOPS) was applied twice after the standard activation to induce the rigor state and stiffness was measured at 100 Hz (Fig. 1f). All experiments were performed at 20 °C.
Scheme 1.
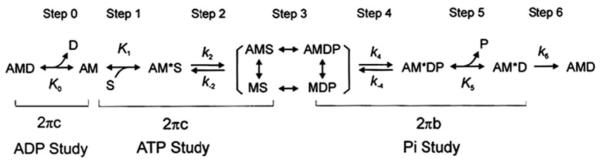
Cross-bridge model showing elementary steps of the cross-bridge cycle in striated muscle fibers. This model was used to derive Eqs. 2–4 and to interpret our results
Fig. 1.

Examples of pen traces demonstrating experimental procedures. In all panels, each muscle strip was initially in the relaxing solution, activated with the standard solution (in a) or with sequential solutions (b–f), and it was relaxed again in the end (two solution changes). Each strip was tested in the standard activating solution at the beginning (in a) and in the end (in f). In f, rigor solution was applied twice following the standard activation. b pCa study (pCa values are, from left to right: <8, 7.0, 6.2, 5.8, 5.7, 5.65, 5.55, 5.5, 5.4, 5.2, 4.8, and 4.55); c ATP study (S = 0.05, 0.1, 0.2, 0.5, 1, 2, 5, and 10 mM); d Pi study (P = 0, 2, 4, 8, 16, and 30 mM); e ADP study (00D, then D = 0, 1, 2, 3 mM). The 00D solution contains CP and CK, but no A2P5 (Table 1). In d and e, the same solution was applied twice each time. The tension signal was filtered by a second order low pass filter (cut off: 10 Hz) before traced by the Beckmann pen recorder
Table 2.
Tension, stiffness and kinetic constants in two muscle models (numbers in parentheses are the 95 % confidence ranges based on all the data points)
| Parameters (unit) | WT | n | Δ43 | n | |
|---|---|---|---|---|---|
| pCa study | nH (–) | 7.0 ± 0.3 | 20 | 5.8 ± 0.4* | 8 |
| pCa50 (–) | 5.552 ± 0.011 | 5.562 ± 0.021 | |||
| Standard activation | Tension (kPa) | 10.2 ± 0.6 | 70 | 8.9 ± 0.9 | 23 |
| Stiffness (kPa) | 323 ± 24 | 265 ± 27 | |||
| 2πb (s−1) | 62 ± 2 | 60 ± 6 | |||
| 2πc (s−1) | 172 ± 8 | 189 ± 20 | |||
| Magnitude B (kPa) | 291 ± 38 | 172 ± 25((*)) | |||
| Magnitude C (kPa) | 500 ± 49 | 353 ± 35((*)) | |||
| Rigor | Stiffness (kPa) | 506 ± 30 | 64 | 473 ± 52 | 23 |
| ADP study | KO (mM−1) | 37 ± 2.6 (4.9) | 39 | 37 ± 2.9 (8.0) | 18 |
| D0 (mM) | 0.28 ± 0.05 (0.04) | 0.22 ± 0.02 (0.05) | |||
| ATP study | K1 (mM−1) | 5.9 ± 0.5 (0.8) | 47 | 4.2 ± 0.3((*)) (0.9) | 17 |
| K2 (–) | 4.4 ± 0.4 (1.1) | 5.5 ± 1.0 (4.6) | |||
| k2 (s−1) | 141 ± 7 (16) | 174 ± 16* (25) | |||
| k−2 (s−1) | 35 ± 3 (12) | 39 ± 6 (19) | |||
| Pi study | K4 (–) | 0.34 ± 0.02 (0.05) | 31 | 0.24 ± 0.03* (0.09) | 17 |
| K5 (mM−1) | 0.066 ± 0.005 (0.014) | 0.051 ± 0.012 (0.023) | |||
| k4 (s−1) | 113 ± 6 (21) | 98 ± 14 (42) | |||
| k−4 (s−1) | 372 ± 19 (67) | 443 ± 48((*)) (143) | |||
| T5 (kPa) | 22 ± 2 (1.2) | 21 ± 3 (2.0) |
P ≤ 0.05;
0.05 < P < 0.1
Sinusoidal analysis
At the tension plateau, the muscle length was oscillated with digitally synthesized sine waves of 17 frequencies (f: 0.5–135 Hz) at a small amplitude (0.125 % of L0). This frequency range corresponds to 1.2–320 ms in time domain analysis. The experiments were controlled by a 386 computer equipped with a 16 bit digital-to-analog converter, the signal from which moved the length driver. Both tension and length time courses were simultaneously digitized with two 16 bit analog-to digital converters and recorded by the same computer. The complex modulus data Y(f) were calculated as the ratio of stress change to strain change at each frequency. Y(f) was fitted to Eq. 1 and the parameters (2πb, B, 2πc and C, H) of two exponential processes B and C were extracted (Kawai and Brandt 1980; Wannenburg et al. 2000).
| (1) |
where 2πb (rate constant of the delayed tension) and 2πc (rate constant of fast tension recovery) are the apparent rate constants of processes B and C, respectively. B and C are their respective magnitudes (amplitudes), and H is a constant that represents the elastic modulus at zero frequency. The elastic modulus extrapolated to infinite (∞) frequency is defined as Y∞ = H − B + C, where Y∞ corresponds to phase 1 of step analysis. Y∞ is loosely called “stiffness” in muscle mechanics literature. Process B corresponds to phase 3 in step analysis, which is a medium frequency-exponential delay when the muscle generates oscillatory work. Process C corresponds to phase 2, which is a high-frequency, exponential advance when muscle absorbs work. These parameters were studied as functions of [MgATP], [Pi], and [MgADP] to deduce the kinetic constants of the cross-bridge cycle, as depicted in Scheme 1. A detailed description of the sinusoidal analysis method was published previously (Kawai and Brandt 1980), and its application to characterize the elementary steps of the cross-bridge cycle (Kawai and Halvorson 1991).
Myofilament proteins’ phosphorylation level
Myofibrillar proteins were isolated using F60 buffer (60 mM KCl, 30 mM imidazole, 2 mM MgCl2, pH 7.0), containing one protease inhibitor cocktail tablet (Roche Applied Science, Cat # 04693159001) in every 10 ml. Proteins in papillary muscle strips were separated by 4–15 % precast polyacrylamide gels (#456-1086S, Biorad), electrophoresed for 25 min at 80 volts followed by 25 min at 180 volts and stained for 1 h with Pro-Q Diamond stain (Molecular Probes, USA, Cat # MPM33306) for phosphoproteins according to the manufacturer’s instructions. Subsequently, gels were stained overnight with fluorescent Sypro Ruby stain (Molecular Probes, USA, Cat # MPM33306) for the total proteins. Gels were scanned with Typhoon Variable Mode Imager instrument 8610 (Amersham Biosciences, USA) and images were analyzed by ImageJ software to determine the density of protein bands: myosin binding protein-C (cMyBP-C), troponin T (cTnT), troponin I (cTnI), and myosin regulatory light chain (cRLC).
Statistics
All the data are expressed as mean ± SE. Two samples t test was applied to determine the significance of the differences between WT and mutant Δ43 muscle preparations with Originlab 7.5 software. A significant difference was defined as 0.01 < P ≤ 0.05, and a highly significant difference as P ≤ 0.01.
Results
The purpose of this study was to determine the effect of the N-terminal ELC truncation on the kinetics of the actomyosin interaction. The elementary steps of the cross-bridge cycle were deduced using skinned papillary muscle strips from Tg mice expressing the 43 amino acid truncation ELC mutant, and the results were compared to Tg mice expressing the human ELC WT. We noticed that there were no significant differences between two different mouse lines of the Δ43 model. Among different lines/ages of mice of the WT model, we saw slight differences in a few of the parameters we measured. However, their differences were not systematic and likely caused by individual variations, hence all the results obtained for two lines of the WT mouse model were averaged.
Tension-pCa study
The tension-pCa relationship was studied in the solution containing same ingredients as the standard activating solution, except that [Ca2+] was changed. The results were normalized and plotted in Fig. 2a. As shown in this figure, Δ43 model and WT model strips exhibited nearly identical tension-pCa plots. These results were fitted to the standard Hill equation, and the fitted parameters are listed in Table 2. The pCa50 (Ca2+ sensitivity) of Δ43 was 5.562 ± 0.021 and just about the same as that of WT (5.552 ± 0.011). nH (cooperativity) of Δ43 was 5.8 ± 0.4 and significantly less than that of WT (7.0 ± 0.3). Rate constants 2πb and 2πc are plotted in Fig. 2b, c as functions of pCa. 2πb increased with an increase in [Ca2+] and reached a peak at pCa 5.4, which is at ~70 % P0, where P0 is the maximum tension). 2πb then decreased slightly for further increase in [Ca2+], but this decrease was not statistically significant. The 2πb–pCa relationship was the same between Δ43 and WT. 2πc decreased when [Ca2+] increased and reached a plateau at pCa 5.4. At pCa ≤ 5.6, the 2πc value was significantly larger in Δ43 than that in WT. This comparison was made based on available pCa values (4.55, 4.8, and 5.6) which are common for both experiments, in which P < 0.05 was shown. The 2πc value at other pCa values between 5.0 and 5.4 could not be similarly tested, because the pCa values were not matched between the experiments. At pCa > 5.8, tension was less than 10 %, therefore tension transient data were noisy, and the rate constant data could not have been obtained.
Fig. 2.
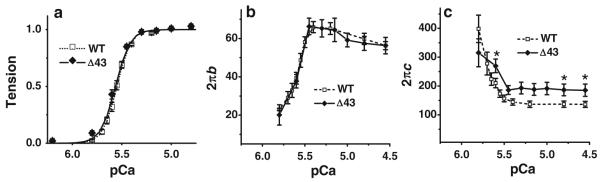
The effect of [Ca2+] on tension (in a), apparent rate constant 2πb (in b), and apparent rate constant 2πc (in c). pCa = −log10[Ca2+ is plotted in abscissa. Error bars represent SE (same in all other figures) (WT, n = 20; Δ43, n = 8)
Standard activation
The complex modulus data Y(f) derived from standard activation (Fig. 1a) are shown in Fig. 3 (discrete points). This figure includes plots of the elastic modulus versus frequency (Fig. 3a), the viscous modulus versus frequency (Fig. 3b), and the viscous modulus versus elastic modulus (Nyquist plots) (Fig. 3c) for Δ43 and WT mouse models. The complex modulus data were fitted to Eq. 1, and the apparent rate constants 2πb, 2πc, and their magnitudes were deduced (Table 2). Figure 3 also includes best-fit curves to the data based on Eq. 1 (smooth curves). From Fig. 3b we can see that there was a small right shift of the peak for the Δ43 model compared to the WT model, indicating that the cross-bridge kinetics associated with the process C in mutant muscle strips were faster than those in WT. Each Nyquist plot (Fig. 3c) shows two contiguous semicircles, hence the complex modulus could be resolved into two exponential processes B and C as shown in Eq. 1, with process C faster than process B (b < c). The complex modulus shown in Fig. 3 indicates the average of many experiments for each mouse model.
Fig. 3.
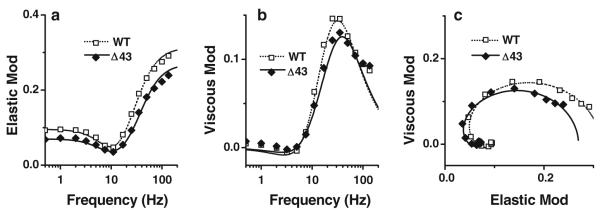
The complex modulus data averaged from the first standard activations of individual experiments. Data were plotted as a elastic modulus [= Real Y(f)] versus frequency b viscous modulus [= Imag Y(f)] versus frequency, and c viscous modulus versus elastic modulus (Nyquist plot) (WT, n = 19; Δ43, n = 23). Continuous curves represent Eq. 1 with best-fit parameters
Isometric tension, stiffness, the apparent rate constants 2πb and 2πc, and their magnitudes during standard activation are compared between two genotypes (Table 2). The isometric tension in Δ43 muscle strips was decreased by 13 % compared with WT, and the stiffness (Y∞) was reduced by 18 %, but these differences were not statistically significant. 2πb was not significantly different between WT and Δ43 models. The magnitudes B and C were somewhat smaller in Δ43 than in WT strips.
ATP study
To examine whether the kinetic constants of MgATP binding (step 1) and cross-bridge detachment (step 2) were affected by the ELC truncation, we investigated the effect of [MgATP] on the rate constant 2πc of the exponential process C (Fig. 1c). 8 mM of Pi was used in this study, so that more cross-bridges were distributed among the AM, AM*S and detached (Det) states than when [Pi] < 8 mM. Under this condition, the resolution of process C is better than in the absence of Pi, because process C primarily represents steps 0–2 (Kawai and Halvorson 1991; Kawai 1978). The apparent rate constant 2πc plotted against [MgATP2−] is shown in Fig. 4a. This relationship is hyperbolic (sigmoid in the semi log scale): 2πc increases at 1 ≤ mM [MgATP] and saturates at > 1 mM [MgATP]. The data were fitted to Eq. 2. (Eq. 3 of Kawai and Halvorson 1989), which is based on Scheme 1, where S represents [MgATP2−] (substrate: abbreviated as ATP hereafter), and D represents [MgADP1.5−] (abbreviated as ADP).
| (2) |
where D0 is the extra ADP concentration in the core of the strips. In experiments carried out with CP/CK, [ADP] < 0.6 μM; hence an approximation: K0(D + D0) ≈ 0 was used. [ADP] was calculated based on the equilibrium constant of Lohmann reaction (range: 20–217; 100 was used) (Kuby et al. 1954; Teague and Dobson 1992; Lawson and Veech 1979), creatine contamination in Na2CP (<1 %, according to manufacturer), and ADP contamination in ATP (<0.5 %, according to manufacturer). In our experiments, tension was largest at the lowest ATP concentration (0.05 mM), and decreased as the concentration of ATP increased, reaching plateau for S ≥ 1 mM (Fig. 4b).
Fig. 4.
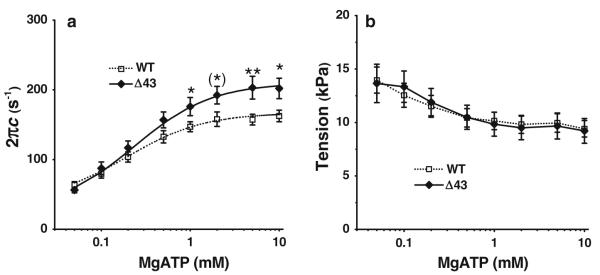
a Plots of 2πc (rate constant of process C), and b isometric tension as functions of [MgATP]. Error bars represent SE (WT, n = 8; Δ43, n = 12). The continuous curves in a represent Eq. 2 using best-fit parameters. **P ≤ 0.01 versus WT; *0.01 < P ≤ 0.05; (*) 0.05 < P ≤ 0.1 versus WT (same in all other figures)
In the ATP study 2πc was significantly larger in Δ43 than in WT, for 1 to 10 mM ATP (Fig. 4a). The [ATP] dependence of 2πc was fitted to Eq. 2, and the kinetic constants surrounding step 1 (K1) and step 2 (k2 and k−2) were deduced. These are summarized in Table 2. There was a significant increase in k2 in the Δ43 model compared with WT, but there were no statistical differences in k−2. K2 (= k2/k−2) was increased in Δ43 because of the increased k2 but the difference was not significant due to the big standard error. K1 was smaller in Δ43 than that in WT.
Pi study
To investigate the effects of the ELC truncation mutant on force generation (step 4) and Pi-release (step 5), six different [Pi] were used (0, 2, 4, 8, 16, and 30 mM), and the effects of [Pi] on the exponential processes B and C, and on the isometric tension, were studied (Fig. 1d). The sum of the two apparent rate constants, 2πb and 2πc (Fig. 5a), and isometric tension (Fig. 5b) are plotted as functions of [Pi]. These relationships are hyperbolic. The sum of the rate constants appears to be not much different in two muscle models in all concentrations of Pi (Fig. 5a). Similarly, tension generated by Δ43 strips appears to be not much different from that generated by WT strips for all [Pi] (Fig. 5b). The data were fitted to Eq. 3 (Eq. 14 in (Kawai and Halvorson 1991) and Eq. 4 (deduced from Eq. 5 of (Kawai and Zhao 1993), and Eqs. 11–13 of (Zhao and Kawai 1994)), which were derived based on cross-bridge scheme 1.
| (3) |
| (4) |
where X5 and X6 represent the probabilities of cross-bridges in the AM*DP and AM*D states, respectively, and T5 and T6 represent the tension supported by AM*DP and AM* states, respectively (T5 is the tension of the muscle strips when 100 % of cross-bridges are in the AM*DP state, and T6 is the tension of the strips when 100 % of cross-bridges are in the AM*D state). AM*DP is a collision complex between Pi and AM*D. It is assumed that T5 = T6, because the conformation of a protein cannot change instantly with formation of the collision complex, and previous data have been consistent with this assumption (Fortune et al. 1991; Kawai and Halvorson 1991; Dantzig et al. 1992; Kawai et al. 1993). k−4 and K5 were first determined by fitting the rate constant data (Fig. 5a) to Eq. 3. Then, based on K5, the tension data were fitted to Eq. 4 to determine K4 and T5 (Fig. 5b). Continuous curves represent the best fit to Eqs. 3 (Fig. 5a) and 4 (Fig. 5b). From these fittings, the kinetic constants of steps 4 and 5, and T5 were deduced and listed in Table 2.
Fig. 5.
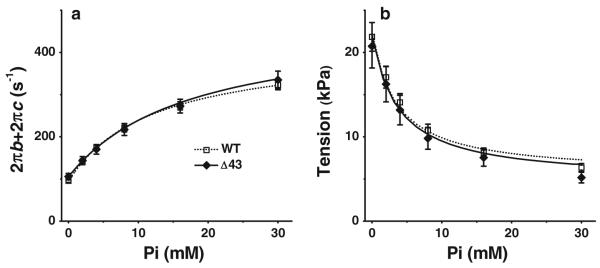
Results of the Pi study. a Plots of 2πb + 2πc, and b isometric tension as functions of [Pi]. (WT, n = 19; Δ43, n = 16). The curves in a represent Eq. 3, and the curves in b represent Eq. 4, using best-fit parameters
The tension supported by the AM*DP state (T5), which is proportional to tension/cross-bridge, was not significantly different among Δ43 (21 ± 3 kPa) and WT (22 ± 2 kPa) strips (Table 2), indicating that tension/cross-bridge was the same in the two models of muscle strips. Therefore, tension generated by Δ43 strips was not significantly different from that generated by WT strips for all tested [Pi] (Fig. 5b). K4 (= k4/k−4) of Δ43 was significantly smaller than that of WT (Table 2), and in accord to K4 reported previously (Muthu et al. 2011). In this study, we found that K4 is less in Δ43 than WT, because k4 is smaller and k−4 is larger in Δ43 than their respective values in WT (Table 2). K5 (association constant of Pi to the myosin head) was slightly less in mutant than WT, but the difference was not statistically significant.
ADP study
To characterize the association constant (K0) of ADP to cross-bridges, we studied the effect of ADP on the process C (Fig. 1e). The apparent rate constant 2πc (Fig. 6a) and tension (Fig. 6b) were plotted against [ADP] (added concentration). As seen in these plots, the rate constant 2πc decreased and the tension increased as [ADP] was increased. By fitting the data of Fig. 6a to Eq. 2, K0 was deduced. Here we used K1, k2, and k−2 derived from the ATP study, and S = 2 mM (experimental condition). The Δ43 mutant exhibited somewhat larger 2πc than WT (Fig. 6a) at low [ADP], but K0 was just about the same between Δ43 and WT models (Table 2). Tension generated at each [ADP] was not significantly different among the mutant and WT (Fig. 6b).
Fig. 6.
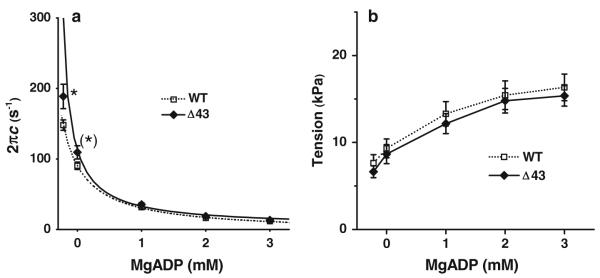
Results of the ADP study are compared for the two muscle models (WT, n = 9; Δ43, n = 18). a Plot of 2πc, and b isometric tension as functions of [MgADP]. The continuous curves in a represent Eq. 2 using best-fit parameters
During the ADP study, 00D solution (2 initial solution changes in Fig. 1e; leftmost points in Fig. 6a, b), which contained CP and CK but no A2P5 or ADP, was first applied to the strip, followed by the 0D solution, which contained no CP, CK, or ADP, but contained P1,P5-di(adenosine-5′) pentaphosphate (A2P5: adenylate kinase inhibitor). The purpose of these two solutions was to find out the extra [ADP] (D0) in the 0D–3D solutions. The source of the extra ADP is from the contamination in ATP used, and ADP liberated as a result of the hydrolysis by cross-bridges. In the 00D solution, the rate constant 2πc was significantly larger (Fig. 6a), and tension was slightly smaller (Fig. 6b) than those in the 0D solution, indicating that D0 was not negligible. Thereafter, the 1D, 2D and 3D solutions were applied sequentially. Extrapolating the 2πc data versus [ADP] (Fig. 6a, continuous curves) to the negative [ADP] allowed us to determine the extra ADP concentration in the 0D–3D solutions. D0 was 0.22 ± 0.02 mM in Δ43, and 0.28 ± 0.05 mM in WT (Table 2), which are not significantly different. This extra [ADP] was taken into consideration when deducing K0. 2πc at 00D and 0D were bigger in Δ43 than in WT. There was no difference between Δ43 and WT in the tension at each ADP concentration. Likewise, there was no difference in ADP association constant (K0) in Δ43 and WT muscle strips.
Cross-bridge distribution among six states
The cross-bridge distribution among six states in Scheme 1 was calculated based on Eqs. 7–13 of Zhao and Kawai (1994) at the standard activating condition, and the results are shown in Fig. 7. This figure also includes the sum of all strongly attached states, labeled as Att. This figure demonstrates that the largest distribution is in the detached cross-bridge state (45–50 %), followed by the AM*D state (29–30 %), the AM*DP state (12–15 %), and the AM*S state (9–10 %). The cross-bridge distribution among the AM (0.35–0.43 %) and the AMD (0.26–0.32 %) states were minimal, because of the presence of a large concentration of MgATP (5 mM), the large value of K1 (4.2–5.9 mM−1), and a small concentration of MgADP. Also included in Fig. 7 is the probability of the sum of strongly attached (force generating) myosin cross-bridges: (Att) = (AM*DP) + (AM*D) +(AMD) + (AM) + (AM*S) = 1 − (Det). When Δ43 mouse model is compared to WT, there are more cross-bridges (~5 %) distributed in the detached state, and consequently less cross-bridges (~5 %) are distributed in the strongly attached state, primarily owing to the reduction of the AM*DP state caused by the reduced K4.
Fig. 7.
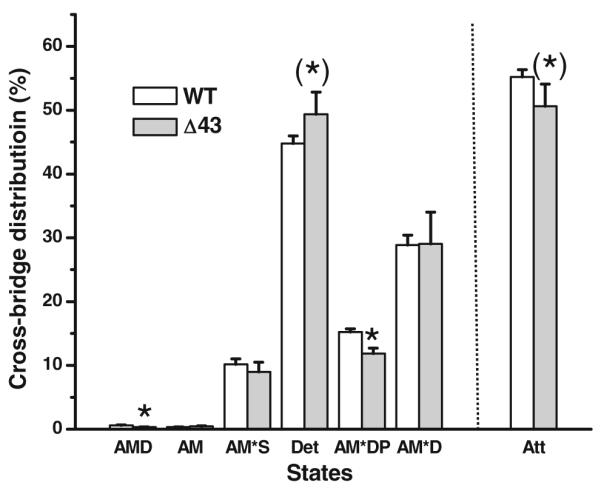
The cross-bridge distribution was calculated based on Eqs. 7–13 of Zhao and Kawai (1994) at the standard activating condition (S = 5 mM, P = 8 mM, D = 0.02 mM). Also included is Att, the sum of strongly attached states (AMD, AM, AM*S, AM*DP, and AM*D). Note that (Att) + (Det) = 1
Myofilament proteins’ phosphorylation levels
The results of SDS-PAGE stained with Pro-Q Diamond to assess protein phosphorylation and Sypro Ruby for the total protein content are shown in Fig. 8a, b. Tissues were harvested from the left ventricular papillary muscles of WT mice and those carrying the Δ43 mutation in myosin ELC. We found no difference between the phosphorylation levels of myofilament proteins cMyBP-C, cTnT, cTnI, and RLC in ventricles of WT and Δ43 mice (Fig. 8c).
Fig. 8.

The phosphorylation levels of myofilament proteins in WT and Δ43 mice. a SDS-PAGE with Pro-Q Diamond stain for assessment of protein phosphorylation. b The same gel was subsequently stained with Sypro-Ruby for the total protein concentrations. In a and b, lanes 1–4 depict papillary muscles from WT mice, lanes 5–8 from Δ43 mice, and lane 9 molecular weight markers. c The density in (a) was divided by the density in (b) for each protein (cMyBP-C, cTnT, cTnI, and RLC), and their ratio of Δ43 was divided by the ratio of WT (n = 4). A value of 1.0 indicates a protein has the same phosphorylation level in Δ43 and WT muscles. The abbreviations used are MHC myosin heavy chain, MyBP-C myosin binding protein C, Tn troponin, RLC myosin regulatory light chain, and ELC myosin essential light chain
Discussion
In the current report, we describe our investigation on myosin motor function and the cross-bridge kinetics in skinned papillary muscle strips from transgenic mice expressing ELC mutant Δ43. The Δ43 truncation mutant was generated to investigate the functional significance of the long ELC isoform (A1) and its unique N-terminal extension (Kazmierczak et al. 2009). This is the first study which comprehensively characterizes all the elementary steps of the cross-bridge cycle consisting of six states by applying sinusoidal length perturbations and by measuring the tension transients at varying concentrations of ATP, ADP and Pi. In this way, the significance of the N-terminal extension of ELC could be characterized. Our study is an extension of the earlier study (Muthu et al. 2011), in which the same mouse models were used. In this report, the ADP study has been added, the rate constants of the elementary steps have been resolved, the number of data pool has been increased, and the cross-bridge distribution has been added. Therefore, a complete picture of the cross-bridge cycle is presented in this report.
We studied the effect of Ca2+ on tension and the rate constant 2πb (Fig. 2a, b), and found that there were no significant differences between Δ43 and WT (Table 2). However, the rate constant 2πc was significantly faster in Δ43 than WT at the high level of activation (pCa ≤ 5.7) (Fig. 2c). These results indicate that the N-terminal extension of ELC does not affect the regulatory system, but affects the cross-bridge detachment step. The observation that 2πb increases and saturates by ~70 % tension in mouse papillary fibers (Fig. 2b) is similar to that of rabbit psoas fibres (Kawai et al. 1981) and the shortening velocity in frog semitendinosus fibres (Julian and Moss 1981). These results indicate that each cross-bridge is not independent, many cross-bridges work together cooperatively, and their cooperativity breaks down at a low level activation.
Compared with a previous report (Kazmierczak et al.2009), the tension (Table 2) produced in skinned muscle strips in the current study is less. This is because 200 mM ionic strength (IS) and 8 mM Pi were used in the standard activating solution, whereas 150 mM IS and no added Pi were used previously. The addition of 8 mM Pi reduces isometric tension to ~0.59× by decreasing the strongly attached cross-bridge number (Kawai and Halvorson 1991; Dantzig et al. 1992; Fortune et al. 1991) (Fig. 5b), and a 50 mM increase in IS is known to reduce isometric tension by ~0.29× by the modification of the rapid equilibrium between the detached state and the weakly attached state (Kawai et al. 1990). In addition, the sensitivity of tension and stiffness to IS may be increased by Pi (Iwamoto 2000). The higher IS and Pi are also factors causing increased cooperativity (nH) (Gordon et al. 2000), which may explain significantly larger values of nH in our study compared to previously reported, which used different solutions (lower [IS] without Pi) (Kazmierczak et al. 2009). The composition of the solution used in the current study reflects more physiological conditions because of the physiological [Pi] present in active cardiomyocytes is 4–9 mM (Opie et al.1971), 4–6 mM, in active human calf (skeletal) muscles (Roth et al. 1989), and the IS is reported to be ~215 mM in frog skeletal muscle (Godt and Maughan 1988). Our results demonstrate that the ELC’s N-terminal extension does not affect the Ca2+ sensitivity in the physiological solution (Fig. 2a, Table 2). However, the cooperativity decreased significantly with the N-terminal truncation (Table 2).
Under the standard activation, the Δ43 mutant muscle strips exhibited altered cross-bridge kinetics: in frequency plots, complex modulus plots were shifted right compared to those for WT (Fig. 3b). This observation demonstrates that the cross-bridge kinetics became faster in mutant strips than in WT (see also Fig. 4a at [MgATP] ≥ 1 mM; Fig. 2c at pCa ≤ 5.6). This shift is significant, as shown by the significant increase in 2πc in Δ43 compared to WT (Table 2). Our finding with Δ43 is consistent with the conclusion from previous studies demonstrating that skeletal muscle fibres reconstituted with only the long ELC form (A1) had a slower shortening velocity than those reconstituted with the short ELC form (A2) (Bottinelli et al. 1994; Sweeney 1995). Similar results were obtained in an in vitro motility assay (Lowey et al. 1993), suggesting that the absence of the N-terminal extension in Δ43 mice may account for increased cross-bridge kinetics relative to those determined in the Tg-WT model. Our measurements demonstrate an increase in the rate constant k2 of the cross-bridge detachment step (Table 2), accounts for this acceleration.
Isometric tension was 13 % less in the Δ43 model than in the WT model, and this result is consistent with the earlier observation (Kazmierczak et al. 2009). Possible causes of reduced tension are based on (a) a decrease in the number of force generating cross-bridges owing to the changes in the kinetic constants (b) a decrease in force/cross-bridge, and (c) a decrease in the myosin content (Kazmierczak et al. 2009). Our result demonstrating that T5 was not different between Δ43 and WT models excludes (b). T5 is force supported by the AM*DP state, which is equal to force supported by the AM*D state, and both of these are major force generating states (Fig. 7). (a) is consistent with our finding that the number of strongly attached states is less in Δ43 than WT models by ~9 % (= 1–50/55 %) (Fig. 7). If reason (c) is the solitary cause, one group of parameters (tension, stiffness) should decrease proportionately to the myosin content, whereas other group of parameters (kinetic constants) should remain the same. From our results (Table 2) we can conclude that reason (c) is not the solitary cause, but it may somewhat contribute to the results, hence (a) must be the major cause. Interestingly, stiffness measured during the standard activation was less by 18 % and after rigor induction by 7 % in Δ43 than in WT (Table 2). The reduction in stiffness during activation must be partially due to the reduction of the number of strongly attached cross-bridges (Fig. 7). The reduction in rigor stiffness suggests that the stiffness of a cross-bridge is also modified by the N-terminal truncation.
It has been hypothesized that the N-terminal domain of a long ELC may function as a “tether” between the myosin head and actin, restricting binding of myosin to actin (Kazmierczak et al. 2009; Lowey et al. 2007; Morano 1999a; Sweeney 1995). The data in this report support this hypothesis, because a removal of this sequence leads to faster cross-bridge kinetics, and reduced stiffness during activation and after rigor induction. The rigor is a static state in which the number of attached cross-bridges is maximized and no cross-bridge cycling takes place. Numerous studies indicate that, during striated muscle contraction, the N-terminus of ELC and actin may interact directly (Winstanley et al. 1977; Sutoh 1982; Henry et al.1985; Timson et al. 1999, 1998; Milligan et al. 1990; Morano et al. 1995; Miyanishi et al. 2002). It has been hypothesized that the positively charged N-terminus of the long ELC isoform (A1) makes a contact with the negatively charged C-terminus of actin (Sutoh 1982; Timson et al. 1999) and lead to alterations in force development during contraction (Morano et al. 1995; Miller et al. 2005; Ritter et al. 1999). Three-dimensional maps of vertebrate muscle thin filaments obtained by cryo EM revealed that the N-terminal extension of the ELC is in a position to make a molecular contact with the C-terminus of the actin monomer (Milligan et al. 1990). The recent structural modeling study from the Morano group (Aydt et al. 2007) depicted the N-terminal domain of ELC-A1 as a rod-like 9.1 nm-long extension that can function as a bridge between the ELC core of the myosin head and the binding site of the ELC on the actin filament. Using cryo EM in conjunction with light-scattering and fluorescence analysis, Lowey et al. (Lowey et al. 2007) demonstrated bindings of the N-terminal extension of the ELC to the SH3 domain of MHC, and subsequently to actin. Consistent with our previous investigation (Kazmierczak et al. 2009), we found decreased tension and stiffness in the Δ43 mouse model compared with WT mice. Consequently, we conclude that the stiffness of rigor cross-bridges is reduced in Δ43 by 7 % because of the lack of the N-terminal extension of ELC, and stiffness increases in WT because of the N-terminal extension that tethers actin. As a result, the reduction of the active stiffness (18 %) must be the sum of the tether (7 %) and the number of strongly attached cross-bridges (9 %). The near exact match of the sum of these numbers could be fortuitous, however, because each value is associated with measurement errors.
Magnitudes B and C are less in Δ43 than in WT (Table 2), because these are scaled with tension and represent the number of cycling cross-bridges, much like stiffness. It is conceivable that the reduced tension measured in muscle strips of Δ43 mouse model is responsible for inducing the compensatory hypertrophy observed in the hearts bearing the Δ43 truncation mutation of ELC, especially in aged mice (Muthu et al. 2011; Kazmierczak et al. 2009).
Our data on stiffness and tension are in accord with those by Micheal et al. (Michael et al. 2012) published during the revision process of this manuscript . The authors used muscle strips from 7 month old female Tg-WT and Tg-Δ43 mice, the same mouse models used in the current report. In agreement with the original study (Kazmierczak et al. 2009) and the current investigation on Tg-Δ43 mice, Micheal et al. (Michael et al. 2012) showed that the deletion of 1-43 amino acids in cardiac ELC leads to impaired tension development and decreased instantaneous stiffness parameter (ED) that is a measure of the muscle fibre stiffness due to the strain of strongly-bound cross-bridges. They concluded that a decrease in ED in Tg-Δ43 fibres is due to a decrease in the number of strongly-bound cross-bridges in Tg-Δ43 mice, the same conclusion that was reached in the current report. However, the increase in Δ43 cross-bridge kinetics observed in our study stays in apparent disagreement with their result of a mutation induced decrease in the cross-bridge detachment kinetics (Michael et al. 2012). But, their estimated rate constant of muscle length mediated cross-bridge distortion (in s−1), used as a measure of the rate of cross-bridge detachment, was only smaller in Tg-Δ43 versus Tg-WT fibres for the sarcomere length SL = 1.9 μm. This was not true for SL = 2.13 μm, the sarcomere length observed in the fibres for which our cross-bridge kinetics were determined. Despite different approaches used in both investigations, it is possible that the sarcomere length is critical to the N-terminus induced alterations in the myosin cross-bridge kinetics.
The phosphorylation status of myofilament proteins influence muscle contraction in many different ways as reviewed in Gordon et al. (2000). In this report, we found that the phosphorylation status of myofilament proteins were not significantly different between WT and Δ43, demonstrating that the changes observed in Δ43 mice cannot be attributed to the changes in the phosphorylation levels.
In summary, the current study found that the Δ43 mutation in ELC produces faster myosin cross-bridge kinetics. The Δ43 model exhibited decreased force and stiffness, but the force/cross-bridge was not changed. The number of strongly attached cross-bridges is decreased, causing a decrease in tension and stiffness. In addition, a decrease in active and rigor stiffness in Δ43 model supports the notion that the N-terminus of ELC works as a molecular tether between actin and the myosin head. We conclude that the ELC’s N-terminal domain plays a role in stabilizing myosin motor function to optimize cardiac performance, and that any structural perturbations in this region of myosin results in changes in both cross-bridge kinetics and the amount of force generated.
Acknowledgments
We thank Ana I. Rojas and Jingsheng Liang (University of Miami) for their excellent technical assistance with transgenic mice and cardiac muscle. This work was supported in part by grants from the National Institutes of Health HL070041 (M.K.); HL108343, HL071778 and HL090786 (D.S–C.); and the American Heart Association 10POST3420009 (P.M.). The content is solely the responsibility of the authors and does not necessarily reflect the official views of the National Center for Research Resources or the NIH.
Contributor Information
Li Wang, Departments of Anatomy and Cell Biology, and Internal Medicine, The University of Iowa, Iowa City, IA 52242, USA.
Priya Muthu, Department of Molecular and Cellular Pharmacology, University of Miami Miller School of Medicine, Miami, FL 33136, USA.
Danuta Szczesna-Cordary, Department of Molecular and Cellular Pharmacology, University of Miami Miller School of Medicine, Miami, FL 33136, USA.
Masataka Kawai, Departments of Anatomy and Cell Biology, and Internal Medicine, The University of Iowa, Iowa City, IA 52242, USA.
References
- Aydt EM, Wolff G, Morano I. Molecular modeling of the myosin-S1(A1) isoform. J Struct Biol. 2007;159(1):158–163. doi: 10.1016/j.jsb.2007.04.002. [DOI] [PubMed] [Google Scholar]
- Bottinelli R, Betto R, Schiaffino S, Reggiani C. Unloaded shortening velocity and myosin heavy chain and alkali light chain isoform composition in rat skeletal muscle fibres. J Physiol. 1994;478(Pt 2):341–349. doi: 10.1113/jphysiol.1994.sp020254. [DOI] [PMC free article] [PubMed] [Google Scholar]
- Buckingham M, Kelly R, Tajbakhsh S, Zammit P. The formation and maturation of skeletal muscle in the mouse: the myosin MLC1F/3F gene as a molecular model. Acta Physiol Scand. 1998;163(3):S3–S5. doi: 10.1046/j.1365-201X.1998.1630s30S3.x. [DOI] [PubMed] [Google Scholar]
- Dantzig JA, Goldman YE, Millar NC, Lacktis J, Homsher E. Reversal of the cross-bridge force-generating transition by photogeneration of phosphate in rabbit psoas muscle fibres. J Physiol. 1992;451:247–278. doi: 10.1113/jphysiol.1992.sp019163. [DOI] [PMC free article] [PubMed] [Google Scholar]
- Fortune NS, Geeves MA, Ranatunga KW. Tension responses to rapid pressure release in glycerinated rabbit muscle fibers. Proc Natl Acad Sci USA. 1991;88(16):7323–7327. doi: 10.1073/pnas.88.16.7323. [DOI] [PMC free article] [PubMed] [Google Scholar]
- Frank G, Weeds AG. The amino-acid sequence of the alkali light chains of rabbit skeletal-muscle myosin. Eur J Biochem. 1974;44(2):317–334. doi: 10.1111/j.1432-1033.1974.tb03489.x. [DOI] [PubMed] [Google Scholar]
- Godt RE, Maughan DW. On the composition of the cytosol of relaxed skeletal muscle of the frog. Am J Physiol. 1988;254(5 Pt 1):C591–C604. doi: 10.1152/ajpcell.1988.254.5.C591. [DOI] [PubMed] [Google Scholar]
- Gordon AM, Homsher E, Regnier M. Regulation of contraction in striated muscle. Physiol Rev. 2000;80(2):853–924. doi: 10.1152/physrev.2000.80.2.853. [DOI] [PubMed] [Google Scholar]
- Henry GD, Winstanley MA, Dalgarno DC, Scott GM, Levine BA, Trayer IP. Characterization of the actin-binding site on the alkali light chain of myosin. Biochim Biophys Acta. 1985;830(3):233–243. doi: 10.1016/0167-4838(85)90279-1. [DOI] [PubMed] [Google Scholar]
- Hernandez OM, Jones M, Guzman G, Szczesna-Cordary D. Myosin essential light chain in health and disease. Am J Physiol Heart Circ Physiol. 2007;292(4):H1643–H1654. doi: 10.1152/ajpheart.00931.2006. [DOI] [PubMed] [Google Scholar]
- Houdusse A, Cohen C. Structure of the regulatory domain of scallop myosin at 2 A resolution: implications for regulation. Structure. 1996;4(1):21–32. doi: 10.1016/s0969-2126(96)00006-8. [DOI] [PubMed] [Google Scholar]
- Iwamoto H. Influence of ionic strength on the actomyosin reaction steps in contracting skeletal muscle fibers. Biophys J. 2000;78(6):3138–3149. doi: 10.1016/S0006-3495(00)76850-0. doi:10.1016/S0006-3495(00)76850-0. [DOI] [PMC free article] [PubMed] [Google Scholar]
- Julian FJ, Moss RL. Effects of calcium and ionic strength on shortening velocity and tension development in frog skinned muscle fibres. J Physiol. 1981;311:179–199. doi: 10.1113/jphysiol.1981.sp013580. [DOI] [PMC free article] [PubMed] [Google Scholar]
- Kawai M. Head rotation or dissociation? A study of exponential rate processes in chemically skinned rabbit muscle fibers when MgATP concentration is changed. Biophys J. 1978;22(1):97–103. doi: 10.1016/S0006-3495(78)85473-3. doi:10.1016/S0006-3495(78)85473-3. [DOI] [PMC free article] [PubMed] [Google Scholar]
- Kawai M, Brandt PW. Sinusoidal analysis: a high resolution method for correlating biochemical reactions with physiological processes in activated skeletal muscles of rabbit, frog and crayfish. J Muscle Res Cell Motil. 1980;1(3):279–303. doi: 10.1007/BF00711932. [DOI] [PubMed] [Google Scholar]
- Kawai M, Halvorson HR. Role of MgATP and MgADP in the cross-bridge kinetics in chemically skinned rabbit psoas fibers. Study of a fast exponential process (C) Biophys J. 1989;55(4):595–603. doi: 10.1016/S0006-3495(89)82857-7. [DOI] [PMC free article] [PubMed] [Google Scholar]
- Kawai M, Halvorson HR. Two step mechanism of phosphate release and the mechanism of force generation in chemically skinned fibers of rabbit psoas muscle. Biophys J. 1991;59(2):329–342. doi: 10.1016/S0006-3495(91)82227-5. [DOI] [PMC free article] [PubMed] [Google Scholar]
- Kawai M, Kuntz ID. Optical diffraction studies of muscle fibers. Biophys J. 1973;13:857–876. doi: 10.1016/S0006-3495(73)86031-X. [DOI] [PMC free article] [PubMed] [Google Scholar]
- Kawai M, Zhao Y. Cross-bridge scheme and force per cross-bridge state in skinned rabbit psoas muscle fibers. Biophys J. 1993;65(2):638–651. doi: 10.1016/S0006-3495(93)81109-3. doi:10.1016/S0006-3495(93)81109-3. [DOI] [PMC free article] [PubMed] [Google Scholar]
- Kawai M, Cox RN, Brandt PW. Effect of Ca ion concentration on cross-bridge kinetics in rabbit psoas fibers. Evidence for the presence of two Ca-activated states of thin filament. Biophys J. 1981;35(2):375–384. doi: 10.1016/S0006-3495(81)84796-0. doi:10.1016/S0006-3495(81)84796-0. [DOI] [PMC free article] [PubMed] [Google Scholar]
- Kawai M, Wray JS, Guth K. Effect of ionic strength on crossbridge kinetics as studied by sinusoidal analysis, ATP hydrolysis rate and X-ray diffraction techniques in chemically skinned rabbit psoas fibres. J Muscle Res Cell Motil. 1990;11(5):392–402. doi: 10.1007/BF01739760. [DOI] [PubMed] [Google Scholar]
- Kawai M, Saeki Y, Zhao Y. Crossbridge scheme and the kinetic constants of elementary steps deduced from chemically skinned papillary and trabecular muscles of the ferret. Circ Res. 1993;73(1):35–50. doi: 10.1161/01.res.73.1.35. [DOI] [PubMed] [Google Scholar]
- Kazmierczak K, Xu Y, Jones M, Guzman G, Hernandez OM, Kerrick WG, Szczesna-Cordary D. The role of the N-terminus of the myosin essential light chain in cardiac muscle contraction. J Mol Biol. 2009;387(3):706–725. doi: 10.1016/j.jmb.2009.02.006. [DOI] [PMC free article] [PubMed] [Google Scholar]
- Kuby SA, Noda L, Lardy HA. Adenosinetriphosphate-creatine transphosphorylase. I. Isolation of the crystalline enzyme from rabbit muscle. J Biol Chem. 1954;209(1):191–201. [PubMed] [Google Scholar]
- Lawson JW, Veech RL. Effects of pH and free Mg2+ on the Keq of the creatine kinase reaction and other phosphate hydrolyses and phosphate transfer reactions. J Biol Chem. 1979;254(14):6528–6537. [PubMed] [Google Scholar]
- Lowey S, Trybus KM. Common structural motifs for the regulation of divergent class II myosins. J Biol Chem. 2010;285(22):16403–16407. doi: 10.1074/jbc.R109.025551. doi:10.1074/jbc.R109.025551. [DOI] [PMC free article] [PubMed] [Google Scholar]
- Lowey S, Waller GS, Trybus KM. Skeletal muscle myosin light chains are essential for physiological speeds of shortening. Nature. 1993;365(6445):454–456. doi: 10.1038/365454a0. [DOI] [PubMed] [Google Scholar]
- Lowey S, Saraswat LD, Liu H, Volkmann N, Hanein D. Evidence for an interaction between the SH3 domain and the N-terminal extension of the essential light chain in class II myosins. J Mol Biol. 2007;371(4):902–913. doi: 10.1016/j.jmb.2007.05.080. [DOI] [PMC free article] [PubMed] [Google Scholar]
- Michael JJ, Gollapudi SK, Ford SJ, Kazmierczak K, Szczesna-Cordary D, Chandra M. Deletion of 1–43 amino acids in cardiac myosin essential light chain blunts length dependency of Ca2+ sensitivity and crossbridge detachment kinetics. Am J Physiol Heart Circ Physiol. 2012 doi: 10.1152/ajpheart.00572.2012. doi:10.1152/ajpheart.00572.2012. [DOI] [PMC free article] [PubMed] [Google Scholar]
- Miller MS, Palmer BM, Ruch S, Martin LA, Farman GP, Wang Y, Robbins J, Irving TC, Maughan DW. The essential light chain N-terminal extension alters force and fiber kinetics in mouse cardiac muscle. J Biol Chem. 2005;280(41):34427–34434. doi: 10.1074/jbc.M508430200. [DOI] [PubMed] [Google Scholar]
- Milligan RA, Whittaker M, Safer D. Molecular structure of F-actin and location of surface binding sites. Nature. 1990;348(6298):217–221. doi: 10.1038/348217a0. [DOI] [PubMed] [Google Scholar]
- Miyanishi T, Ishikawa T, Hayashibara T, Maita T, Wakabayashi T. The two actin-binding regions on the myosin heads of cardiac muscle. Biochemistry. 2002;41(17):5429–5438. doi: 10.1021/bi0118355. [DOI] [PubMed] [Google Scholar]
- Morano I. Tuning the human heart molecular motors by myosin light chains. J Mol Med (Berl) 1999a;77(7):544–555. doi: 10.1007/s001099900031. [DOI] [PubMed] [Google Scholar]
- Morano I. Tuning the human heart molecular motors by myosin light chains. J Mol Med. 1999b;77(7):544–555. doi: 10.1007/s001099900031. [DOI] [PubMed] [Google Scholar]
- Morano I, Ritter O, Bonz A, Timek T, Vahl CF, Michel G. Myosin light chain-actin interaction regulates cardiac contractility. Circ Res. 1995;76(5):720–725. doi: 10.1161/01.res.76.5.720. [DOI] [PubMed] [Google Scholar]
- Muthu P, Wang L, Yuan CC, Kazmierczak K, Huang W, Hernandez OM, Kawai M, Irving TC, Szczesna-Cordary D. Structural and functional aspects of the myosin essential light chain in cardiac muscle contraction. FASEB J. 2011;25(12):4394–4405. doi: 10.1096/fj.11-191973. [DOI] [PMC free article] [PubMed] [Google Scholar]
- Opie LH, Mansford KR, Owen P. Effects of increased heart work on glycolysis and adenine nucleotides in the perfused heart of normal and diabetic rats. Biochem J. 1971;124(3):475–490. doi: 10.1042/bj1240475. [DOI] [PMC free article] [PubMed] [Google Scholar]
- Rayment I, Rypniewski WR, Schmidt-Base K, Smith R, Tomchick DR, Benning MM, Winkelmann DA, Wesenberg G, Holden HM. Three-dimensional structure of myosin subfragment-1: a molecular motor. Science. 1993;261(5117):50–58. doi: 10.1126/science.8316857. [DOI] [PubMed] [Google Scholar]
- Ritter O, Luther HP, Haase H, Baltas LG, Baumann G, Schulte HD, Morano I. Expression of atrial myosin light chains but not alpha-myosin heavy chains is correlated in vivo with increased ventricular function in patients with hypertrophic obstructive cardiomyopathy. J Mol Med. 1999;77(9):677–685. doi: 10.1007/s001099900030. [DOI] [PubMed] [Google Scholar]
- Roth K, Hubesch B, Meyerhoff DJ, Naruse S, Gober JR, Lawry TJ, Boska MD, Matson GB, Weiner MW. Noninvasive quantitation of phosphorus metabolites in human tissue by NMR spectroscopy. J Magn Res. 1989;81:299–311. [Google Scholar]
- Sutoh K. An actin-binding site on the 20 K fragment of myosin subfragment 1. Biochemistry. 1982;21(19):4800–4804. doi: 10.1021/bi00262a043. [DOI] [PubMed] [Google Scholar]
- Sweeney HL. Function of the N terminus of the myosin essential light chain of vertebrate striated muscle. Biophys J. 1995;68(4 Suppl):112S–118S. discussion 118S-119S. [PMC free article] [PubMed] [Google Scholar]
- Szczesna D. Regulatory light chains of striated muscle myosin. Structure, function and malfunction. Curr Drug Targets Cardiovasc Haematol Disord. 2003;3(2):187–197. doi: 10.2174/1568006033481474. [DOI] [PubMed] [Google Scholar]
- Teague WE, Jr, Dobson GP. Effect of temperature on the creatine kinase equilibrium. J Biol Chem. 1992;267(20):14084–14093. [PubMed] [Google Scholar]
- Timson DJ. Fine tuning the myosin motor: the role of the essential light chain in striated muscle myosin. Biochimie. 2003;85(7):639–645. doi: 10.1016/s0300-9084(03)00131-7. [DOI] [PubMed] [Google Scholar]
- Timson DJ, Trayer HR, Trayer IP. The N-terminus of A1-type myosin essential light chains binds actin and modulates myosin motor function. Eur J Biochem. 1998;255(3):654–662. doi: 10.1046/j.1432-1327.1998.2550654.x. [DOI] [PubMed] [Google Scholar]
- Timson DJ, Trayer HR, Smith KJ, Trayer IP. Size and charge requirements for kinetic modulation and actin binding by alkali 1-type myosin essential light chains. J Biol Chem. 1999;274(26):18271–18277. doi: 10.1074/jbc.274.26.18271. [DOI] [PubMed] [Google Scholar]
- Ushakov DS. Structure and function of the essential light chain of myosin. Biofizika. 2008;53(6):950–955. [PubMed] [Google Scholar]
- Wannenburg T, Heijne GH, Geerdink JH, Van-Den-Dool HW, Janssen PM, DeTombe PP. Cross-bridge kinetics in rat myocardium: effect of sarcomere length and calcium activation. Am J Physiol Heart Circ Physiol. 2000;279:H779–H790. doi: 10.1152/ajpheart.2000.279.2.H779. [DOI] [PubMed] [Google Scholar]
- Weeds AG, Lowey S. Substructure of the myosin molecule II. The light chains of myosin. J Mol Biol. 1971;61(3):701–725. doi: 10.1016/0022-2836(71)90074-x. [DOI] [PubMed] [Google Scholar]
- Winstanley MA, Trayer HR, Trayer IP. Role of the myosin light chains in binding to actin. FEBS Lett. 1977;77(2):239–242. doi: 10.1016/0014-5793(77)80242-1. [DOI] [PubMed] [Google Scholar]
- Zhao Y, Kawai M. Kinetic and thermodynamic studies of the cross-bridge cycle in rabbit psoas muscle fibers. Biophys J. 1994;67(4):1655–1668. doi: 10.1016/S0006-3495(94)80638-1. [DOI] [PMC free article] [PubMed] [Google Scholar]