

Abstract
Prader-Willi syndrome (PWS) is caused by the loss of RNA expression from an imprinted region on chromosome 15 that includes SNRPN, SNORD115, and SNORD116. Currently, there are no mouse models that faithfully reflect the human phenotype and investigations rely on human post-mortem material. During molecular characterization of tissue deposited in a public brain bank from a patient diagnosed with Prader-Willi syndrome, we found RNA expression from SNRPN, SNORD115, and SNORD116 which does not support a genetic diagnosis of Prader-Willi syndrome. The patient was a female, Caucasian nursing home resident with history of morbid obesity (BMI 56.3) and mental retardation. She died at age of 56 from pulmonary embolism. SNORD115 and SNORD116 are unexpectedly stable in post mortem tissue and can be used for post-mortem diagnosis. Molecular characterization of PWS tissue donors can confirm the diagnosis and identify those patients that have been misdiagnosed.
Keywords: Prader-Willi syndrome, genetic analysis, obesity, gene expression
Introduction
Prader-Willi syndrome (PWS) is a congenital disease caused by the loss of RNA expression from an imprinted region on chromosome 15. This region is expressed only from the paternally inherited allele. Patients with PWS typically undergo several stages beginning as infants when they are characterized by severe infantile hypotonia with poor suck and failure to thrive. This stage is followed by early childhood onset obesity and hyperphagia. The patients exhibit developmental delay and/or mild intellectual disability. Other features include short stature, hypogonadism, thick saliva, obsessive-compulsive behavior, and hormonal imbalances.1,2
Recently, several patients with Prader-Willi-like phenotypes have been described (Fig. 1A). These patients had microdeletions affecting two clusters of small nucleolar RNAs (snoRNAs), SNORD115 and SNORD116. This indicates that the loss of snoRNAs plays a central role in the etiology of the disease (Fig. 1A).3–5
Figure 1A.

Overview of the snoRNA expression region on chromosome 15. Summary of the Prader-Willi syndrome region on chromosome 15q11.2-q13. C/D box snoRNAs are indicated as SNORD and their gene number.
Notes: The SNORD116 cluster consists of 24 expression units and the SNORD115 cluster of 47 expression units and is indicated in yellow. IPW: imprinted in Prader-Willi. Microdeletion of snoRNA expressing units that cause PWS are indicated by arrows. Patient 1,3 Patient 2,5 Patient 3.4 The sequences for the snoRNA probes were gggtcaatgatgagaaccttatattgtcctgaagagaggtgatgacttaaaaatcatgctcaataggattacgctgaggccc for SNORD115-11 and GGACCTCAGTTCCGATGAGAACGACGGTATGAGTTCTCACTCATTTTGTTC AGCTTTTCCAAGGAATGTTTTTATGGGGGACTCATCATCGATCCA for SNORD116-3.
The molecular mechanisms that link the loss of two clusters of snoRNAs to the disease are currently under investigation. Loss of SNORD115 could explain hyperphagia observed in PWS patients, as SNORD115 has been shown to regulate alternative splicing of the serotonin receptor 2C. SNORD115 helps to generate the most active form of the receptor.6–8 No molecular mechanisms have been established thus far demonstrating the role of SNORD116 in the generation of PWS. It is known, however, that SNORD116 influences the expression of microRNAs hosted in the second exon of the serotonin receptor 2C.9
SNORD115 and SNORD116 do not express canonical C/D box snoRNAs, but are likely processed into shorter RNAs, termed psnoRNAs,10,11 that do not associate with the proteins typically found in C/D box snoRNAs.10,12 Canonical C/D box snoRNAs function in 2′-O-methylation of non-coding RNAs and form a defined ribonuclear complex with the proteins fibrillarin, NOP56/58 and 15.5 kD (NHP2L1).
Currently, there are no mouse models available that faithfully replicate the human phenotype13 and molecular investigations rely on human material. Since SNORD115 is exclusively, and SNORD116 mainly, expressed in the brain, tissue deposited in brain banks is crucial for molecular analysis aimed to find the cause of the disease.
Case Presentation
Patient 4876 was clinically diagnosed with PWS and lived in group housing. The patient’s cause of death was pulmonary embolism at the age of 56 years (year of birth 1950). She was described as morbidly obese with a weight of 140 kg (308 lbs) and height of 157.5 cm (5 ft, 2 in) with a body mass index (BMI) of 56.3. She had a life long history of learning difficulties, carrying a diagnosis of mental retardation. She was reported to have an insatiable appetite, continually seeking food. On one occasion, she ingested 5 lbs of raw hamburger meat. It was necessary to lock food sources and as such, the refrigerator had a chain and lock on it. She threw extreme temper tantrums when she was denied food. Medical records are sparse, but she was reported to suffer from anxiety and have frequent falls. The frequent falls may have been due to low muscle tone and decreased muscle mass that is described in PWS. Additionally, the anxiety may have contributed to her behavior problems and are usually described in PWS patients. This patient also had Obstructive Sleep Apnea (OSA) with chronic CO2 retention, also described in PWS patients. Morbid obesity is also associated with OSA, however, PWS patients have a low muscle tone in addition to obesity that increases odds for OSA. These described clinical features led to the diagnosis of PWS for this patient. This diagnosis was based on clinical criteria since, at the time, routine diagnostic tests were not available.
The brain was removed after a post mortem interval of 41 hrs and showed no gross abnormalities. Microscopic examination showed gliosis and deposition of dark granular material in the cerebral cortical molecular layer and in the midbrain. There were no observable neurofibrillary tangles, senile plaques, or Lewy bodies. There was multifocal leptomeningeal fibrosis. The dentate gyrus showed focal thinning and dispersion of neurons, some of which showed degenerative features. There was loss of Purkinje cells and Bergmann’s gliosis. The patient’s medical history included depression, mental retardation, morbid obesity, hypothyroidism, diabetes mellitus, history of falls, chronic CO2 retention secondary to obesity, hypercholesterolemia, recent urinary tract infections, and meningioma. Additional family history was obtained following the current genetic analysis. The donor had two sisters with the same phenotype, one of whom is deceased.
Post-Mortem Genetic Evaluation
The brain of patient 4876 was donated to the NICHD Brain and Tissue Bank (Baltimore, MD). We analyzed RNA from frontal cortex by RNase protection analysis. As a probe, we used a uniformly radiolabeled riboprobe against chr15: 25, 318, 253-25, 318, 349 for SNORD115 and chr15: 25, 494, 345-25, 494, 426 for SNORD116 in Hg19 for SNORD115 and chr15: 25, 494, 345-25, 494, 426 for SNORD116. The RNase protections were performed as previously described.14 RNA was isolated from brain using RNeasy Lipid Tissue Kit (Qiagen, Hilden) according to manufactory protocol. RNA expressing constructs to make RNase protection probes are available through Addgene (Cambridge MA).
As controls, we used RNA obtained from non Prader-Willi subject tissues from the NICHD brain bank (Table 1).
Table 1.
Overview of patient material used.
| Patient | 4876 | 5324 | 4805 | 5238 | 4782 | 1539 |
| Sex | Female | Male | Female | Male | Male | Female |
| Age | 56 | 18 | 39 | 32 | 18 | 33 |
| Cause of death | Pulmonary embolism (diagnosed with PWS) | Complications of disorder (PWS) | Ischemic bowel (PWS) | Morphine intoxication | Head and chest injuries | Multiple injuries |
| PMI, hours | 41 | 22 | 16 | 7 | 17 | 23 |
| RIN | 2,3 | 5,9 | 3,9 | 4,1 | 8,9 | 7,5 |
Abbreviations: PMI, post mortem interval; RIN number (RNA integrity number) determined by capillary electrophoresis.
As shown in Figure 1B, patient 4876 expressed SNORD115 and SNORD116 to the same degree as the controls. Performing an RNase protection assay with the ubiquitously expressed U2 snoRNA showed approximately equal loading in each lane (Fig. 1C).
Figure 1B.

Overview of the snoRNA expression region on chromosome 15. RNase protection analysis of 10 μg frontal cortex RNA from PWS patients and control patients.
Notes: As a probe, uniformly 32P-labeled antisense probes were used. The RNA marker is 150, 100, 90, 80, 70, 60, 50, 40 and 30 nt. The cartoon on the right shows the localization of the riboprobes and the outline of an RNase protection assay.
Figure 1C.

Overview of the snoRNA expression region on chromosome 15. RNase protection analysis of 10 μg frontal cortex RNA from PWS and control patients using a U2 riboprobe with the sequence ATCGCTTCTCGGCCTTTTGGCTAAGATCAAGTGTAGTATCTGTTCTTATCAGT TTAATATCTGATACGTCCTCTATCCGAGGACAATATATTAAATGGATTTTTGG AAATAGGAGATGGAATAGGAGCTTGCTCCGTCCACTCCACGCATCGACCTG GTATTGCAGTACTTCCAGGAACGGTGCACTCTCC.
Note: U2 expresses multiple related genes, which accounts for the additional bands.
Next, the expression of small nuclear ribonucleoprotein polypeptide N (SNRPN) that hosts SNORD115 and SNORD116 in their 3′ UTR was analyzed (Fig. 2). We amplified the SNRPN cDNA using primers h_SNRPN-F ggactcccatcaagtctcca h (to exon #4) SNRPN-R tggctttaaccacctcttgg (to exon #5). Again, there was expression of SNRPN in patient 4876, but not in PWS controls.
Figure 2.
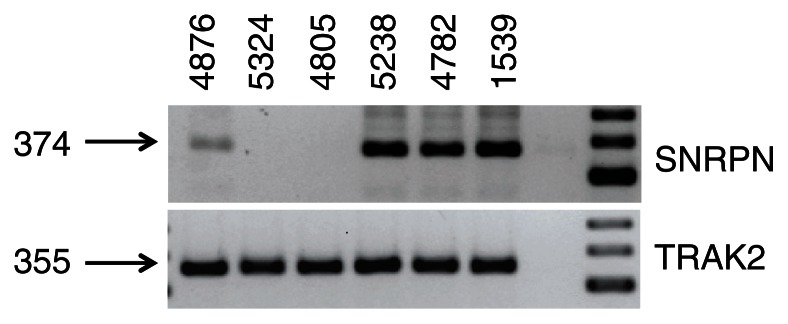
RT-PCR analysis of the SNRPN gene (A) 1 μg of RNA was reverse transcribed and amplified with the primers h_SNRPN-F ggactcccatcaagtctcca h (to exon #4) SNRPN-R tggctttaaccacctcttgg (to exon #5) that detect snRNPN. (B) TRAK2 mRNA amplification was used as a loading control.
Quantitative (q) RT-PCR was conducted for each of the brain tissue samples using 400 ng of total RNA, with a net final RNA concentration per reaction of 20 ng/μl. Then, 2.5 μl of the cDNA product (approximately 50 ng of cDNA) was used for quantitative PCR (qPCR) using TaqMan Probes directed at the SNORD116 (custom probe) and SNRPN (Applied Biosystems) target sites. A GAPDH TaqMan Probe (Applied Biosystems) was used as loading control. As shown in Figure 1D, patient 4876 had expression at SNRPN that was more than any of the 3 control brain samples and a very robust expression at SNORD116. In contrast, the two PWS samples (4805 and 5324) had basically no expression at SNRPN and SNORD116.
Figure 1D.

Overview of the snoRNA expression region on chromosome 15. qRT-PCR analysis of SNORD116 and SNRPN expression in a cortex of PWS and normal subjects.
DNA methylation analysis using Methylation-Specific Multiplex Ligation-Dependent Probe Amplification (MS-MLPA) can be used to diagnose individuals with PWS.1 We used 100 ng of DNA for each of the brain tissue samples, according to the manufacturer’s instructions (MRC Holland; Amsterdam, Netherlands). Our analysis showed that patient 4876 had approximately 57% DNA methylation at MKRN3, which would be typical for a normal control individual and was within the range of 3 control brain samples15 (Table 2). DNA methylation analysis at the SNRPN locus could not be determined due to DNA degradation from the aged brain sample.
Table 2.
Methylation-Specific Multiplex Ligation-Dependent Probe Amplification (MS-MLPA) of the samples.
| Sample | Tissue | Syndrome | MKRN3 | MAGEL2 | NDN e1 | SNRPN U1b | SNPRN alt e1 | SNRPN | SNRPN | DNA methylation interpretation | Copy number interpretation | Final Interpretation |
|---|---|---|---|---|---|---|---|---|---|---|---|---|
| PWS 4805 | Brain | PWS | 0.97 | 0.95 | 0.89 | 0.69 | 0.99 | 0.91 | 0.95 | PWS pattern | Disomy | mat. disomy |
| PWS 4876 | Brain | PWS | 0.57 | 1.04 | – | – | – | – | – | DNA partially degraded; MKRN3 c/w normal pattern | Disomy | Disomy |
| PWS 5324 | Brain | PWS | 0.92 | 0.97 | 0.60 | 0.73 | 0.94 | 1.00 | 1.22 | PWS pattern | Del. atypical | pat. atyp. del. bp2 to past bp3 |
| Control 1539 | Brain | Normal | 0.56 | 0.89 | 0.40 | 0.46 | 0.44 | 0.50 | 0.42 | Normal | Disomy | Normal |
| Control 4782 | Brain | Normal | 0.66 | 1.07 | 0.49 | 0.43 | 0.53 | – | 0.60 | Normal | Disomy | Normal |
| Control 5328 | Brain | Normal | 0.57 | 1.04 | 0.68 | 0.57 | 0.61 | – | 0.46 | Normal | Disomy | Normal |
| Exp. PWS | Brain | PWS | 1.00 | 1.00 | 1.00 | 1.00 | 1.00 | 1.00 | 1.00 | PWS pattern | – | – |
| Exp. normal | Brain | Normal | 0.50 | 1.00 | 0.50 | 0.50 | 0.50 | 0.50 | 0.50 | Normal | Disomy | Normal |
Notes: The MS-MLPA assay was conducted on 100 ng of genomic DNA for each of the brain tissue samples, according to manufacturer’s instructions (MRC Holland; Amsterdam, Netherlands). The subjects 4805 and 4876 showed patterns compatible with disomy, possibly UPD. Subject 5324′s CYFIP probe site appears to be intact, but the probe ABPA2 site, located downstream from BP3, appears to be missing, a pattern compatible with atypical deletion. Patient 4876 showed a normal methylation pattern.
Abbreviation: c/w, compatable with.
Finally, we performed Affymetrix exon junction array analysis using posterior hypothalamic RNA. We compared genome wide gene expression of patient 4876, with the two molecularly confirmed PWS patients 5324 and 4805, as well as the controls (5238, 4782, and 1539) (Table 1). For the analysis, the mean values in the control and PWS groups were compared with the values obtained for patient 4876. The array analysis is shown in the supplementary files 1 and 2 as excel spreadsheets.
The most distinct difference between 4876 and the two PWS samples were RNAs expressed from the PWS critical region on chromosome 15 that showed more than a 20 fold change. This finding is supported by RNase protection of SNORD115 and SNORD116, as well as the RT-PCR analysis of SNRPN. Overall we observed 7,190 changes between patient 4876 and PWS subjects.
The comparison between 4876 and control patients resulted in 18,050 changes with a significant change in expression. The high number of changes in both experiments likely indicates differences between individuals, rather than differences due to brain pathology. However, the RNA from posterior hypothalamus of patient 4876 was more similar to PWS subjects than to the control, as indicated by the lower numbers of fold changes.
Conclusion
Patient 4876 was diagnosed with PWS because of typical clinical demonstrations such as hyperphagia, morbid obesity, short statue, low muscle tone, sleep apnea, and mental retardation. No modern genetic analysis has been performed while the patient was alive. However, our post-mortem molecular genetic analyses eliminate PWS as a diagnosis. Our genetic analysis is based on the copy number of genes in the genetic region causing the disease as well as expression of SNORD115 and SNORD116 snoRNAs. Due to the long post mortem interval of 41 hrs, the DNA was damaged and did not yield complete DNA methylation results for all genes of the PWS critical region. Similarly, the RNA was degraded with an RNA integrity number (RIN) of 2.3 for patient 4876.
The low RIN indicates a relatively high level of degradation of ribosomal RNAs, as RIN quantification relies on ratio of long ribosomal RNA and short RNAs. snoRNAs appear to be fairly stable, as we could detect them using RNase protection analysis and qRT-PCR in RNA with a high degree of degradation. This could be due to posttranscriptional modifications or their small size. In contrast to qPCR, RNase protection analysis can discriminate between related copies of SNORD115 and SNORD116. In addition the technique allows absolute quantification of RNA and can be performed using commercially available kits. Thus using RNase protection and qRT-PCR, SNORD115 and SNORD116 can be detected in post-mortem tissue.
A genome wide array analysis showed that in terms of RNA expression, patient 4876 was more similar to PWS subjects than the genetically normal controls. This similarity reflects the clinical phenotype where patient 4876 was clinically similar to PWS resulting in misdiagnosis. Due to the small sample number, which is an intrinsic problem of using post-mortem tissue of a rare disease, we cannot make statistically supported analyses. However, the data suggest that some obesity syndromes have similarities with PWS, although the basic molecular defect is clearly different.
Our findings point out that diagnosis of patients based on clinical phenotype may result in misdiagnosis. Although clinical records are necessary and helpful, genetic analysis of tissues donated for research should be performed when feasible.
Supplementary Files
Supplementary File 1. Excel spread sheet showing the comparison between patient 4876 and two PWS patients.
Supplementary File 2. Excel spread sheet showing the comparison between patient 4876 and three control subjects.
Supplementary File 3. Distances heat map of gene expression of patient 4876, PWS patients, and normal subjects.
Acknowledgments
This work utilized tissue from the NICHD Brain and Tissue Bank for Developmental Disorders (NICHD contract #HHSN275200900011C).
Footnotes
Author Contributions
Performed molecular analysis: MF, CRS. Performed bioinformatic analysis: VA, PdG. Provided clinical samples and case description: HRZ, KMC. Prepared manuscript and directed research: DJD, SS. All authors reviewed and approved of the final manuscript.
Competing Interests
Author(s) disclose no potential conflicts of interest.
Funding
This work was supported by NIH RO1 GM083187, 5P20RR020171-08, an Endowment from Linda and Jack Gill to the University of Kentucky, funds by Dean Frederick de Beer and the Hayward Foundation.
Disclosures and Ethics
As a requirement of publication the authors have provided signed confirmation of their compliance with ethical and legal obligations including but not limited to compliance with ICMJE authorship and competing interests guidelines, that the article is neither under consideration for publication nor published elsewhere, of their compliance with legal and ethical guidelines concerning human and animal research participants (if applicable), and that permission has been obtained for reproduction of any copyrighted material. This article was subject to blind, independent, expert peer review. The reviewers reported no competing interests.
Patient Consent
The NICHD Brain and Tissue Bank has received consent for the donation of tissue for research from the legal next of kin of all donors described in the manuscript, including UMB# 4876. The Brain and Tissue Bank adheres to the standard of the Institutional Review Board of the University of Maryland School of Medicine in Baltimore, Maryland. Consents are on file in the office of the NICHD Brain and Tissue Bank.
References
- 1.Cassidy SB, Schwartz S, Miller JL, Driscoll DJ. Prader-Willi syndrome. Genet Med. 2012;14(1):10–26. doi: 10.1038/gim.0b013e31822bead0. [DOI] [PubMed] [Google Scholar]
- 2.Butler MG. Prader-Willi syndrome: obesity due to genomic imprinting. Curr Genomics. 2011;12(3):204–15. doi: 10.2174/138920211795677877. [DOI] [PMC free article] [PubMed] [Google Scholar]
- 3.Sahoo T, del Gaudio D, German JR, et al. Prader-Willi phenotype caused by paternal deficiency for the HBII-85 C/D box small nucleolar RNA cluster. Nat Genet. 2008;40(6):719–21. doi: 10.1038/ng.158. [DOI] [PMC free article] [PubMed] [Google Scholar]
- 4.Duker AL, Ballif BC, Bawle EV, et al. Paternally inherited microdeletion at 15q11.2 confirms a significant role for the SNORD116 C/D box snoRNA cluster in Prader-Willi syndrome. Eur J Hum Genet. 2010;18:1196–201. doi: 10.1038/ejhg.2010.102. [DOI] [PMC free article] [PubMed] [Google Scholar]
- 5.de Smith AJ, Purmann C, Walters RG, et al. A deletion of the HBII-85 class of small nucleolar RNAs (snoRNAs) is associated with hyperphagia, obesity and hypogonadism. Hum Mol Genet. 2009;18(17):3257–65. doi: 10.1093/hmg/ddp263. [DOI] [PMC free article] [PubMed] [Google Scholar]
- 6.Di Giovanni G, Esposito E, Di Matteo V. 5-HT2C Receptors in the Patholophysiology of CNS Disease. Humana Press; 2011. p. 22. [Google Scholar]
- 7.Martin CB, Ramond F, Farrington DT, et al. RNA splicing and editing modulation of 5-HT(2C) receptor function: relevance to anxiety and aggression in VGV mice. Mol Psychiatry. 2012 Dec 18; doi: 10.1038/mp.2012.171. [DOI] [PubMed] [Google Scholar]
- 8.Kishore S, Stamm S. The snoRNA HBII-52 regulates alternative splicing of the serotonin receptor 2C. Science. 2006;311(5758):230–2. doi: 10.1126/science.1118265. [DOI] [PubMed] [Google Scholar]
- 9.Zhang Z, Falaleeva M, Agranat-Tamir L, et al. The 5′ untranslated region of the serotonin receptor 2C pre-mRNA generates miRNAs and is expressed in non-neuronal cells. Exp Brain. Res. 2013 doi: 10.1007/s00221-013-3458-8. In press. [DOI] [PMC free article] [PubMed] [Google Scholar]
- 10.Kishore S, Khanna A, Zhang Z, et al. The snoRNA MBII-52 (SNORD115) is processed into smaller RNAs and regulates alternative splicing. Hum Mol Genet. 2010;19(7):1153–64. doi: 10.1093/hmg/ddp585. [DOI] [PMC free article] [PubMed] [Google Scholar]
- 11.Falaleeva M, Stamm S. Processing of snoRNAs as a new source of regulatory non-coding RNAs. Bioessays. 2013;35(1):46–54. doi: 10.1002/bies.201200117. [DOI] [PMC free article] [PubMed] [Google Scholar]
- 12.Soeno Y, Taya Y, Stasyk T, Huber LA, Aoba T, Huttenhofer A. Identification of novel ribonucleo-protein complexes from the brain- specific snoRNA MBII-52. RNA. 2010;16(7):1293–300. doi: 10.1261/rna.2109710. [DOI] [PMC free article] [PubMed] [Google Scholar]
- 13.Ding F, Li HH, Zhang S, et al. SnoRNA Snord116 (Pwcr1/MBII-85) deletion causes growth deficiency and hyperphagia in mice. PloS One. 2008;3(3):e1709. doi: 10.1371/journal.pone.0001709. [DOI] [PMC free article] [PubMed] [Google Scholar]
- 14.Shen M, Eyras E, Wu J, et al. Direct cloning of double-stranded RNAs from RNase protection analysis reveals processing patterns of C/D box snoRNAs and provides evidence for widespread antisense transcript expression. Nucleic Acids Res. 2011;39(22):9720–30. doi: 10.1093/nar/gkr684. [DOI] [PMC free article] [PubMed] [Google Scholar]
- 15.Jong MT, Gray TA, Ji Y, et al. A novel imprinted gene, encoding a RING zinc-finger protein, and overlapping antisense transcript in the Prader-Willi syndrome critical region. Hum Mol Genet. 1999;8(5):783–93. doi: 10.1093/hmg/8.5.783. [DOI] [PubMed] [Google Scholar]
Associated Data
This section collects any data citations, data availability statements, or supplementary materials included in this article.
Supplementary Materials
Supplementary File 1. Excel spread sheet showing the comparison between patient 4876 and two PWS patients.
Supplementary File 2. Excel spread sheet showing the comparison between patient 4876 and three control subjects.
Supplementary File 3. Distances heat map of gene expression of patient 4876, PWS patients, and normal subjects.