Abstract
Introduction: The purpose of this study was to determine if differences could be detected in the presentation patterns and admission rates among frequent emergency department users (FEDU) of an urban emergency department over a 10-year period.
Methods: This was an institutional review board approved, retrospective review of all patients who presented to the ED 5 or more times for 3 distinct time periods: “year 0” 11/98–10/99, “year 5” 11/03– 10/04, and “year 10” 11/08–10/9. FEDU were grouped into those with 5–9, 10–14, 15–19, and ≥ 20 visits per year. Variables analyzed included number of visits, disposition, and insurance status. We performed comparisons using Kolmogorov-Smirnov and chi-square tests. A p<0.05 was considered significant.
Results: We found a a 66% increase in FEDU patients over the decade studied, with a significant increase in both the number of FEDU in each visit frequency category over the 3 time periods (p<0.001), as well as the total number of visits by each group of FEDU (p<0.001). The proportion of FEDU visits for the 5–9 group resulting in admission increased from 25.9% to 29% from year 0 to year 10 (p<0.001), but not for the other visit groups. In comparing admission rates between FEDU groups, the admission rate for the 5–9 group was significantly higher than the ≥ 20 group for the year 5 time period (p<0.001) and the year 10 time period (p<0.001) and showed a similar trend, but not significant, at year 0 (p=0.052). The overall hospital admission rate for emergency patients over the same time span remained stable at 22–24%. The overall proportion of uninsured FEDU was stable over the decade studied, while the uninsured rate for the overall ED population for the same time periods increased.
Conclusion: The results demonstrate the FEDU population is not a homogeneous group of patients. Increased attention to differences among FEDU groups is necessary in order to plan more effective interventions.
INTRODUCTION
From 1998 to 2008 the number of emergency department (ED) visits increased by 30% from 94.8 million to 123 million, while the total national number of hospital-based EDs declined by 3.3% according to the American Hospital Association.1 The Centers for Disease Control and Prevention (CDC) has reported that in 2007, approximately 1 in 5 persons in the United States (U.S.) population had 1 or more ED visits in a 12-month period.2 Frequent ED Users (FEDU) are a diverse group of patients responsible for a disproportionate number of ED visits.3–6 It is not well understood how FEDU have contributed to the overall increases in ED volumes, or in hospital admissions. Previous studies have described a variety of FEDU demographic characteristics but these studies have not described subgroups of FEDU relative to their presentation and admission patterns over extended periods of time.3–10 LaCalle and Rabin3 noted in their systematic literature review of FEDU, “…although subgroups of the frequent user population exist, the results of existing studies fall short of characterizing the discrete groups, at least in ways that are useful in developing public policy”.
Several large studies have analyzed the impact of FEDU on ED volumes. Two used statewide databases to examine FEDU. Cook et al4 reviewed 3 years of ED presentations in Utah and defined FEDU as > 4 visits. In this study, FEDU accounted for 5% of ED patients but represented more than 21% of ED visits. Fuda and Immekus5 reported all ED presentations of Massachusetts residents in 2003 and found 1% had >5 ED visits. This group of FEDU accounted for 3.8% of ED patients but represented 17% of ED visits. These patients had a higher rate of hospitalization. Mandelberg et al6 reported 5 years of FEDU (≥ 5 visits/year) at San Francisco General Hospital. This group of FEDU accounted for 3.9% of ED patients and 20.8% of ED visits. None of these studies further stratified FEDU with respect to their visit frequency.
When FEDU have been stratified into groups according to visit frequency, differences have been detected. For example, Ruger et al7 reported patients with 3–20 visits were more likely to be admitted to a hospital, while patients with > 20 visits were less likely to be admitted and were more likely to be triaged at a lower severity. Similar studies by Moore et al8 and Blank et al9 created distinct visit categories for FEDU, and then identified differences in such areas as triage acuity, insurance coverage, and admission rate.
The cited studies have documented the impact of FEDU on healthcare resource utilization as well as the heterogeneity of this population. The purpose of this investigation was to further characterize the FEDU population by stratifying visit frequency over time. Our hypotheses were that FEDU visits would increase over a 10-year period and there would be discrete differences seen over time within the FEDU categories.
METHODS
We conducted this institutional review board approved retrospective review at an urban, inner city hospital ED with > 95,000 annual visits using an electronic ED information system (EmSTAT, AllScripts, Cary NC). We grouped FEDU according to number of annual visits: 5–9, 10–14, 15–19, and ≥ 20 and studied over 3 time periods: November, 1998–October 1999 (year 0), November 2003–October 2004, (year 5), November 2008–October, 2009 (year 10). Variables analyzed included number of visits, number of FEDUs, disposition, and insurance status. Patients were considered to have no insurance if they were registered as “self-pay,” “charity care,” or “Medicaid pending.” We chose the most frequently documented insurance status for analysis for each patient in each time period.
To assess differences in the distributions of the number of visits and number of FEDUs over the 3 time periods, we performed 1 sample Kolmogorov-Smirnov (K-S) test for each outcome. This method tests whether the numbers are evenly distributed across the 3 time points. For example, using the total number of visits from all 3 periods as the denominator, K-S would test whether the percentage of visits for 98–99, 03–04 and 08–09 are all equal to 33.3% (100/3). We performed this test instead of the typical analysis of variance (ANOVA) method because we only have 1 number for each time period and hence no measure of variability needed for ANOVA. Chi-square tests were done to assess differences in admission and insurance rates over time and within FEDU groups. We set the overall testing level at 0.05, and we used Bonferroni adjustments when assessing pair-wise comparisons of FEDU groups within a time point (p<0.05/10) and time points within a FEDU group (p<0.05/6).
RESULTS
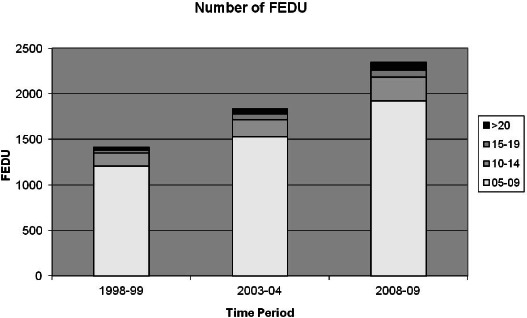
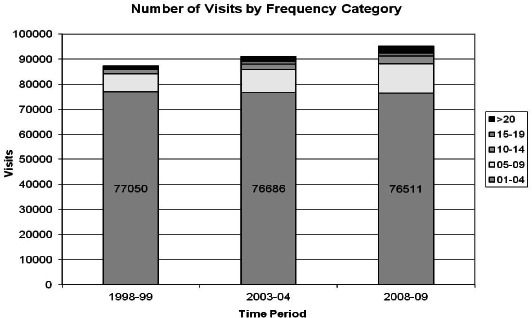
We found a 68% increase in FEDU patients over the decade studied, which was significant as compared to the overall ED census increase (p<0.001) during the same time period. The increase in overall ED census was 9% from 87,230 (year 0) to 95,170 (year 10), while the increase in visits by the FEDU population increased by 83% from 10,180 (year 0) to 18,659 (year 10) (Table 1). The percentage of visits accounted for by FEDU was 11.5% in year 0, 15.8% in year 5, and 19.6% in year 10. There was a significant increase in the number of patients in each visit frequency group over time (Figure 1) (p<0.001). The total number of visits by each FEDU group also increased (p<0.001) as shown in Figure 2.
Table 1.
Summary of frequent emergency department user (FEDU) patient and visit data for all groups and time periods.

Figure 1.

Number of patients in each frequent emergency department users (FEDU) group in years 0, 5, & 10.
Figure 2.

Number of emergency department visits by each frequent emergency department users group in years 0,5, & 10.
Patients in the 5–9 group were the largest FEDU grouping across all time periods and had the greatest impact on ED volume. In years 0, 5, and 10, the 5–9 group accounted for 8.2%, 10.2%, and 12.3% of total ED visits, respectively.
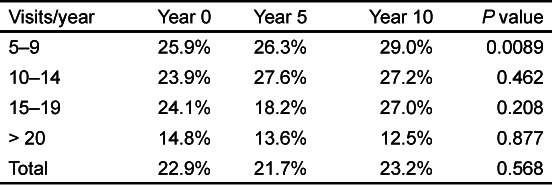
The proportion of FEDU visits for the 5–9 group resulting in admission increased from 25.9% to 29% from year 0 to year 10 (p<0.001). Admission rates within the other groups did not change significantly (Table 2). In comparing admission rates between FEDU groups, the admission rate for the 5–9 group was significantly higher than the ≥ 20 group for the year 5 time period (26.3% vs. 13.6%, p<0.001) and the year 10 time period (29% vs. 12.5%, p<0.001). At year 0, the difference showed a similar trend but was not significant (25.9% vs. 14.8%, p=0.052). The overall hospital admission rate for emergency patients over the same time span remained stable at 22–24%.
Table 2.
Admission rates for frequent emergency department user groups in years 0, 5, & 10.

The overall proportion of uninsured FEDU was relatively stable over the decade studied (4.0% in year 0, 1.8% in year 5, 5.6% in year 10). While this proportion remained relatively low for FEDU, the uninsured rate for the overall ED population for the same time intervals increased (12.6%, 17.9%, and 21.8% for years 0, 5, and 10, respectively).
DISCUSSION
The number of visits to this inner city ED has increased by 9% over the past decade. This is less than the 30% increase in total ED visits in the U.S. over this same time period. However, from 1998 to 2008, our ED had an 83% increase in FEDU visits as well as a 66% increase in FEDU patients. It is not known what proportion of the nationwide increase in ED visits is related to FEDU since this has not been reported. ED use per capita has increased from 34.1 visits/100 persons in 1996 to 40.5 visits/100 in 2006.11 Our study suggests the reported increase in ED use per capita and overall ED use is related to increased FEDU visits. Our increases have occurred despite relatively stable insurance coverage for most of these patients, which is consistent with past FEDU studies.3–7,9–10 We postulate that the increase in FEDU visits is due to a lack of both primary and specialty care access in this inner city community.
Our results highlight the impact FEDU with 5–9 visits/year have on total ED volume. Distinct from the other FEDU groups, the 5–9 group had the most patients and visits as compared to all other groups over all 3 time periods. This group also had more visits than all the other FEDU groups combined. LaCalle and Rabin's3 review article determined patients with ≥ 4 visits accounted for 21%–28% of ED visits. Our stratification of FEDU subgroups reported that this 5–9 group accounts for the most noteworthy volume percentages (8.2%, 10.2%, and 12.3% respectively for the years examined).
When broadly categorizing the FEDU population, admission rates were stable. However, when subdividing FEDU into groups, the 5–9 group was a generally sicker population as they had significantly higher hospital admission rates. Lower admission rates for the ≥ 20 group are consistent with the findings of past research focusing on “high” FEDU.3,7 Although the ≥ 20 group of FEDU may be more visible, the 5–9 group is the driving force behind volume increases. While we did not specifically study the clinical conditions associated in our patients, previous experience with the > 20 group has shown a higher incidence of substance abuse, psychiatric complaints, and social challenges, particularly with housing and transportation.12 We believe this important difference should be considered when planning FEDU interventions.
Previous impact studies have treated the FEDU population as a large homogeneous group for all patients with 5 or more visits.4–5 By purposefully stratifying into distinct groups, we were able to further characterize the heterogeneity of our FEDU population. We believe that any interventions targeting FEDU must consider the differences among the groups of FEDU and be tailored to their needs. LaCalle and Rabin's3 review found “…no study has shown a threshold number at which striking differences in resources, demographics, or clinical import are observed.” Our study demonstrated that the 5–9 group accounts for the greatest impact on ED volume and hospital admissions (i.e., healthcare resource utilization), fulfilling the threshold criteria LaCalle seeks. We believe the 5th visit is the trigger to implement specific planned interventions to address the healthcare needs of the FEDU population.
Interventions to address FEDU may be more effective if targeted to specific subgroups. For example, a program to address hospital readmission may be more effective if directed at the 5–9 group. A separate program for the ≥ 20 FEDU group may prove more beneficial to the ED.
LIMITATIONS
We did not examine use over the entire 10 years reported but instead used 3 1–year “snap shots” to characterize FEDU patterns. This is a single site study. FEDU are well known to frequent multiple EDs. This fact may underestimate the ED visits of some FEDU. Another limitation specific to this single site is that it is located in an economically challenged city with a declining population. The changes observed in this study may not completely reflect changes elsewhere. The data regarding insurance status were of variable accuracy due to changes in individual insurance status over time. A final limitation is that we did not study the clinical conditions associated with the visits.
CONCLUSION
The ED census has increased over the past 10 years. The increase at this inner city hospital is disproportionately due to an increase in FEDU. The 5–9 group had the greatest increase in visits with the highest admission rate. Stratification of the FEDU population by visit frequency over time yields new insights into this heterogeneous population and may aid in planning interventions to address the healthcare needs of these patients.
Footnotes
Conflicts of Interest: By the WestJEM article submission agreement, all authors are required to disclose all affiliations, funding sources and financial or management relationships that could be perceived as potential sources of bias. The authors disclosed none.
Supervising Section Editor: Erik D. Barton, MD, MBA
Full text available through open access at http://escholarship.org/uc/uciem_westjem
REFERENCES
- 1.Trendwatch chartbook 2010: trends affecting hospitals and health systems: appendix3, table3.3. American Hospital Association. Available at: http://www.aha.org/research/reports/tw/chartbook/2010chartbook.shtml. Accessed December 6, 2011.
- 2.Garcia TC, Bernstein AB, Bush MA. Emergency department visitors and visits: who used the emergency room in 2007? NCHS Data. May 2010. Brief. Available at: http://www.cdc.gov/nchs/data/databriefs/db38.pdf. Accessed December 6, 2011. [PubMed]
- 3.LaCalle E, Rabin E. Frequent users of emergency departments: the myths, the data, and the policy implications. Ann Emerg Med. 2010;56:42–49. doi: 10.1016/j.annemergmed.2010.01.032. [DOI] [PubMed] [Google Scholar]
- 4.Cook LJ, Knight S, Junkins EP. Repeat patients to the emergency department in a statewide database. Acad Emerg Med. 2004;11:256–263. doi: 10.1111/j.1553-2712.2004.tb02206.x. et al. [DOI] [PubMed] [Google Scholar]
- 5.Fuda KK, Immekus R. Frequent users of Massachusetts emergency departments: a statewide analysis. Ann Emerg Med. 2006;48:9–16. doi: 10.1016/j.annemergmed.2006.03.001. [DOI] [PubMed] [Google Scholar]
- 6.Mandelberg JH, Kuhn RE, Kohn MA. Epidemiologic analysis of an urban, public emergency department's frequent users. Acad Emerg Med. 2000;7:637–644. doi: 10.1111/j.1553-2712.2000.tb02037.x. [DOI] [PubMed] [Google Scholar]
- 7.Ruger JP, Richter CJ, Spitznagel EL. Analysis of costs, length of stay, and utilization of emergency department services by frequent users: implications for health policy. Acad Emerg Med. 2004;11:1311–1317. doi: 10.1197/j.aem.2004.07.008. et al. [DOI] [PubMed] [Google Scholar]
- 8.Moore L, Deehan A, Seed P. Characteristics of frequent attenders in an emergency department: analysis of 1-year attendance data. Emerg Med J. 2009;26:263–267. doi: 10.1136/emj.2008.059428. et al. [DOI] [PubMed] [Google Scholar]
- 9.Blank FSJ, Li H, Henneman PL. A descriptive study of heavy emergency department users at an academic emergency department reveals heavy ED users have better access to care than average users. J Emerg Nurs. 2005;31:139–144. doi: 10.1016/j.jen.2005.02.008. et al. [DOI] [PubMed] [Google Scholar]
- 10.Hunt KA, Weber EJ, Showstack JA. Characteristics of frequent users of emergency departments. Ann of Emerg Med. 2006;48:1–8. doi: 10.1016/j.annemergmed.2005.12.030. et al. [DOI] [PubMed] [Google Scholar]
- 11.Schappert SM, Rechtsteiner EA. National health statistics reports; no.8. Hyattsville, MD: National Center for Health Statistics; 2008. Ambulatory medical care utilization estimates for 2006. [PubMed] [Google Scholar]
- 12.Brauer E, Miller J, Stokes-Buzzelli S. Social factors affecting super-users at an urban emergency department. Acad Emerg Med. 2010;17:S176–177. [Google Scholar]


