

Abstract

The dopaminergic neurons of the nigrostriatal dopamine (DA) projection from the substantia nigra to the dorsal striatum become dysfunctional and slowly degenerate in Parkinson’s disease, a neurodegenerative disorder that afflicts more than one million Americans. There is no specific known cause for idiopathic Parkinson’s disease; however, multiple lines of evidence implicate oxidative stress as an underlying factor in both the initiation and progression of the disease. This involves the enhanced generation of reactive oxygen species, including hydrogen peroxide (H2O2), whose role in complex biological processes is not well understood. Using fast-scan cyclic voltammetry at bare carbon-fiber microelectrodes, we have simultaneously monitored and quantified H2O2 and DA fluctuations in intact striatal tissue under basal conditions and in response to the initiation of oxidative stress. Furthermore, we have assessed the effect of acute increases in local H2O2 concentration on both electrically evoked DA release and basal DA levels. Increases in endogenous H2O2 in the dorsal striatum attenuated electrically evoked DA release, and also decreased basal DA levels in this brain region. These novel results will help to disambiguate the chemical mechanisms underlying the progression of neurodegenerative disease states, such as Parkinson’s disease, that involve oxidative stress.
Keywords: oxidative stress, reactive oxygen species, H2O2, FSCV, Parkinson’s disease, basal dopamine concentrations
Parkinson’s disease (PD) is a progressive degenerative disorder that destroys dopamine (DA) neurons of the nigrostriatal system.1 Loss of dopaminergic neurons manifests into clinical motor symptoms including bradykinesia, tremor, and akinesia. Research efforts have long attempted to elucidate the mechanisms of this disease. Studies have pointed to a myriad of sources ranging from genetic mutations to exposure to environmental toxins.2−8 While these suspected causes seem to be very different, they share the ability to cause cellular changes in mitochondrial metabolism that increase production of reactive oxygen species (ROS). Mitochondria are the main site of ROS production in the brain.9 Genetic mutations in genes controlling mitochondrial morphology and function, such as the Parkin gene, are linked to autosomal recessive PD.2,8,10 Specifically, the Parkin gene mutation has been shown to lead to decreased resistance to ROS toxicity.5,11 Environmental sources of ROS include pesticides, such as rotenone, which is commonly used to damage the nigrostriatal DA system to generate animal models of the disease.2,12−15 Rotenone, like the Parkin gene mutation, inhibits mitochondrial function by inhibiting complex I of the respiratory chain, thus increasing ROS production.13 Overall, strong evidence exists to support a role for increased oxidative stress and aberrant mitochondrial function in the initiation and progression of PD.
Mitochondria produce ROS, such as superoxide (•O2–), from the single-electron reduction of molecular oxygen.16,17 The enzyme superoxide dismutase can then convert two molecules of •O2– to hydrogen peroxide (H2O2) and water.18,19 Thus, H2O2 can indicate the presence of more damaging and reactive ROS. Although H2O2 is less reactive than many ROS, it is able to readily penetrate cellular membranes and thus can serve as a signaling molecule essential for normal biological function. Several studies have demonstrated that endogenously produced H2O2 can modulate dopaminergic neurotransmission in the striatum (for review, see ref (20)). Endogenous H2O2 is formed upon mitochondrial dysfunction (9) and elicited by rotenone administration.21 It can also be amplified by irreversible inhibition of peroxidase enzymes, and can lead to KATP channel opening and suppression of axonal DA release.22 Furthermore, in vivo studies investigating acute exposure to rotenone have shown increased generation of ROS during DA metabolism in nigrostriatal neurons.21 Thus, elevated H2O2 levels may mediate pathophysiological signaling leading to decreased dopamine release. However, research, to date, has been unable to quantitatively monitor dynamic fluctuations of H2O2 in live tissue, or to directly assess its effects on natural DA dynamics in intact animals. We have addressed this gap by quantitatively monitoring both the generation of H2O2 and its modulation of DA dynamics in the dorsal striatum of an intact animal using FSCV at carbon-fiber microelectrodes in real-time. Increased levels of endogenous H2O2 were elicited by local administration of rotenone or mercaptosuccinate (MCS), a glutathione peroxidase inhibitor, allowing us to exploit aberrant mitochondrial function as well as altered enzymatic degradation as sources of increased H2O2. Finally, we assess the effects of increased H2O2 concentration on both electrically evoked DA release and basal levels of DA within the same microenvironment in the dorsal striatum.
Results and Discussion
Detecting Striatal H2O2 Fluctuations Using Fast-Scan Cyclic Voltammetry at Carbon-Fiber Microelectrodes
FSCV is a well characterized electroanalytical method that is used to monitor rapidly fluctuating small molecules in live brain tissue. It is most commonly used for monitoring catecholamines,23−26 but has recently been expanded to other molecules including serotonin,27,28 adenosine,29 histamine30,31 and H2O2.32 In this work, the carbon-fiber electrode was positioned in the dorsal striatum of an anesthetized rat and ramped from −0.4 to 1.4 V in a triangular waveform every 100 ms at a scan rate of 400 V/s. This produces a large and stable nonfaradaic background current that can be subtracted to reveal smaller faradaic currents produced by electroactive analytes in the immediate vicinity of the electrode. When the applied voltage is plotted with respect to faradaic current a distinct voltammetric signature is obtained that serves to identify the analytes (Figure 1C). Current collected at a specific potential can be converted to concentration upon electrode calibration (Figure 1B). Thus, FSCV provides a combination of both qualitative and quantitative information about dynamic transmission events in real-time.
Figure 1.
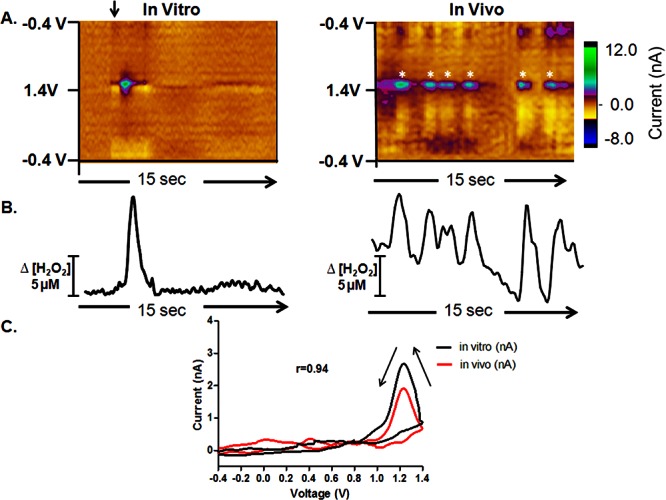
Rapid H2O2 fluctuations in the dorsal striatum. H2O2 is generated at a robust striatal recording site (right) compared with H2O2 detection in vitro (left). (A) Color plots each containing 150 background-subtracted voltammograms. The ordinate is potential applied to the carbon-fiber electrode, the abscissa is time, and the current is depicted in false color. (B) Concentration vs time traces extracted from the data at 1.2 V; the peak oxidation potential for H2O2. The current is converted to concentration upon electrode calibration. (C) The cyclic voltammogram for a H2O2 transient collected in vivo is presented as a black line, and that collected in vitro is presented as a red line for comparison.
Representative color plots, each containing 150 background-subtracted voltammograms, are shown in Figure 1A. These plots allow the presence of specific substances to be readily discriminated, as they depict the current collected at each potential.33 The left panel shows a 10 μM bolus injection of H2O2 in a flow-injection apparatus and the right panel shows naturally occurring H2O2 fluctuations recorded in vivo. Both sets of data show oxidation peaks at ∼1.2 V on the reverse scan, consistent with the voltammetric signature for H2O2 when the data are filtered with a 2.5 kHz 4-pole Bessel Filter.32 Representative cyclic voltammograms extracted from the in vitro (black) and in vivo (red) data have a Pearson correlation coefficient of 0.94 (r = 0.94, p < 0.0001, Figure 1C). Current versus time plots were extracted from the data at 1.2 V, the peak oxidation potential for H2O2, and converted to concentration upon electrode calibration (Figure 1B). These demonstrate a highly dynamic concentration profile for endogenous H2O2 in this striatal location. Across all animals, H2O2 concentrations transiently fluctuated by 4.8 ± 0.5 μM at a frequency of 8.2 ± 1.5 min–1 (mean ± SEM). All recording sites showed evidence of H2O2 transients; however, the events were highly heterogeneous in any given animal (Table 1). The mean frequency and amplitude of the H2O2 fluctutations collected at a single recording site in three consecutive one minute epochs under basal conditions are shown for each animal in Table 1. With all electrochemical sensors, selectivity is a concern.23
Table 1. H2O2 Transient Characteristicsa.
| animal no. | frequency (min-1) | amplitude (μM) |
|---|---|---|
| 1 | 4.33 ± 0.13 | 3.43 ± 0.03 |
| 2 | 11.50 ± 0.36 | 5.87 ± 0.16 |
| 3 | 8.67 ± 0.09 | 5.18 ± 0.09 |
| 4 | 8.33 ± 0.28 | 4.72 ± 0.11 |
Frequency and amplitude of naturally-occurring H2O2 fluctuations recorded in the dorsal striatum of each animal. Three 1 min epochs were averaged per animal before pharmacological manipulation in order to obtain the mean and associated SEM.
In order to unequivocally validate the signal, we microinfused 1 M H2O2 into the dorsal striatum through an injection cannula positioned 50–100 μm away from the electrode surface. The color plots obtained after the microinfusion show an oxidation peak at ∼1.2 V on the reverse scan, consistent with the voltammetric signature for H2O2 (Figure 2, left). Current versus time traces extracted from the data at 1.2 V were then converted to concentration upon electrode calibration. Next, endogenous H2O2 concentrations were increased by local microinfusion of 100 mM MCS (Figure 2, right). This induced a large, gradual increase in the extracellular H2O2 concentration that measured 151 ± 26 μM at its maximum point. This maximum occurred 4.7 ± 0.3 min after the onset of microinfusion, and remained locally elevated for 3.4 ± 0.7 min (n = 4). A Student’s t test confirmed that there was a significant increase in the maximum H2O2 concentration evoked by the MCS microinfusion when compared to the same time point after a saline microinfusion (p < 0.01, Figure 2C, right).The extracted voltammograms from these experiments are significantly correlated with a Pearson correlation factor of 0.98 (r = 0.98, p < 0.001, Figure 2C, left), which identifies the analyte as H2O2. These data are consistent with past work in guinea pig brain slices that utilized fluorescence labeling to demonstrate elevated levels of H2O2 in the dorsal striatum upon inhibition of GSH peroxidase with bath application of the same dose of MCS.22,34−36 The data are also consistent with previously published work utilizing amperometric recordings in anesthetized rats to monitor electrically evoked H2O2.37 However, amperometry is a nonselective electrochemical technique, and electrical stimulation often evokes a large pH shift, which can act as an interferent. By using FSCV rather than amperometry, we have used the characteristic voltammogram for H2O2 to establish a more reliable quantitative estimate of the H2O2 produced in a discrete local microenvironment before and after pharmacological manipulation (Figure 2).
Figure 2.
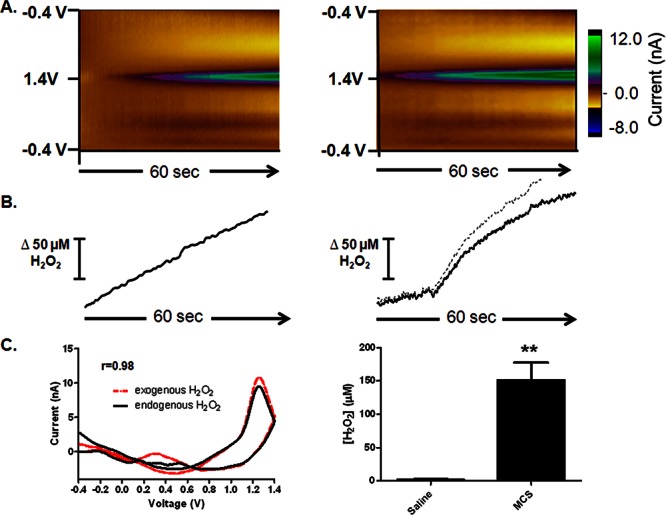
Detection of exogenous (left) and endogenous (right) H2O2. (A) Left: 1 M H2O2 was locally microinfused into the striatum, at a location proximal to the microelectrode. Right: averaged color plots (n = 4) collected ∼4.7 min after the onset of a local microinfusion of 100 mM MCS. (B) Concentration vs time traces extracted from the data at 1.2 V, the peak oxidation potential for H2O2. (C) Left: cyclic voltammograms extracted from the data. The cyclic voltammogram for endogenous H2O2 is presented as a black line, and that for exogenous H2O2 is presented as a red line for comparison (r = 0.98). Right: bar graph quantifying the increase in H2O2 elicited by microinfusion of MCS compared to saline (n = 4, p < 0.01, Student’s t test).
H2O2 Modulates Striatal Dopamine Signaling
We also monitored the effects of endogenous H2O2 in the striatum on DA dynamics in this brain region. Using FSCV, naturally occurring DA fluctuations can be reliably quantified. Additionally, electrical stimulation of the substantia nigra pars compacta (SNc) reliably evokes time-locked DA release from terminals in the dorsal striatum. A representative color plot for electrically evoked DA release is shown in Figure 3A, left, and the dynamic concentration change resulting from stimulation is plotted in Figure 3B, left. A voltammogram extracted from the data identifies the analyte as DA (Figure 3C, left). Next, we locally microinfused 100 mM MCS to cause a large, gradual increase in extracellular H2O2 concentration, as described above. Interestingly, this treatment subsequently induced a decrease in basal DA levels in the same discrete locations, evident in the color plots collected thereafter. DA levels began to decrease 6.45 ± 0.84 min after the onset of MCS microinfusion, and color plots containing data collected at the onset of this decrease were averaged (Figure 3A, center). This DA decrease was evident over the remainder of the 10 min collection period, it measured 155.7 ± 18.8 nM at its maximum, and was statistically significant when compared to data collected at the same time point following a saline microinfusion (Figure 3B, center inset, n = 4, p < 0.05, Student’s t test). An extracted voltammogram unequivocally identifies the analyte as DA (Figure 3C, center). Ten minutes after the microinfusion, DA release was again electrically evoked (Figure 3, right), and its release was significantly attenuated compared to the initial stimulation (Figure 3 right and Figure 5). When no pharmacological manipulation is made, DA release is stable over this time scale (n = 3, data not shown). Thus, we make the first quantitative measurements of pharmacologically increased H2O2 in intact animals, and directly demonstrate that this increase modulates basal DA levels in the same discrete locations. Histological examination of electrode placements reveleaed that recordings were made in the dorsal striatum (Figure 6). These results add to the growing literature highlighting modulation of the nigrostriatal dopamine system by reactive oxygen species.1,3,4,38,52
Figure 3.

H2O2 modulates striatal dopamine. (A) Color plots depicting striatal DA dynamics. Left: DA release evoked by electrical stimulation (arrow) of the SN at the start of the experiment. Center: averaged color plots (n = 4) depicting a decrease in basal DA levels ∼6 min after the onset of MCS microinfusion. Right: color plot of DA release electrically evoked (arrow) at the end of the experiment. (B) Concentration vs time traces extracted from the data at 0.6 V, the peak oxidation potential for DA. The bar graph (inset) quantifies the decrease in basal DA levels evoked by the MCS microinfusion, compared to a saline microinfusion (n = 4, p < 0.001, Student’s t test). (C) Cyclic voltammograms extracted from the data qualitatively identifying the analyte as DA.
Figure 5.

Locally elevated H2O2 concentrations attenuate electrically evoked DA release in the striatum, regardless of the pharmacological strategy used to elicit the H2O2 increase. Increased levels of endogenous H2O2 were elicited by local administration of either rotenone or MCS, allowing us to investigate multiple means of inducing a locally elevated H2O2 concentration. Both treatments elicited a significant effect on evoked DA release in the striatum, [F (3, 16) = 30.08], p < 0.0001, one-way ANOVA]. Posthoc Tukey’s comparisons indicate that both 100 mM MCS and 500 nM rotenone significantly attenuated electrically evoked DA release in the striatum (n = 4, ***p < 0.001 vs saline, ##P < 0.01 vs 100 nM rotenone, ###p < 0.001 vs 100 nM rotenone).
Figure 6.

Distribution of carbon-fiber microelectrode placements in dorsal striatum. Coronal diagram shows recording and microinfusion sites for four subjects used in this study (gray dots). Coordinates and drawings were taken from a stereotaxic atlas.62
The 155 nM decrease in basal dopamine levels elicited in response to MCS-generated oxidative stress lends additional insight into the basal concentration of DA in the striatum, suggesting that it must be at least this high in the dorsal striatum. This issue has been highly debated in the literature, with estimates for basal DA concentrations in the striatum ranging from the nanomolar to micromolar range.39−44 Part of the variability in these reported measurements is due to differences in the measurement approach, and how it affects the experimental results. Microdialysis is well-suited for absolute measurements, but the probe is relatively large and inserting any structure into the brain results in trauma to the surrounding tissue.45,46 Estimates using this approach are in the low nanomolar range;47 however, these measurements may underestimate the basal dopamine concentration.48 Furthermore, the time-scale offered by this approach is not commensurate with the rapid time-scale of neuronal firing, and temporal averaging further confounds the estimation. In contrast, FSCV is a widely used electrochemical approach for monitoring rapid DA fluctuations; however, it reports on differential changes and thus has not been traditionally used to determine basal DA levels. However, recent work by Owesson-White et al. evaluated DA transients collected using FSCV and presented a case for spontaneous dopamine transients constituting a major component of the basal dopamine level in the NAc.40 These data suggest a relatively low (20–30 nM) extracellular DA concentration within the striatum. Other voltammetric studies have suggested that the basal DA concentration is far greater, ∼2.5 μM.39 Finally, mathematical modeling studies using kinetic parameters derived from voltammetric experiments have led to estimates of intermediate levels of 95–220 nM for DA basal concentrations,49,50 in agreement with the data presented herein (Figure 3C, center). Our current results may help clarify this issue by offering new insight into this debated concentration.
In any given voltammogram, the anodic current is generated as DA is electrochemically converted to dopamine-o-quinone (DAQ) at the electrode surface, and the cathodic current results from the reduction of the resulting ortho-quinone back to DA. In all voltammograms collected in tissue, the cathodic current is typically less than the anodic current, as some of the DAQ that is electrochemically generated at the electrode surface diffuses away from the electrode before it can be reduced back to DA. Additional DAQ can also be chemically generated from the autoxidation of DA, particularly under conditions of elevated O2 concentrations or oxidative stress.51 This chemically generated DAQ would also contribute to the electrochemical signal, amplifying the cathodic current. Careful inspection of the data presented in Figure 3 revealed that the voltammograms obtained after the MCS-induced oxidative stress exhibited greater cathodic current than those collected following electrical stimulation. When these voltammograms were normalized by their peak anodic current, it was clear that additional DAQ was generated by the MCS microinfusion (Figure 4A). The anodic to cathodic current ratios were quantified across all animals in Figure 4B. Postcalibration of the electrode suggested that oxidative stress chemically generated ∼20 nM DAQ. A one-way analysis of variance revealed a significant effect on the current ratios ([F (3, 11) = 44.87] p < 0.0001), and a posthoc Tukey’s comparison statistically verified that the current ratio is decreased following MCS microinfusion (Figure 4B, n = 4, p < 0.0001 vs Pre-MCS (***) and Post-MCS (###)).
Figure 4.
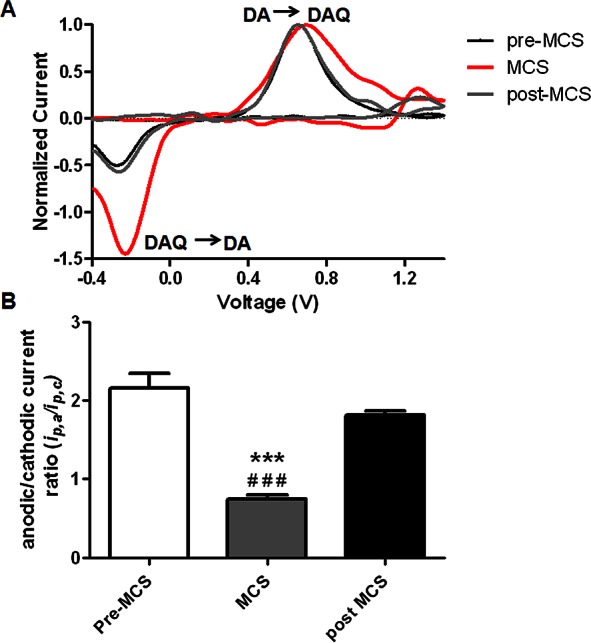
MCS microinfusion increases the extracellular concentration of dopamine-o-quinone. (A) Cyclic voltammograms extracted from the data and normalized by their peak anodic current. Increased cathodic current is evident in the DA voltammograms collected following MCS microinfusion into the striatum (red line). Postcalibration of the electrodes suggests that oxidative stress chemically generated ∼20 nM DAQ. (B) A bar graph quantifying the significant effect of drug treatment on the anodic/cathodic current ratios [F (3, 11) = 44.87] p < 0.0001, one-way ANOVA]. Posthoc Tukey’s comparisons reveal that the current ratio is significantly decreased compared to both pre- (***) and post- (###) MCS conditions (n = 4, p < 0.0001).
We next investigated the effects of aberrant mitochondrial function on electrically evoked DA release in the dorsal striatum (Figure 5). Extracellular H2O2 concentrations were increased by locally infusing rotenone, a drug that elicits the generation of H2O2 by inhibiting complex I of the mitochondrial respiratory chain (100 nM, 500 nM), or MCS (100 mM). The group order for microinfusion was randomly selected to control for drug order effects. The bar graph demonstrates a significant effect of drug treatment on evoked DA concentration in the striatum, ([F (3, 16) = 30.08], p < 0.0001, n = 5, one way ANOVA). Tukey’s posthoc comparisons indicate that amplification of endogenous H2O2 signaling by local inhibition of the electron transport chain in complex I of the mitochondria (500nM rotenone), or by inhibition of the enzyme GSH peroxidase (100 mM MCS), significantly attenuates electrically evoked DA release. These data are consistent with previous studies demonstrating that increased H2O2 in guinea pig brain slices has a neuromodulatory effect that serves to decrease extracellular DA signaling in the dorsal striatum.22,34,35,52,53
The specific molecular mechanism by which H2O2 modulates DA signaling has not been directly examined in our current work. However, H2O2 can influence a wide variety of cellular processes.20 Indeed, H2O2 can activate several signaling protein kinases, such as extracellular signal-regulated kinase (ERK 1 and 2) and protein kinase B (PKB) in different cell types (for review, see ref (54)). Additionally, in neuronal culture, H2O2 has been shown to modulate the activity of the DA transporter at both intracellular and extracellular sites.55 Recent work in the striatum has shown that glutamate activates AMPA receptor sites on medium spiny neurons, initiating the generation of H2O2, which then diffuses to adjacent DA axons and inhibits electrically evoked DA release by way of KATP channels.56 Evidence for lack of DA axon involvement in this H2O2 production has come from experiments using parasagittal slices, a preparation that allows for stimulation of the intact pathway, as well as local electrical stimulation of dopaminergic terminals.56 An AMPA receptor antagonist bath applied in the aCSF did not affect DA release elicited by electrical stimulation of the nigrostriatal DA pathway, but increased DA release that was locally evoked, implicating mitochondria in medium spiny neurons as the source of the increased H2O2, rather than generation in dopaminergic axons. However, one cannot exclude the possibility that this AMPA antagonist is also working at other points in the circuit. Furthermore, H2O2 has also been shown to work at other receptors, including transient receptor potential (TRP) channels in GABAergic neurons of the SN.57 TRP channel activation can increase GABAergic activity in the SN, and this may work to inhibit DA neurons. H2O2 can also activate the G-protein coupled, Kv1 family of receptors.58 These receptors are found on DA neurons and can play a major role in modulating DA release.59 Finally, it has also been reported that ROS, including H2O2, can be produced in the autoxidation of DA in the extracellular space of the striatum.37 These can oxidize cysteine residues on Ca2+ dependent SNARE proteins to decrease function (60) and thus further suppress the release of DA.
Independent of the exact molecular mechanisms by which H2O2 acts to decrease DA levels and signaling, the discovery that increased concentrations of endogenously produced H2O2 can attenuate basal DA levels reveals an intriguing process by which synaptic transmission within the striatum is affected by ROS. Additionally, our data show that H2O2 generated as a result of either mitochondrial or enzymatic dysfunction can modulate DA signaling. As discussed earlier in the introduction, Parkinson’s disease involves degeneration of DA neurons and altered DA signaling, and it has been linked to oxidative stress,7 damage of complex I of the mitochondria3,35 and decreased levels of GSH peroxidase.38 The present findings provide the first in vivo measurements quantifying endogenous H2O2 dynamics in live brain tissue. This is significant because studies on the role of H2O2 in any biological process require precise understanding of its dynamics and physiological range in the experimental system.
Methods
Animals and Surgical procedure
Male Sprague-Dawely rats (300–400 g) were purchased from Charles River (Wilmington, MA) and were individually housed in a temperature/humidity controlled facility with a 12-h light/dark cycle and food and water provided ad libitum. Rats were given a minimum of 2 days habituation to the facility post-transport before surgery was performed. The surgical procedure was performed as described previously,61 using flat skull stereotaxic coordinates obtained from Paxinos and Watson 1986. Briefly, rats were deeply anesthetized with sodium urethane (1.5 g/kg i.p.) and placed in a stereotaxic frame (Kopf Instrumentation; Tujunga, CA). Deltaphase isothermal pads (Braintree Scientific, Braintree, MA) were used to maintain body temperature. Bupivicaine was injected just under the skin of the skull and the skull was exposed to reveal bregma and lamda in order to level and drill the holes for electrode placement. The bipolar stimulating electrode was placed in the SNc (−5.6 AP, +1.1 ML, −8.5—9.0 DV). Recording electrodes were positioned in the dorsal striatum (+1.2 AP, +2.0 ML, −4.5—5.5 DV). Reference electrodes were Ag/AgCl, placed superficially in the contralateral cortex. The dorsal-ventral location of stimulating and recording electrodes was optimized so that DA release was robust for the electrically evoked DA experiments. Animal care was approved by the Institutional Animal Care and Use Committee of North Carolina State University and was in accordance with NIH guidelines.
Electrodes
Carbon-fiber microelectrodes were fabricated as described previously.61 Briefly, a single 7 μm diameter fiber (GoodFellow, Huntingdon, England) was aspirated into a borosilicate capillary tube (1.0 mm × 0.5 mm, A-M Systems, Carlsburg, WA). Using a micropipet puller (Narishige, Tokyo, Japan) the glass was tapered to form sealed microelectrodes. The extending carbon fiber was then cut to ∼100 μm beyond the glass seal. Electrical connection between the carbon fiber and 26-gauge lead wire was provided by a small amount of conductive silver paint (GC Electronics, Rockford, IL), and the electrode was loaded into a custom micromanipulator (UNC Physics Shop) and slowly lowered into the dorsal striatum.
Data Acquisition and Fast-Scan Cyclic Voltammetry
A cyclic voltammetric waveform was used that consisted of a scan that ranged from −0.4 to 0.8 V and back, a 12 ms resting period during which the electrode was held at −0.4 V, and a second ramp that ranged from −0.4 to 1.4 V and back. This complex waveform was applied at 400 V/s at a frequency of 10 Hz. Only data collected during the standard scan from −0.4 to 1.4 V and back was used in these analyses. Background-subtracted cyclic voltammograms were used for electrochemical identification of chemical species. Time-dependent changes in DA and H2O2 were obtained by monitoring current at the peak oxidation potential for each of these species (∼0.6 and ∼1.2 V, respectively), and converting to concentrations based on a postcalibration.
The cyclic voltammetric waveform was generated and the resulting signal was collected using LabVIEW (National Instruments) and a multifunction data acquisition board (PCI-6052E, National Instruments). A PCI-6711E board (National Instruments) was used to synchronize waveform acquisition, data collection, and stimulation delivery. Waveform processing and current transduction used custom-built instrumentation (University of North Carolina, Department of Chemistry Electronics Facility). HDCV Acquisition Software created at UNC-CH was used to output the electrochemical waveform, and for signal processing (background subtraction, signal averaging, and digital filtering (4-pole Bessel filter, 2.5 kHz). Electrical stimulation was computer generated and passed through an optical isolator and constant-current generator (Digitimer Ltd., Hertfordshire, England). Stimulus pulses (biphasic, 200 μA, 2 ms duration) were applied to a bipolar electrode (tip separation ∼1.0 mm Plastics One, Roanoke, VA). Trains were applied at a frequency of 30 Hz (60 pulses).
Experimental Design
FSCV at carbon-fiber microelectrodes was performed in the terminal field of the nigrostriatal dopamine system, which includes DA neurons that project from the SNc to the dorsal striatum. Microelectrodes were electrochemically conditioned for ∼30 min before the experiment began. Experiments consisted of 10 min of baseline collection (pre-infusion), 10–15 min of recording over a period that encompassed microinfusion of saline or drug, and finally electrical stimulation of the nerve terminals. Drugs (Sigma-Aldrich) were unilaterally microinfused at a rate of 0.5 μL/min for 60s with a syringe pump (Kent Scientific Corporation, Torrington, CT). This was done using an infusion cannula (33 gauge) inserted into an implanted guide positioned 50–100 μm from the working electrode using a custom-made microinfusion/manipulator cannula combination. The drug groups consisted of saline (control), 100 mM MCS (n = 4), and 100 and 500 nM rotenone (n = 4). The first microinfusion into the striatum consisted of sterile saline (0.9%), and the process was repeated ∼20–30 min later with microinfusion of a drug (n = 4). Subsequent drugs were microinfused at 2 h intervals.
Histology
Animals were deeply anesthetized with sodium urethane (2 g/kg, i.p.). Dorsal recording locations were marked by infusing cresyl violet. Animals were transcardially perfused with saline followed by 10% formalin post drop fix. Brains were removed intact, refrigerated, and coronally sectioned at 40 μm on a vibratome in order to determine electrode placement.
Statistical Analysis
Data were analyzed using either a one-way ANOVA with Tukey’s post hoc test, or with Student’s t tests to compare concentrations of DA and H2O2 evoked by MCS verses saline microinfusion. Statistical significance was designated at p < 0.05, and error bars are ± SEM. A Pearson correlation value was calculated for the in vivo vs in vitro voltammograms as well as for exogenously applied H2O2 vs endogenously produced H2O2. Significance was designated at p < 0.05. All statistical analyses were performed using GraphPad Prism 5 Software Version 5.04 for Windows (GraphPad Software).
Acknowledgments
We thank J. G. Roberts and M. E. Rice for thoughtful discussion and L. Qi for supporting data.
Author Contributions
L.A.S. conceived of the work; M.S., A.L.S., and L.A.S. designed experiments; M.S., J.G.-N., A.L.S., J.M.L., and J.V.T. collected and analyzed data; and M.S. and L.A.S. prepared the manuscript.
This work was supported by the U.S. National Institutes of Health (R01-NS076772 to L.A.S.).
The authors declare no competing financial interest.
Funding Statement
National Institutes of Health, United States
References
- Sutachan J. J.; Casas Z.; Albarracin S. L.; Stab B. R. 2nd; Samudio I.; Gonzalez J.; Morales L.; Barreto G. E. (2012) Cellular and molecular mechanisms of antioxidants in Parkinson’s disease. Nutr. Neurosci. 15, 120–126. [DOI] [PubMed] [Google Scholar]
- Sonia Angeline M.; Chaterjee P.; Anand K.; Ambasta R. K.; Kumar P. (2012) Rotenone-induced parkinsonism elicits behavioral impairments and differential expression of parkin, heat shock proteins and caspases in the rat. Neuroscience 18, 291–301. [DOI] [PubMed] [Google Scholar]
- Lee J.; Giordano S.; Zhang J. (2012) Autophagy, mitochondria and oxidative stress: cross-talk and redox signalling. Biochem. J. 441, 523–540. [DOI] [PMC free article] [PubMed] [Google Scholar]
- Surmeier D. J.; Guzman J. N.; Sanchez-Padilla J.; Schumacker P. T. (2011) The role of calcium and mitochondrial oxidant stress in the loss of substantia nigra pars compacta dopaminergic neurons in Parkinson’s disease. Neuroscience 198, 221–231. [DOI] [PMC free article] [PubMed] [Google Scholar]
- Schapira A. H.; Gegg M. (2011) Mitochondrial contribution to Parkinson’s disease pathogenesis. Parkinson’s Dis. 2011, 159160. [DOI] [PMC free article] [PubMed] [Google Scholar]
- Henchcliffe C.; Beal M. F. (2008) Mitochondrial biology and oxidative stress in Parkinson disease pathogenesis. Nat. Clin. Pract. Neurol. 4, 600–609. [DOI] [PubMed] [Google Scholar]
- Halliwell B. (1992) Reactive oxygen species and the central nervous system. J Neurochem. 59, 1609–1623. [DOI] [PubMed] [Google Scholar]
- Wang H. L.; Chou A. H.; Wu A. S.; Chen S. Y.; Weng Y. H.; Kao Y. C.; Yeh T. H.; Chu P. J.; Lu C. S. (2011) PARK6 PINK1 mutants are defective in maintaining mitochondrial membrane potential and inhibiting ROS formation of substantia nigra dopaminergic neurons. Biochim. Biophys. Acta 1812, 674–684. [DOI] [PubMed] [Google Scholar]
- Adam-Vizi V. (2005) Production of reactive oxygen species in brain mitochondria: contribution by electron transport chain and non-electron transport chain sources. Antioxid. Redox Signaling 7, 1140–1149. [DOI] [PubMed] [Google Scholar]
- Coppede F. (2012) Genetics and epigenetics of Parkinson’s disease. Sci. World J. 2012, 489830. [DOI] [PMC free article] [PubMed] [Google Scholar]
- Cui H.; Kong Y.; Zhang H. (2012) Oxidative stress, mitochondrial dysfunction, and aging. J. Signal Transduction 2012, 646354. [DOI] [PMC free article] [PubMed] [Google Scholar]
- Blesa J.; Phani S.; Jackson-Lewis V.; Przedborski S. (2012) Classic and new animal models of Parkinson’s disease. J. Biomed. Biotechnol. 2012, 845618. [DOI] [PMC free article] [PubMed] [Google Scholar]
- Betarbet R.; Sherer T. B.; MacKenzie G.; Garcia-Osuna M.; Panov A. V.; Greenamyre J. T. (2000) Chronic systemic pesticide exposure reproduces features of Parkinson’s disease. Nat. Neurosci. 3, 1301–1306. [DOI] [PubMed] [Google Scholar]
- Bove J.; Prou D.; Perier C.; Przedborski S. (2005) Toxin-induced models of Parkinson’s disease. NeuroRx 2, 484–494. [DOI] [PMC free article] [PubMed] [Google Scholar]
- Cannon J. R.; Tapias V.; Na H. M.; Honick A. S.; Drolet R. E.; Greenamyre J. T. (2009) A highly reproducible rotenone model of Parkinson’s disease. Neurobiol. Dis. 34, 279–290. [DOI] [PMC free article] [PubMed] [Google Scholar]
- Droge W. (2002) Free radicals in the physiological control of cell function. Physiol. Rev. 82, 47–95. [DOI] [PubMed] [Google Scholar]
- Turrens J. F. (2003) Mitochondrial formation of reactive oxygen species. J. Physiol. 552, 335–344. [DOI] [PMC free article] [PubMed] [Google Scholar]
- Fridovich I. (1995) Superoxide radical and superoxide dismutases. Annu. Rev. Biochem. 64, 97–112. [DOI] [PubMed] [Google Scholar]
- Fridovich I. (1997) Superoxide anion radical (O2-.), superoxide dismutases, and related matters. J. Biol. Chem. 272, 18515–18517. [DOI] [PubMed] [Google Scholar]
- Rice M. E. (2011) H2O2: a dynamic neuromodulator. Neuroscientist 17, 389–406. [DOI] [PMC free article] [PubMed] [Google Scholar]
- Freestone P. S.; Chung K. K.; Guatteo E.; Mercuri N. B.; Nicholson L. F.; Lipski J. (2009) Acute action of rotenone on nigral dopaminergic neurons--involvement of reactive oxygen species and disruption of Ca2+ homeostasis. Eur. J. Neurosci. 30, 1849–1859. [DOI] [PubMed] [Google Scholar]
- Avshalumov M. V.; Chen B. T.; Koos T.; Tepper J. M.; Rice M. E. (2005) Endogenous hydrogen peroxide regulates the excitability of midbrain dopamine neurons via ATP-sensitive potassium channels. J. Neurosci. 25, 4222–4231. [DOI] [PMC free article] [PubMed] [Google Scholar]
- Phillips P. E.; Robinson D. L.; Stuber G. D.; Carelli R. M.; Wightman R. M. (2003) Real-time measurements of phasic changes in extracellular dopamine concentration in freely moving rats by fast-scan cyclic voltammetry. Methods Mol. Med. 79, 443–464. [DOI] [PubMed] [Google Scholar]
- Robinson D. L.; Venton B. J.; Heien M. L.; Wightman R. M. (2003) Detecting subsecond dopamine release with fast-scan cyclic voltammetry in vivo. Clin. Chem. 49, 1763–1773. [DOI] [PubMed] [Google Scholar]
- Park J.; Kile B. M.; Wightman R. M. (2009) In vivo voltammetric monitoring of norepinephrine release in the rat ventral bed nucleus of the stria terminalis and anteroventral thalamic nucleus. Eur. J. Neurosci. 30, 2121–2133. [DOI] [PMC free article] [PubMed] [Google Scholar]
- Sombers L. A.; Beyene M.; Carelli R. M.; Wightman R. M. (2009) Synaptic Overflow of Dopamine in the Nucleus Accumbens Arises from Neuronal Activity in the Ventral Tegmental Area. J. Neurosci. 29, 1735–1742. [DOI] [PMC free article] [PubMed] [Google Scholar]
- Hashemi P.; Dankoski E. C.; Lama R.; Wood K. M.; Takmakov P.; Wightman R. M. (2012) Brain dopamine and serotonin differ in regulation and its consequences. Proc. Natl. Acad. Sci. U.S.A. 109, 11510–11515. [DOI] [PMC free article] [PubMed] [Google Scholar]
- Hashemi P.; Dankoski E. C.; Wood K. M.; Ambrose R. E.; Wightman R. M. (2011) In vivo electrochemical evidence for simultaneous 5-HT and histamine release in the rat substantia nigra pars reticulata following medial forebrain bundle stimulation. J. Neurochem. 118, 749–759. [DOI] [PMC free article] [PubMed] [Google Scholar]
- Venton B. J.; Cechova S. (2008) Direct electrochemical detection of adenosine in vivo. Purinergic Signalling 4, S92–S93. [Google Scholar]
- Pihel K.; Hsieh S.; Jorgenson J. W.; Wightman R. M. (1995) Electrochemical Detection of Histamine and 5-Hydroxytryptamine at Isolated Mast-Cells. Anal. Chem. 67, 4514–4521. [DOI] [PubMed] [Google Scholar]
- Pihel K.; Hsieh S. C.; Jorgenson J. W.; Wightman R. M. (1998) Quantal corelease of histamine and 5-hydroxytryptamine from mast cells and the effects of prior incubation. Biochemistry 37, 1046–1052. [DOI] [PubMed] [Google Scholar]
- Sanford A. L.; Morton S. W.; Whitehouse K. L.; Oara H. M.; Lugo-Morales L. Z.; Roberts J. G.; Sombers L. A. (2010) Voltammetric Detection of Hydrogen Peroxide at Carbon Fiber Microelectrodes. Anal. Chem. 82, 5205–5210. [DOI] [PMC free article] [PubMed] [Google Scholar]
- Michael D.; Travis E. R.; Wightman R. M. (1998) Color images for fast-scan CV. Anal. Chem. 70, 586a–592a. [DOI] [PubMed] [Google Scholar]
- Avshalumov M. V.; Rice M. E. (2002) NMDA receptor activation mediates hydrogen peroxide-induced pathophysiology in rat hippocampal slices. J. Neurophysiol. 87, 2896–2903. [DOI] [PubMed] [Google Scholar]
- Bao L.; Avshalumov M. V.; Patel J. C.; Lee C. R.; Miller E. W.; Chang C. J.; Rice M. E. (2009) Mitochondria are the source of hydrogen peroxide for dynamic brain-cell signaling. J. Neurosci. 29, 9002–9010. [DOI] [PMC free article] [PubMed] [Google Scholar]
- Rice M. E., Avshalumov M. V., and Patel J. C. (2007) Hydrogen Peroxide as a Diffusible Messenger: Evidence from Voltammetric Studies of Dopamine Release in Brain Slices. [PubMed]
- Kulagina N. V.; Michael A. C. (2003) Monitoring hydrogen peroxide in the extracellular space of the brain with amperometric microsensors. Anal. Chem. 75, 4875–4881. [DOI] [PubMed] [Google Scholar]
- Lin T. K.; Liou C. W.; Chen S. D.; Chuang Y. C.; Tiao M. M.; Wang P. W.; Chen J. B.; Chuang J. H. (2009) Mitochondrial dysfunction and biogenesis in the pathogenesis of Parkinson’s disease. Chang Gung Med J. 32, 589–599. [PubMed] [Google Scholar]
- Borland L. M.; Michael A. C. (2004) Voltammetric study of the control of striatal dopamine release by glutamate. J Neurochem. 91, 220–229. [DOI] [PubMed] [Google Scholar]
- Owesson-White C. A.; Roitman M. F.; Sombers L. A.; Belle A. M.; Keithley R. B.; Peele J. L.; Carelli R. M.; Wightman R. M. (2012) Sources contributing to the average extracellular concentration of dopamine in the nucleus accumbens. J. Neurochem. 121, 252–262. [DOI] [PMC free article] [PubMed] [Google Scholar]
- Watson C. J.; Venton B. J.; Kennedy R. T. (2006) In vivo measurements of neurotransmitters by microdialysis sampling. Anal. Chem. 78, 1391–1399. [DOI] [PubMed] [Google Scholar]
- Kawagoe K. T.; Garris P. A.; Wiedemann D. J.; Wightman R. M. (1992) Regulation of transient dopamine concentration gradients in the microenvironment surrounding nerve terminals in the rat striatum. Neuroscience 51, 55–64. [DOI] [PubMed] [Google Scholar]
- Kulagina N. V.; Zigmond M. J.; Michael A. C. (2001) Glutamate regulates the spontaneous and evoked release of dopamine in the rat striatum. Neuroscience 102, 121–128. [DOI] [PubMed] [Google Scholar]
- Justice J. B. Jr. (1993) Quantitative microdialysis of neurotransmitters. J. Neurosci. Methods 48, 263–276. [DOI] [PubMed] [Google Scholar]
- Wang Y.; Michael A. C. (2012) Microdialysis probes alter presynaptic regulation of dopamine terminals in rat striatum. J. Neurosci. Methods 208, 34–39. [DOI] [PMC free article] [PubMed] [Google Scholar]
- Jaquins-Gerstl A.; Michael A. C. (2009) Comparison of the brain penetration injury associated with microdialysis and voltammetry. J. Neurosci. Methods 183, 127–135. [DOI] [PMC free article] [PubMed] [Google Scholar]
- Shou M.; Ferrario C. R.; Schultz K. N.; Robinson T. E.; Kennedy R. T. (2006) Monitoring dopamine in vivo by microdialysis sampling and on-line CE-laser-induced fluorescence. Anal. Chem. 78, 6717–6725. [DOI] [PubMed] [Google Scholar]
- Bungay P. M.; Newton-Vinson P.; Isele W.; Garris P. A.; Justice J. B. (2003) Microdialysis of dopamine interpreted with quantitative model incorporating probe implantation trauma. J. Neurochem. 86, 932–946. [DOI] [PMC free article] [PubMed] [Google Scholar]
- Venton B. J.; Zhang H.; Garris P. A.; Phillips P. E.; Sulzer D.; Wightman R. M. (2003) Real-time decoding of dopamine concentration changes in the caudate-putamen during tonic and phasic firing. J. Neurochem. 87, 1284–1295. [DOI] [PubMed] [Google Scholar]
- Chen K. C.; Budygin E. A. (2007) Extracting the basal extracellular dopamine concentrations from the evoked responses: re-analysis of the dopamine kinetics. J Neurosci Methods 164, 27–42. [DOI] [PubMed] [Google Scholar]
- Halliwell B. (2006) Oxidative stress and neurodegeneration: where are we now?. J. Neurochem. 97, 1634–1658. [DOI] [PubMed] [Google Scholar]
- Chen B. T.; Avshalumov M. V.; Rice M. E. (2002) Modulation of somatodendritic dopamine release by endogenous H2O2: susceptibility in substantia nigra but resistance in VTA. J. Neurophysiol. 87, 1155–1158. [DOI] [PubMed] [Google Scholar]
- Avshalumov M. V.; Chen B. T.; Marshall S. P.; Pena D. M.; Rice M. E. (2003) Glutamate-dependent inhibition of dopamine release in striatum is mediated by a new diffusible messenger, H2O2. J. Neurosci. 23, 2744–2750. [DOI] [PMC free article] [PubMed] [Google Scholar]
- Mehdi M. Z.; Azar Z. M.; Srivastava A. K. (2007) Role of receptor and nonreceptor protein tyrosine kinases in H2O2-induced PKB and ERK1/2 signaling. Cell Biochem. Biophys. 47, 1–10. [DOI] [PubMed] [Google Scholar]
- Huang C. L.; Huang N. K.; Shyue S. K.; Chern Y. (2003) Hydrogen peroxide induces loss of dopamine transporter activity: a calcium-dependent oxidative mechanism. J. Neurochem. 86, 1247–1259. [DOI] [PubMed] [Google Scholar]
- Avshalumov M. V.; Patel J. C.; Rice M. E. (2008) AMPA receptor-dependent H2O2 generation in striatal medium spiny neurons but not dopamine axons: one source of a retrograde signal that can inhibit dopamine release. J Neurophysiol. 100, 1590–1601. [DOI] [PMC free article] [PubMed] [Google Scholar]
- Lee C. R.; Witkovsky P.; Rice M. E. (2011) Regulation of Substantia Nigra Pars Reticulata GABAergic Neuron Activity by H2O2 via Flufenamic Acid-Sensitive Channels and K(ATP) Channels. Front. Syst. Neurosci. 5, 14. [DOI] [PMC free article] [PubMed] [Google Scholar]
- Caouette D.; Dongmo C.; Berube J.; Fournier D.; Daleau P. (2003) Hydrogen peroxide modulates the Kv1.5 channel expressed in a mammalian cell line. Naunyn-Schmiedeberg's Arch. Pharmacol. 368, 479–486. [DOI] [PubMed] [Google Scholar]
- Martel P.; Leo D.; Fulton S.; Berard M.; Trudeau L. E. (2011) Role of Kv1 potassium channels in regulating dopamine release and presynaptic D2 receptor function. PLoS One 6, e20402. [DOI] [PMC free article] [PubMed] [Google Scholar]
- Sheng Z. H.; Rettig J.; Cook T.; Catterall W. A. (1996) Calcium-dependent interaction of N-type calcium channels with the synaptic core complex. Nature 379, 451–454. [DOI] [PubMed] [Google Scholar]
- Roberts J. G.; Lugo-Morales L. Z.; Loziuk P. L.; Sombers L. A. (2013) Real-time chemical measurements of dopamine release in the brain. Methods Mol. Biol. 964, 275–294. [DOI] [PMC free article] [PubMed] [Google Scholar]
- Paxinos G.; Watson C.. The rat brain in stereotaxic coordinates, 5th ed.; Elsevier Academic Press: London, 2005.