Abstract
The applicability of microbore ultrahigh performance liquid chromatography (UHPLC) with electrochemical detection for offline analysis of a number of well-known neurotransmitters in less than 10 μL microdialysis fractions is described. Two methods are presented for the analysis of monoamine or amino acid neurotransmitters, using the same UHPLC instrument. Speed of analysis of noradrenaline (NA), dopamine (DA), serotonin (5-HT), and the metabolites homovanillic acid (HVA), 5-hydroxyindole aceticacid (5-HIAA), and 3,4-dihydroxyphenylacetic acid (DOPAC) was predominated by the retention behavior of NA, the nonideal behavior of matrix components, and the loss in signal of 5-HT. This method was optimized to meet the requirements for detection sensitivity and minimizing the size of collected fractions, which determines temporal resolution in microdialysis. The amino acid neurotransmitters glutamate (Glu) and γ-aminobutyric acid (GABA) were analyzed after an automated derivatization procedure. Under optimized conditions, Glu was resolved from a number of early eluting system peaks, while the total runtime was decreased to 15 min by a 4-fold increase of the flow rate under UHPLC conditions. The detection limit for Glu and GABA was 10 nmol/L (15 fmol in 1.5 μL); the monoamine neurotransmitters had a detection limit between 32 and 83 pmol/L (0.16–0.42 fmol in 5 μL) in standard solutions. Using UHPLC, the analysis times varied from 15 min to less than 2 min depending on the complexity of the samples and the substances to be analyzed.
Keywords: Microdialysis, neurotransmitters, UHPLC, glutamate, GABA, noradrenaline, dopamine, serotonin, metabolites, electrochemical detection
Microdialysis of neurotransmitters in vivo has become an invaluable tool to study neurotransmission in the living brain. Extracellular fluid of the brain is sampled via a microdialysis probe and fractions are collected for further analysis. HPLC in combination with electrochemical detection is often used to analyze brain neurotransmitters and metabolites.1,2 The indolamines, catecholamines, and metabolites are electrochemically active and are detectable with high sensitivity without the need for derivatization. The amino acid neurotransmitters can be detected after derivatization using the same instrumentation.3
Method requirements for analysis of neurotransmitters in microdialysis samples are challenging for a few reasons. There is a growing interest for collecting smaller fractions as this results in a better temporal resolution of the microdialysis experiment. Typical flow rates in microdialysis are 1–2 μL/min, decreasing the fraction size to a few microliters would enable a temporal resolution of a few minutes. The concentrations of NA, DA and 5-HT in microdialysis fractions can be below 100 pmol/L. In combination with a small sample volume of a few microliters, this requires an extremely low limit of detection (LOD) down to the range of 0.1–0.5 fmol on-column.1−10
The concentrations of the metabolites DOPAC, HVA and 5-HIAA are usually considerably higher (about 100–1000 times), which places another challenge on the analytical method. The peak resolution should be sufficient to enable quantification of the minor peaks next to the major metabolite peaks. Finally, the analysis should be completed within an acceptable run time. This is particularly complicated by differences in polarity of the substances of interest. Using reversed-phase ion-pairing chromatography, the ratio of retention times of NA and 5-HT is usually about 1:9. Too much retention for NA would easily lead to long runtimes because of the late eluting 5-HT.
The analysis of Glu and GABA using HPLC with ECD has been well documented.11−14 Since these substances are not natively electrochemically active, they are derivatized prior to detection. One of the commonly applied derivatization agents is ortho-phthalaldehyde (OPA). In the presence of a sulfite group, an N-alkyl 1-isoindole sulfonate derivative is formed that appears to be more stable than derivatives formed with thiols.15 The precolumn derivatization reaction takes place in seconds, and is therefore particularly suitable for online automation.16,17
The OPA derivatization products of Glu and GABA are separated using reversed-phase chromatography without the use of an ion-pairing reagent. A number of peaks from the OPA reagent elute at the beginning of the chromatogram, and Glu has to be resolved from these system peaks. The retention time of GABA is about twice as long and a few other late eluting peaks appear after GABA. Rea et al. concluded in their work that a large capacity factor for GABA is important to avoid coelution with other peaks.18 They were using standard HPLC with fluorescence detection of OPA/β-mercaptoethanol derivatization products. We therefore optimized our method to have a large capacity factor for GABA, but within an acceptable run time by increasing the flow rate in UHPLC.
Over the years, many papers have appeared on improving the speed of separations, or analyzing small sample volumes at low detection limits.1−10 The goal of this study was to develop a simple, fast UHPLC method for the monoamine neurotransmitters, and their metabolites. Using the same UHPLC instrument, a fast and automated online derivatization method for simultaneous analysis of Glu and GABA has also been developed.
Results and Discussion
UHPLC is characterized by extremely efficient separations in a short period of time. Plate numbers of more than 200 000/m can be obtained using columns with sub-2-μm particles.19 As a consequence, the HPLC flow path has to be optimized to minimize extra-column peak broadening as it can become a bottleneck in getting the best possible separation performance. Peak broadening has been described20,21 as the sum of all individual dispersion contributions (σtot2) from injection (σinj2), tubing (σtub2), column (σcol2),and detection (σdet2).
Therefore, connecting tubing from injector to column to flow cell was made from precut pieces of 250 × 0.075 mm PEEKSIL, to avoid unnecessary dead volume. Injection volume and volume of the detection flow cell were taken into account as well. In all cases, a 1–5 μL injection volume was used, and the detection cell volume of the amperometric flow cell was about 10 nL (VT03 with 0.7 mm electrode) or 100 nL (Sencell, with 2 mm electrode). The use of a low pass noise filter of the detector is limited. By design, low pass frequency filters will attenuate high frequency signals including narrow peaks. As a rule of thumb, the maximum allowed filter setting is directly proportional to retention time and inversely proportional to the square root of the column efficiency given by the number of theoretical plates (N).22 A relatively light detector noise filter of 0.5–0.1 Hz was used, or the raw data were sampled at 10 Hz data rate and processed after acquisition using a Savitsky-Golay filter using Clarity software.
Analysis of NA, DA, 5-HT, and Metabolites DOPAC, HVA, 5-HIAA
Microdialysate samples are 100% aqueous with a high concentration of chloride salts (about 150 mmol/L). We used an offline setup where dialysate samples are collected and stored for later analysis. Collected fractions are usually acidified and in some cases an antioxidant is added.2,23 Other authors report adding either formic acid, acetic acid, or citric acid in combination with ascorbic acid or another antioxidant.23 In our experience, the type and concentration of preservative depends on the method and duration of sample storage. When optimizing a method, these additional sample matrix constituents have to be taken into account as a number of matrix peaks elute close to the solvent front and others elute elsewhere in the chromatogram.
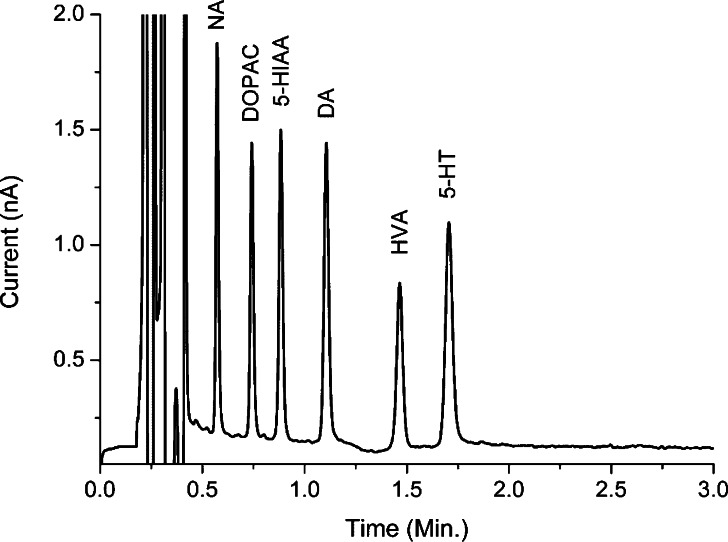
The monoamine neurotransmitters and their metabolites are polar substances, and ion pairing chromatography on C18 columns is typically used for separation. In addition to the ion pairing reagent concentrations, the modifier percentages and pH affect separation, which is well documented in literature.1,24,25 One of the challenges associated with analyzing microdialysis samples is to separate the fast eluting NA peak from the front peaks and keep the late eluting 5-HT within a reasonable retention time. We found that an analysis time less than 2 min is feasible for all standards (diluted in mobile phase) using UHPLC by increasing the flow rate significantly (Figure 1). A flow rate of 600 μL/min was applied using an Inertsil ODS-4 column of 7.5 cm length and 2.1 mm i.d. (2 um particle size) with a system pressure of 463 bar.
Figure 1.
Analysis of 5 μL of a 100 nmol/L standard containing NA, DA, 5-HT, DOPAC, 5-HIAA, and HVA in 10 mmol/L acetic acid. An Inertsil ODS-4 75 × 2.1 mm i.d. (2 μm particle size) column was used (GL Sciences). Flow rate was 600 μL/min, the pressure was 463 bar, and column temperature was set to 45 °C; see Methods for further details.
However, we also found there is a trade-off in analysis time versus detection limit and resolution when analyzing biological samples, or using Ringer’s solution in the sample solution (see Methods for composition of Ringer’s solution). Speeding up a standard HPLC analysis with a factor 2–4 (from 50 to 100 or 200 μL/min) using UHPLC columns is feasible, but the applicability depends on sample matrix and injection volume. At higher velocities, a few things limit performance. One of the most critical was the analysis of NA, which is close to the solvent front. At high flow rates, peaks overlapped or disappeared in the front. Plate number decreased at higher flow rates, not according to the expected behavior under UHPLC conditions. We assume this is due to nonideal behavior of high concentration matrix components eluting in the front peak. An improvement in resolution was found when using smaller injection volumes; however, this resulted in a loss of detection sensitivity. Also, we observed that the 5-HT peak considerably decreased at elevated flow rates and under certain conditions, even completely disappeared.
Another limitation to the application of high flow rates is the inability to apply the full strength of a low pass noise filter for the early eluting peaks. Filter settings below 0.1 Hz effectively reduce noise but could not be used as the peaks were attenuated as well. Under the elevated flow rate conditions of Figure 1, detection limits of around 150–400 pmol/L were found for the monoamines and metabolites.
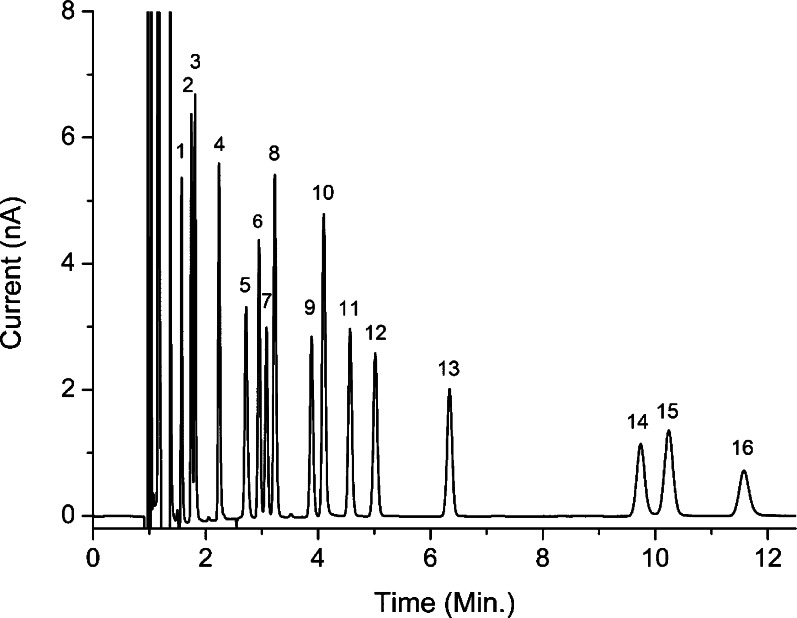
Of several columns that were evaluated, a choice was made for the Waters Acquity BEH C18. This column showed excellent peak performance, and plate numbers of more than 200 000/m were obtained for most components. The mobile phase was optimized for separation of the monoamines and metabolites (Figure 2). At a flow rate of 50 μL/min, NA eluted at 2.2 min and is well resolved from the sample matrix peaks, whereas 5-HT eluted at a retention time of 9.7 min. The relative standard deviation (RSD) in peak area was between 2 and 4.5% for the low standard concentrations (1 nmol/L) and was between 0.3 and 0.9% for the high standard concentration (10 nmol/L) with the exception of L-DOPA (RSD 2.3%), which eluted close to the solvent front. Linearity was investigated in the range of 0.1–4 nmol/L and showed a correlation coefficient r of 0.997–0.999. Detection limits of NA, DA, L-DOPA, HVA, and 5-HIAA were between 30 and 50 pmol/L with a signal-to-noise ratio of 3. The LOD of the late eluting 5-HT was 83 pmol/L (Table 1).
Figure 2.
Analysis of 2 μL of a 100 nmol/L mixture of 16 neurotransmitters and related substances in Ringer’s solution acidified with 10 mmol/L acetic acid. The mixture consists of (1) VMA, (2) MOPEG, (3) L-DOPA, (4) NA, (5) A, (6) DOPAC, (7) 3-OMD, (8) 3,4-DHBA, (9) NM, (10) 5-HIAA, (11) DA, (12) M, (13) HVA, (14) 5-HT, (15) 3-MT, and (16) 5-HMT. A 100 × 1 mm i.d. (1.7 μm particle size) Waters Acquity UPLC BEH C18 column was used; see Methods for further details.
Table 1. Relative Standard Deviation of Peak Areas of Eight Replicate 5 μL Injections of 1 and 10 nmol/L Standardsa.
| peak area, %RSD (n = 8) |
LOD |
||||
|---|---|---|---|---|---|
| 1 nmol/L | 10 nmol/L | linearity, r | cLOD (pmol/L) | on-column (fmol) | |
| NA | 2.7 | 0.7 | 0.999 | 32 | 0.16 |
| DOPAC | 4.5 | 0.5 | 0.998 | 50 | 0.25 |
| 5-HIAA | 2.0 | 0.3 | 0.997 | 35 | 0.18 |
| DA | 2.4 | 0.5 | 0.999 | 42 | 0.21 |
| HVA | 3.1 | 0.6 | 0.999 | 47 | 0.23 |
| 5-HT | 3.2 | 0.9 | 0.998 | 83 | 0.42 |
Linearity was evaluated for concentrations of 0.1, 0.2, 0.5, 1, 2, and 4 nmol/L of standards. Correlation coefficient is given as r, after standard (unweighted) linear regression. Limits of detection are calculated from a signal to noise ratio of 3.
Loadability was evaluated using injections of increasing volume: 0.5, 1.0, 1.5, 2.0, 2.5, and 5.0 μL. Peak heights increased linearly with injection volume, and plate numbers remained constant (around 200 000/m) between 0.5 and 2.5 μL. Using 5 μL injections, NA and L-DOPA showed a decreased plate number of about 160 000 (20% decrease). Under isocratic nonfocusing conditions, loadability is directly proportional to the retention volume and inversely proportional to the square root of the plate number. Under such conditions, the loadability for fast eluting peaks such as L-DOPA and NA is smaller compared to peaks later in the chromatogram. Only under stacking conditions can larger injection volumes be applied without a significant decrease in plate number, as described by Mills et al.8 Nevertheless, given the improvement in peak height and the acceptable decrease in plate number, an injection volume of 5 μL was selected for trace analysis to maximize the mass of the analytes injected.
A user defined injection program has been developed to enable injection of a small volume from dialysate fractions that have only 1 μL excess volume and have been collected in microvials. Using this sequence, 5 μL was injected from a total sample volume of 6 μL. The injection program picks up the 5 μL sample, which is transported to the injection loop using water as transport liquid. During the transport step, the valve is in the “inject” position. By switching the valve to load, the diluted front of the sample is cutoff to waste, and the loop is loaded with the 5 μL sample, which is subsequently injected. The autosampler syringe speed (set to “low”) and aspirated volume of transport solvent are optimized for repeatability and peak performance.
The extremely low limits of detection were feasible by using a sensitive wall-jet amperometric microflow cell. In amperometric detection, only small percentages of the analytes are oxidized because of the relatively small working electrode surface area. However, the noise levels in amperometric cells are accordingly small, resulting in favorable signal-to-noise ratios.27 In addition, the amperometric microflow cell with an effective cell volume between 10 and 100 nL is compatible with microbore HPLC, which is an excellent choice given the small sample size available from the microdialysis fractions.28 Peak dilution over the column typically decreases with the square of the column diameter; as a result, a smaller column diameter results in more signal and overall in a better detection limit.7,20
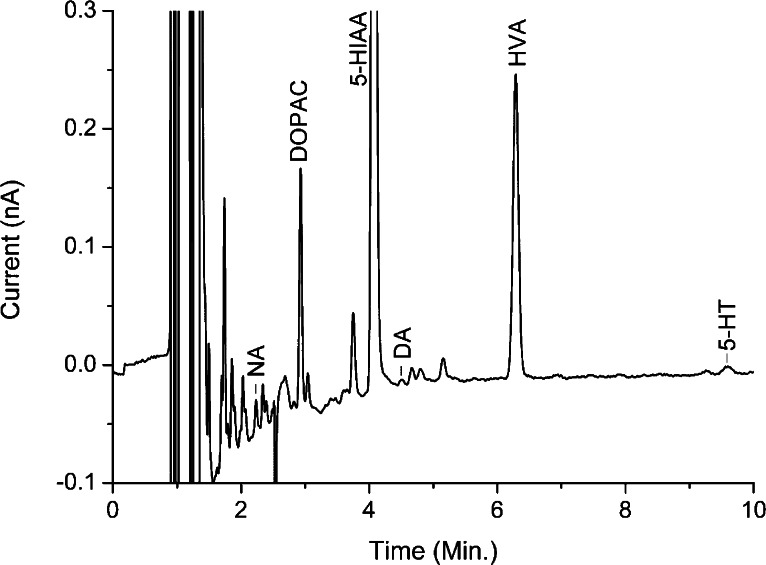
To demonstrate the applicability of the method, analysis of a rat prefrontal cortex dialysate sample is shown in Figure 3. The chromatogram illustrates the before mentioned challenge of having enough resolution to quantify the smaller peaks of the monoamines next to the larger metabolite peaks. All peaks of interest could be analyzed and quantified under the given conditions. However, given the variability inherent in microdialysis samples, it might be necessary to tune the separation for specific analytes. A recent publication by Nguyen et al. nicely demonstrates the relevant parameters to optimize for the separation of monoamines and metabolites in brain tissue.25
Figure 3.
Analysis of 2 μL of rat prefrontal cortex dialysate. Concentrations are calculated against a calibration standard as 0.4 nmol/L NA, 5.8 nmol/L DOPAC, 55.5 nmol/L 5-HIAA, 0.1 nmol/L DA, 10.7 nmol/L HVA, and 0.9 nmol/L 5-HT. A Savitsky-Golay filter setting of 25 was applied to acquire the data (10 Hz data rate) in the data acquisition software. Chromatographic conditions are the same as in Figure 2.
Analysis of Glu and GABA
The analysis of Glu and GABA was based on an automated in-needle derivatization routine as described in the Methods section, followed by a UHPLC separation. Automating the derivatization step prior to the chromatographic run results in a standardization of the time between derivatization and analysis. This is important to rule out lifetime issues of reaction products, although OPA-sulphite derivatives show reasonably good stability over time.13,14,26 In contrast to the method for monoamine neurotransmitters, the capacity of the first peak of interest, the Glu peak, is about 40 and the capacity of GABA is about 80. It is therefore possible (and necessary) to speed up the analysis with a 4-fold elevated flow rate of 200 μL/min resulting in a total analysis time of 15 min.
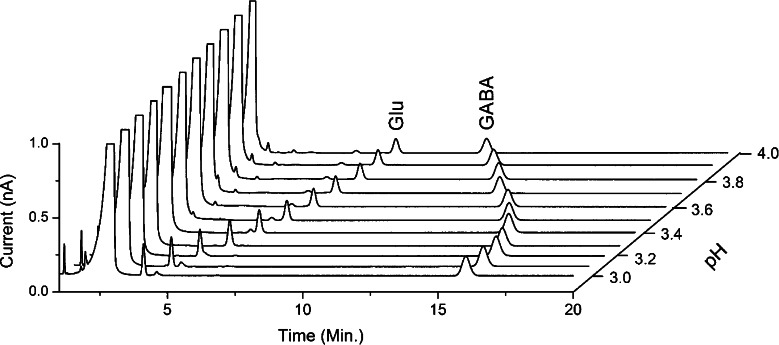
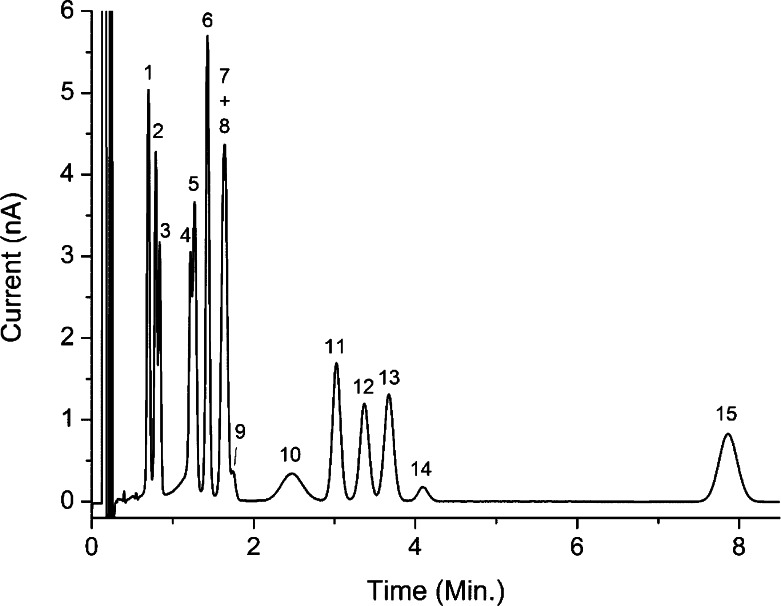
The retention of the Glu and GABA reaction products is primarily affected by pH and the percentages of modifiers. Elution was investigated between pH 3 and 4 at 0.1 pH unit intervals (Figure 4). Increasing the pH resulted in greater retention for GABA, while Glu eluted faster. Although the separation at pH 4 seems favorable for standards, the behavior of other amino acids (Figure 6) and matrix components in a real sample (Figure 5) was taken into account as they might interfere with the Glu or GABA peak. Optimized conditions were found at pH 3.3, 1% acetonitrile and 2% methanol, where Glu and GABA were both separated from the solvent front, which contained a number of reagent peaks from the OPA reaction mixture. A few late eluting peaks were observed between 30 and 50 min, which interfered with consecutive chromatograms in a sequence. Therefore, a short postanalysis step gradient was applied to wash out late eluting peaks. The HPLC solvent switched from 100% A to 100% B containing 60% acetonitrile during 2 min (see Methods). The plate numbers for Glu and GABA were 130 000 and 90 000/m, respectively.
Figure 4.
Analysis of Glu and GABA using mobile phase ranging from pH 3 to 4. An Acquity UPLC, HSS T3 50 × 1 mm i.d. column (1.8 μm particle size) was used. See Methods for other conditions.
Figure 6.
Analysis of 1.5 μL injection of a mixture of 14 amino acids and related substances in water at a concentration of 2.5 μmol/L. Peaks are OPA derivatives of (1) serine, (2) taurine, (3) asparagine, (5) glycine, (6) histidine, (7) aspartate, (8) glutamine, (9) cystine, (10) trans-4-hydroxy-l-proline, (11) alanine, (12) citrulline, (13) glutamate, (14) arginine, and (15) GABA; (4) is an OPA reagent peak.
Figure 5.
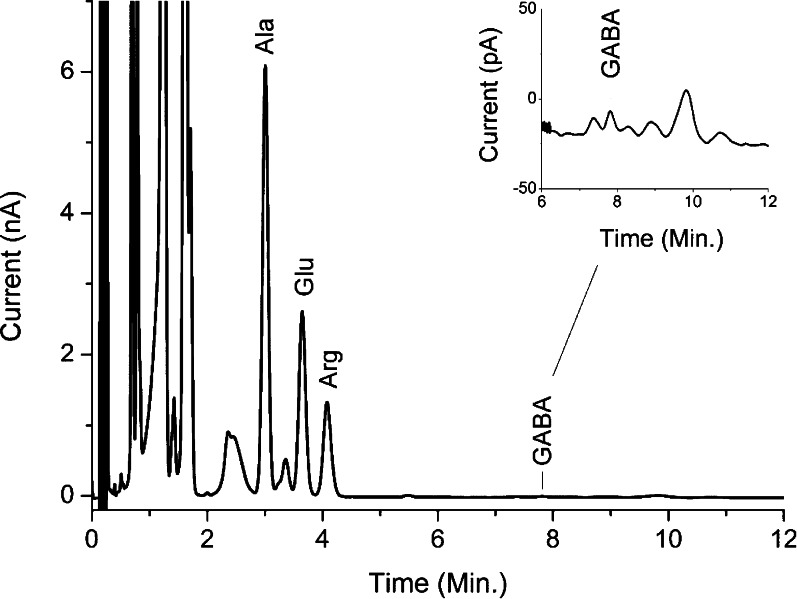
Representative chromatogram of rat prefrontal cortex dialysate after in-needle derivatization with OPA. Inset (top-right side): zoom-in on GABA peak. A Waters Acquity UPLC HSS T3 50 × 1.0 mm i.d. column (1.8 μm particle size) was used at a flow rate of 200 μL/min. See Methods section for other conditions.
There are other ways to handle late eluting peaks, such as allowing a partial overlap of chromatograms. By carefully synchronizing run duration and run start time with the elution times of the late eluting peaks, it should be feasible to have the late eluting peaks appear in a nonrelevant part of consecutive chromatograms. However, because of the risk of different late eluting peaks in samples from different origins, the wash out step was chosen as the preferred approach.
Biologically relevant concentrations can range from 10 to 50 nmol/L for GABA to several μmol/L for Glu,1,3,11−13 depending on the brain region under investigation. The linearity of the method was determined in the concentration ranges of 0.5–2.5 μmol/L and 10–500 nmol/L for Glu and GABA, respectively (Table 2). The method showed linear detector responses with correlation coefficients better than 0.998 for both neurotransmitters. Detection limits were calculated as the concentration resulting in a signal that was 3 times the peak-to-peak noise of the baseline. A limit of detection of 10 nmol/L could be reached for both Glu and GABA under the specified conditions (1.5 μL injections). This corresponds to 15 fmol on-column (Table 2). The total volume that was aspirated from the sample vials in a derivatization/injection procedure was 9 μL.
Table 2. Relative Standard Deviation of Peak Areas of Eight Replicate 1.5 μL Injections of 0.05, 0.50, and 2.5 μmol/L Standardsa.
| peak area, %RSD (n = 8) |
LOD |
|||||
|---|---|---|---|---|---|---|
| 0.05 (μmol/L) | 0.50 (μmol/L) | 2.5 (μmol/L) | linearity, r | cLOD (nmol/L) | on-column (fmol) | |
| Glu | 5 | 2 | 2 | 0.998 | 10 | 15 |
| GABA | 3 | 2 | 0.998 | 10 | 15 | |
The linearity of the method was evaluated in the concentration range of 0.5–2.5 μmol/L for Glu. For GABA, we investigated the high concentration range of 0.1–0.5 μmol/L and the low concentration range of 0.01–0.1 μmol/L. Correlation coefficient is given as r, after standard (unweighted) linear regression, and was 0.998 in all cases. Limits of detection are calculated based on an s/n ratio of 3.
A representative chromatogram showing the separation of Glu and GABA in a rat prefrontal cortex dialysate sample is shown in Figure 5. Using our method, we did not observe indications of coeluting peaks with GABA when optimizing the method for real samples. We did find a few peaks close to GABA, but with a capacity factor of about 80 and a plate number of 6000 we were able to separate GABA sufficiently from surrounding peaks. In principle, this method is applicable to other amino acids as shown in Figure 6. However, chromatographic conditions should be optimized depending on analytes of interest.
Conclusions
Two methods are presented for the analysis of monoamine neurotransmitters and metabolites, and for Glu and GABA using the same UHPLC instrument. The use of UHPLC enabled highly efficient separation and analysis within a reasonable run time. Even difficult combinations of analytes such as NA and 5-HT or Glu and GABA with large differences in retention times could be separated and analyzed within one run. The use of amperometric detection with a wall-jet type flow cell, in combination with microbore HPLC resulted in low limits of detection of monoamine neurotransmitters, between 0.16 and 0.42 fmol on-column. There is a direct relationship between injection volume, limit of detection, and the collection of small fractions for enhanced time resolution in microdialysis experiments. With respect to increased flow rates for faster separations we found there is a trade off in speed of analysis versus detection sensitivity.
In case of the analysis of Glu and GABA in microdialysis fractions, the UHPLC separation could be performed at elevated flow rates to shorten the total run time. Both substances were separated from the solvent front and a 4-fold increase of flow rate was applied. A post separation step-gradient was applied to eliminate late eluting peaks, enabling sequential analysis without delay. An in-needle OPA derivatization procedure was fully automated and standardized the time between derivatization and analysis resulting in a convenient and reproducible method for routine analysis.
Methods
Materials and Methods
Chemicals and Reagents
All chemicals were of HPLC grade where possible; ultrapure water (TOC free and deionized, resistivity >18 MOhm.cm) was produced using a Barnstead EASYpure II system from Thermo Scientific (Marietta, Ohio, United States). Dopamine hydrochloride (DA), d,l-Noradrenaline hydrochloride (NA), epinephrine (A), 3,4-dihydroxybenzylamine hydrobromide (3,4-DHBA), 5-hydroxyindole-3-acetic acid (5-HIAA), and serotonin hydrochloride (5-HT) were purchased from Janssen Chimica (Geel, Belgium). Acetonitrile for HPLC, acetic acid, potassium chloride, l-cysteine, disodium edetate (EDTA), and citric acid were from Acros Organics (Geel, Belgium). Sodium hydroxide 50%, sodium sulfite, sodium octanesulfonate (OSA), γ-aminobutyric acid (GABA), l-glutamic acid (Glu), serine, taurine, asparagine, glycine, histidine, aspartate, glutamine, cystine, trans-4-hydroxy-l-proline, alanine (Ala), citrulline, glutamate, arginine (Arg), d,l-4-hydroxy-3-methoxy-mandelic acid (VMA), 4-hydroxy-3-methoxy-phenylglycol hemipiperazine salt (MOPEG), l-3,4-dihydroxyphenylalanine (L-DOPA), 3,4 dihydroxyphenylacetic acid (DOPAC), 3-methoxy-l-tyrosine monohydrate (3-OMD), normetanephrine hydrochloride (NM), d,l-metanephirine hydrochloride (M), homovanillic acid (HVA), 3-methoxytryamine hydrochloride (3-MT), 5-hydroxy-Nω-methyltryptamine oxalate (5-HMT), and o-phthalaldehyde (OPA) were from Sigma-Aldrich (Steinheim, Germany). Sodium chloride and sodium acetate trihydrate from Baker (Deventer, The Netherlands), calcium chloride hexahydrate from Fluka BioChemika (Steinheim, Germany), and boric acid from were Merck (Darmstadt, Germany).
Preparation of Standard Solutions and Reagents
Stock standard solutions of 1 mmol/L DA, 1 mmol/L NA, and 1 mmol/L 5-HT were prepared in a solution of 100 mmol/L perchloric acid and stored at 4 °C until use. These stock solutions were diluted to the desired concentration with 10 mmol/L acetic acid, and for some tests in perfusion solution acidified with acetic acid (10 mmol/L). The perfusion solution is also known as a modification of Ringer’s solution and contains 1.2 mmol/L calcium chloride, 1.2 mmol/L magnesium chloride, 147 mmol/L sodium chloride, and 3 mmol/L potassium chloride.
Stock standard solutions of 1 mmol/L GABA and 1 mmol/L Glu were prepared in demineralized water and stored at 4 °C until use. These stock solutions were diluted to the desired concentration with water or with the above-described modified Ringer’s solution.
The derivatization procedure and composition of the OPA reagent was modified from Smith and Sharp13 and Beverly et al.14 Briefly, the reagent mixture consists of 37 mmol/L OPA, 50 mmol/L sodium sulfite, 90 mmol/L tetraborate buffer (which was set to pH 10.4 with sodium hydroxide, prior to addition to the reagent), and 5% methanol. The reagent was prepared fresh daily, based on a 100 mmol/L borate buffer stock solution that kept at 4 °C until use. Borate buffer stock was prepared every month.
Chromatographic Instrumentation and Conditions
The ALEXYS neurotransmitter analyzer (Antec, Zoeterwoude, The Netherlands) consists of an AS 110 autosampler, two LC 110S pumps, an OR 110 degasser unit with pulse damper, and the DECADE II electrochemical detector equipped with a Sencell with a 2 mm glassy carbon working electrode. Instrument control and data acquisition are carried out by Clarity chromatography software of Data Apex (Prague, The Czech Republic).
The final chromatographic conditions for analysis of monoamines and metabolites consisted of a Waters Acquity UPLC BEH C18 column (100 × 1 mm i.d., 130 Å, 1.7 μm particle size) from Waters (Milford, MA). The mobile phase consisted of 100 mmol/L phosphoric acid, 100 mmol/L citric acid, 8 mmol/L KCl, 0.1 mmol/L EDTA, 600 mg/L OSA, pH 3.0, and 8% v/v acetonitrile. The system was operated at 50 μL/min at a pressure of 265 bar. An Inertsil ODS-4 75 × 2.1 mm i.d. column with 2 um particle size (GL Sciences Inc., Tokyo, Japan) was evaluated as well, using a mobile phase of 50 mmol/L phosphoric acid, 50 mmol/L citric acid, 0.1 mmol/L EDTA, 600 mg/L OSA, at pH 3.0, with 12% (v/v) acetonitrile.
The autosampler was equipped with an external loop of 1.5 μL (Glu and GABA method) or 5 μL (monoamines and metabolites). An injection volume of 1.5–5 μL was set using a user defined injection program; the temperature of the sample tray in the autosampler was 6 °C. The column and detection temperature were set at 37 °C, and the detection potential was +640 mV vs ISAAC (in situ Ag/AgCl reference electrode). Raw data was collected at a data rate of 10 Hz, at a range setting of 5 nA/V.
For the analysis of Glu and GABA, a Waters (Milford, MA) Acquity UPLC, HSS T3 column (50 × 1 mm i.d., 100 Å, 1.8 μm) was used. The mobile phase (solvent A) consisted of 50 mmol/L phosphoric acid, 50 mmol/L citric acid, and 0.1 mmol/L EDTA at pH 3.3; 1% acetonitrile and 2% methanol were added prior to use. Solvent B, which is applied for post run cleanup of late eluting peaks, is the same mobile phase but using 60% acetonitrile. The system was operated at a flow rate of 200 μL/min at a pressure of 340 bar. For the in-needle derivatization, a 9 μL sample was aspirated followed by 0.5 μL of OPA reagent. Mixing took place by aspirating 12 μL of air to move the mixture further into the autosampler buffer tubing, followed by moving back and forth the mixture three times (10 μL dispense, 10 μL aspirate, 10 μL dispense of air). Full loop injection took place by switching the valve to load and dispense 7 μL, which completely overfilled the 1.5 μL injection loop, followed by switching the valve to inject to start the chromatographic run. After 12 min, a step gradient was programmed switching from 100% solvent A to 100% solvent B. At 14 min, 100% solvent A was applied again and the system was allowed to equilibrate during the derivatization and injection preparation step which takes about 4 min prior to injection. A VT03 microflow cell with a 0.7 mm glassy carbon working electrode was used for detection. The temperature of the detector was set to 40 °C; a working potential of 850 mV (vs Ag/AgCl reference) and a range setting of 50 nA/V were used.
Microdialysis
All animal experimental procedures were carried out in accordance with the governmental guidelines and approved by the Ethical Committee for Animal Research of the Faculties of Pharmaceutical Sciences, Chemistry and Biology at Utrecht University, The Netherlands. The collection and handling of microdialysis samples is described elsewhere.29,30
Author Contributions
HPLC method development by H. J. Brouwer, L. M. van Heerwaarden, and N. J. Reinhoud. Microdialysis experiments and the analysis of 14 amino acids by GAH Korte-Bouws.
The authors declare no competing financial interest.
References
- Sarre S., and Michotte Y. (2007) Liquid chromatographic methods used for microdialysis: an overview. In Handbook of Microdialysis: Methods, Applications and Perspectives, Handbook of Behavioral Neuroscience (Westerink B. H. C., Cremers T. I. F. H., Ed.), 1st ed., Vol. 4, pp 233–250, Academic Press, London. [Google Scholar]
- Bicker J.; Fortuna A.; Alves G.; Falcão A. (2012) Liquid chromatographic methods for the quantification of catecholamines and their metabolites in several biological samples-A review. Anal. Chim. Acta 768, 12–34. [DOI] [PubMed] [Google Scholar]
- Zhang S.; Takeda Y.; Hagioka S.; Takata K.; Aoe H.; Nakatsuka H.; Yokoyama M.; Morita K. (2005) Measurement of GABA and glutamate in vivo levels with high sensitivity and frequency. Brain Res. Brain Res. Protoc. 14, 61–66. [DOI] [PubMed] [Google Scholar]
- Zhang J.; Liu Y.; Jaquins-Gerstl A.; Shu Z.; Michael A. C.; Weber S. G. J. (2010) Optimization for speed and sensitivity in capillary high performance liquid chromatography. The importance of column diameter in online monitoring of serotonin by microdialysis. J. Chromatogr., A 1251, 54–62. [DOI] [PMC free article] [PubMed] [Google Scholar]
- Newton A. P.; Justice J. B. Jr. (1994) Temporal Response of Microdialysis Probes to Local Perfusion of Dopamine and Cocaine Followed with One-Minute Sampling. Anal. Chem. 66, 1468–1472. [DOI] [PubMed] [Google Scholar]
- Wise R. A.; Newton P.; Leeb K.; Burnette B.; Pocock D.; Justice J. B. Jr. (1995) Fluctuations in nucleus accumbens dopamine concentration during intravenous cocaine self-administration in rats. Psychopharmacology (Berlin, Ger.) 120, 10–20. [DOI] [PubMed] [Google Scholar]
- Liu Y.-S.; Zhang J.; Xu X.-M.; Zhao M. K.; Andrews A. M.; Weber S. G. (2010) Capillary ultrahigh performance liquid chromatography with elevated temperature for sub-one minute separations of basal serotonin in submicroliter brain microdialysate samples. Anal. Chem. 82(23), 9611–9616. [DOI] [PMC free article] [PubMed] [Google Scholar]
- Mills M. J.; Maltas J.; Lough W. J. (1997) Assessment of injection volume limits when using on-column focusing with microbore liquid chromatography. J. Chromatogr., A 759, 1.–11. [Google Scholar]
- Caliguri E. J.; Capella P.; Bottari L.; Mefford I. N. (1985) High-speed microbore liquid chromatography with electrochemical detection using 3 micrometer C-18 packing material. Anal. Chem. 57, 2423–2425. [Google Scholar]
- Parrot S.; Neuzeret P. C.; Denoroy L. (2011) A rapid and sensitive method for the analysis of brain monoamine neurotransmitters using ultra-fast liquid chromatography coupled to electrochemical detection. J. Chromatogr., B 879, 3871–3878. [DOI] [PubMed] [Google Scholar]
- Shah A. J.; Crespi; F., Heidbreder C. (2002) Review: Amino acid neurotransmitters: separation approaches and diagnostic value. J. Chromatogr., B 781, 151–163. [DOI] [PubMed] [Google Scholar]
- Jacobs W. A. (1987) o-Phthalaldehyde-sulfite derivatization of primary amines for liquid chromatography-electrochemistry. J. Chromatogr. 392, 435–441. [DOI] [PubMed] [Google Scholar]
- Smith S.; Sharp T. (1994) Measurement of GABA in Rat Brain Microdialysates Using o-phthaldialdehyde Sulphite Derivatization and High- Performance Liquid Chromatography with Electrochemical Detection. J. Chromatogr. 652(2), 228–233. [DOI] [PubMed] [Google Scholar]
- Beverly L.; de Vries M. G.; Bouman S. D.; Arseneau L. M. (2001) Noradrenergic and GABAergic systems in the medial hypothalamus are activated during hypoglycemia. Am. J. Physiol.: Regul., Integr. Comp. Physiol. 280, R563–R569. [DOI] [PubMed] [Google Scholar]
- Rowley H. L.; Martin K. F.; Marsden C. A. (1995) Determination of in vivo amino acid neurotransmitters by high-performance liquid chromatography with o-phthalaldehyde-sulphite derivatization. J. Neurosci. Methods 57, 93–99. [DOI] [PubMed] [Google Scholar]
- Koning H.; Wolf H.; Venema K.; Korf J. (1990) Automated precolumn derivatization of amino acids, small peptides, brain amines and drugs with primary amino groups for reversed-phase HPLC using naphthalenedialdehyde as the fluorogenic label. J. Chromatogr. 533, 171–178. [DOI] [PubMed] [Google Scholar]
- Kehr J. (1998) Determination of glutamate and aspartate in microdialysis samples by reversed-phase column liquid chromatography with fluorescence and electrochemical detection. J. Chromatogr, B 708, 27–38. [DOI] [PubMed] [Google Scholar]
- Rea K.; Cremers T. I.; Westerink B. H. (2005) HPLC conditions are critical for the detection of GABA by microdialysis. J. Neurochem. 94, 672–679. [DOI] [PubMed] [Google Scholar]
- Wang Y.; Ai F.; Ng S. C.; Tan T. T. Y. (2012) Sub-2μm porous silica materials for enhanced separation performance in liquid chromatography. J. Chromatogr., A 1228, 99–109. [DOI] [PubMed] [Google Scholar]
- Slais K.; Kourilova D. (1983) Minimization of extra-column effects with microbore columns using electrochemical detection. J. Chromatogr. 258, 57–63. [Google Scholar]
- Pruss A.; Kempter C.; Gysler J.; Jira T. (2003) Extracolumn band broadening in capillary chromatography. J. Chromatogr., A 1016, 129–141. [DOI] [PubMed] [Google Scholar]
- Slais K. (1987) Electrochemical detectors for low dispersion liquid chromatography. In Electrochemical Detection in Medicine And Chemistry (Parvez H., Bastart-Malsot M., Parvez S., Nagatsu T., and Carpentier G., Eds.), pp 53–94, VNU Science Press, Utrecht, The Netherlands. [Google Scholar]
- Thorre K.; Pravda M.; Sarre S.; Ebinger G.; Michotte Y. (1997) New antioxidant mixture for long term stability of serotonin, dopamine and their metabolites in automated microbore liquid chromatography with dual electrochemical detection. J. Chromatogr., B 694, 297–303. [DOI] [PubMed] [Google Scholar]
- Ikarashi Y.; Maruyama Y. (1985) Determination of catecholamines, indoleamines, and related metabolites in rat brain with liquid chromatography with dual electrochemical detection. Biog. Amines 2, 101–110. [Google Scholar]
- Nguyen A. T.; Aerts T.; Van Dam D.; De Deyn P. P. (2010) Biogenic amines and their metabolites in mouse brain tissue: Development, optimization and validation of an analytical HPLC method. J. Chromatogr., B 878, 3003–3014. [DOI] [PubMed] [Google Scholar]
- Monge-Acuña A. A.; Fornaguera-Trías J. (2009) A high performance liquid chromatography method with electrochemical detection of gamma-aminobutyric acid, glutamate and glutamine in rat brain homogenates. J. Neurosci. Methods 183(2), 176–181. [DOI] [PubMed] [Google Scholar]
- Morgan D. M.; Weber S. G. (1984) Noise and signal-to-noise ratio in electrochemical detectors. Anal. Chem. 56, 2560–2567. [DOI] [PubMed] [Google Scholar]
- Cheng F. C.; Kuo J. S. (1995) Review, HPLC analysis with electrochemical detection of biogenic amines using microbore columns. J. Chromatogr., B 665, 1–13. [DOI] [PubMed] [Google Scholar]
- Prins J.; Westphal K. G.; Korte-Bouws G. A.; Quinton M. S.; Schreiber R.; Olivier B.; Korte S. M. (2011) The potential and limitations of DOV 216,303 as a triple reuptake inhibitor for the treatment of major depression: a microdialysis study in olfactory bulbectomized rats. Pharmacol., Biochem. Behav. 97, 444–452. [DOI] [PubMed] [Google Scholar]
- Prins J.; Denys D. A.; Westphal K. G.; Korte-Bouws G. A.; Quinton M. S.; Schreiber R.; Groenink L.; Olivier B.; Korte S. M. (2010) The putative antidepressant DOV 216,303, a triple reuptake inhibitor, increases monoamine release in the prefrontal cortex of olfactory bulbectomized rats. Eur. J. Pharmacol. 633, 55–61. [DOI] [PubMed] [Google Scholar]


