Abstract
Magnetic resonance imaging has been widely used in speech production research. Often only one image stack (sagittal, axial, or coronal) is used for vocal tract modeling. As a result, complementary information from other available stacks is not utilized. To overcome this, a recently developed super-resolution technique was applied to integrate three orthogonal low-resolution stacks into one isotropic volume. The results on vowels show that the super-resolution volume produces better vocal tract visualization than any of the low-resolution stacks. Its derived area functions generally produce formant predictions closer to the ground truth, particularly for those formants sensitive to area perturbations at constrictions.
Introduction
Magnetic resonance imaging (MRI) has been widely used in speech production research for vocal tract reconstruction and modeling. Based on the obtained magnetic resonance (MR) images, the vocal tract shapes were reconstructed, and then area functions or three-dimensional (3D) vocal tract models were built. Although multi-plane scanning may have been performed, only one MR image stack (sagittal, coronal, or axial) is usually used for the vocal tract reconstruction. For example, sagittal stacks were used by Narayanan et al. (1997); Takemoto et al. (2006), coronal slices used by Dang et al. (1994), and axial slices used by Story et al. (1996). However, due to constraints (time, money, and subject endurance) in MRI scanning, each image stack typically has an in-plane resolution which is much better than the out-of-plane resolution. So the mid-sagittal tongue shape is better visualized in the sagittal stack; a pharyngeal constriction is better visualized in the axial stack; and an oral cavity constriction may be more accurately estimated from the coronal stack. As a result, using only one image stack to reconstruct the vocal tract shape is not optimal when extra information is available from other image stacks.
It has been shown that combining orthogonal image stacks help the measurement of vocal tract shape. Narayanan et al. (1995) extracted the area functions in the front and back regions from the coronal stacks and the axial stacks, respectively. Baer et al. (1991) and Zhou et al. (2008) overlaid coronal and axial stacks for a better segmentation of the vocal tract. However, these manual combination approaches are empirical and not systematically evaluated. To the best of our knowledge, there is no prior work on automatically integrating orthogonal stacks into one unified volume for vocal tract modeling.
The goal of this study was to apply a recently developed super-resolution image reconstruction technique from our group (Woo et al., 2012) to automatically integrate multiple orthogonal stacks together for improving vocal tract reconstruction and modeling. This technique can combine orthogonal low-resolution stacks into one isotropic super-resolution volume which has already been demonstrated to improve the visualization and the peak signal-to-noise ratio of the tongue volume (Woo et al., 2012).
To assess this technique in vocal tract modeling, we obtained the ATR MRI database of Japanese vowel production1 and, due to its high image resolution, treated its MR stacks as the ground truth of vocal tracts. Then, from each original stack, we simulated three orthogonal stacks (sagittal, coronal, and axial) with a typical low-resolution used for cine-MRI or real-time MRI in speech production research and applied the super-resolution technique on them to generate a corresponding super-resolution volume. Assuming the original MR data is the ground truth, we compared the vocal tract area functions derived from high- (original), low- (simulated), and super-resolutions (multiplanar reconstructions), respectively.
In the rest of this paper, we first describe the MRI database and our methodologies in Sec. 2. Then in Sec. 3 we compare the vocal tract visualizations and the area function vocal tract models between the low-resolution stacks and the super-resolution volumes. A brief discussion is given in Sec. 4. Finally, a summary is presented in Sec. 5.
Database and methodologies
MR database
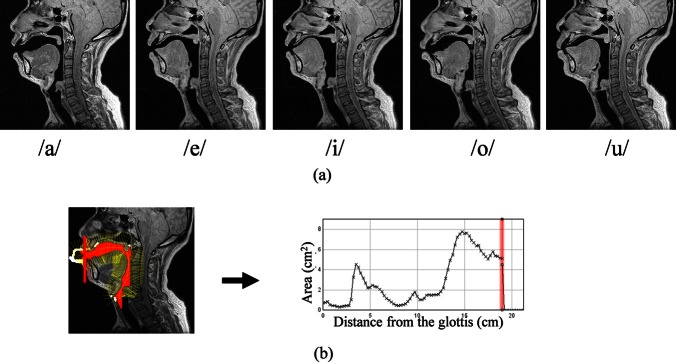
The ATR MRI database of Japanese vowel production contains MR sagittal stacks for five sustained vowel productions (/a/, /e/, /i/, /o/, and /u/). The mid-sagittal MR images of these five sounds are shown in Fig. 1a. The reasons for using this database are twofold. First, the MR stacks have a high image resolution (an in-plane resolution of 0.5 mm per pixel and a slice thickness of 2 mm), so they can be used as ground truth for each vowel vocal tracts. Second, the MR image data are supplemented with teeth, thus making teeth compensation easy and extraction of the vocal tract shape precise. There is an interleaving between “bright” slices and “dark” slices in the original MR stacks. This was caused by the gradually weaker slice intensity in the order of imaging. We fixed this issue by scaling the intensity of each slice separately so that the intensity profiles across slices in the brain region were smoothed. The scaling factors were computed by an algorithm to minimize the sum of squared errors between the adjacent slices (Schmidt, 2005).
Figure 1.

(Color online) Mid-sagittal MR images and area function extraction. (a) Original mid-sagittal images of the five vowels. (b) From grid lines to area function (left: Grid lines; right: The extracted area function).
Simulated orthogonal low-resolution MR stacks
By down-sampling the original MR data in the ATR MRI database, we simulated three orthogonal low-resolution stacks (sagittal, coronal, and axial) for each vowel. The simulated stacks have an in-plane resolution of 2 mm per pixel and a slice thickness of 6 mm, which mimics the resolution in our cine-MR data. Prior to down-sampling the original volumes in slice-selection directions, Gaussian filtering with σ = 0.5 (in-plane) and σ = 2 (slice-selection direction) was applied to avoid an anti-aliasing effect.
Super-resolution reconstruction technique
As each simulated low-resolution stack has an in-plane resolution which is much better than the out-of-plane resolution (2 vs 6 mm), the information contained in the three low-resolution stacks is complementary. Intuitively, integrating the three low-resolution stacks into one would be better for modeling than using only one of the low-resolution stacks. The super-resolution technique recently developed (Woo et al., 2012) and applied here integrates three orthogonal low-resolution stacks and generates one isotropic super-resolution volume. It is a maximum a posteriori-Markov random field based reconstruction method. It incorporates edge-preserving regularization to improve the signal-to-noise ratio and resolution and yields superior image qualities compared with other reconstruction methods as visually and quantitatively assessed. In addition, image registration is performed in this technique to correct any possible head motions between acquisitions of different image stacks. The resulting voxel resolution in the super-resolution volume here is 2 × 2 × 2 mm, three times that in the low-resolution volume.
Vocal tract segmentation and area function models
We extracted and compared the area functions derived from the low-resolution volumes and the super-resolution volume, respectively. In our data preprocessing procedure, each volume was up-sampled isotropically at 0.5 mm intervals using the spline interpolation method. This was to make the MR images (especially in low-resolution) smoother and to make all the volumes with the same number of pixels. Afterwards every volume was overlaid with the teeth data for compensation. The teeth positions are already provided for each vowel in the ATR database. Then there are two steps for deriving the vocal tract area functions: Airway segmentation and grid line determination. We performed the airway segmentation using thresholding at gray values that are approximately halfway from the air to the tissue near the boundary. Manual correction was also performed at our best guess in a few regions with over-segmentation (such as regions with teeth) or under-segmentation (such as palatal constriction in /i/ or constrictions at the larynx). As illustrated in Fig. 1b, we used a centerline method (Takemoto et al., 2006) to determine the grid lines for the area function extraction. For simplicity, the piriform sinuses and interdental spaces were excluded in the vocal tract models. For comparison purposes, the same set of grid lines were used for all the image volumes of the same sound. With the obtained area functions, we calculated their corresponding acoustic responses using our matlab-based software VTAR.
Results
Vocal tract visualization in super-resolution volume
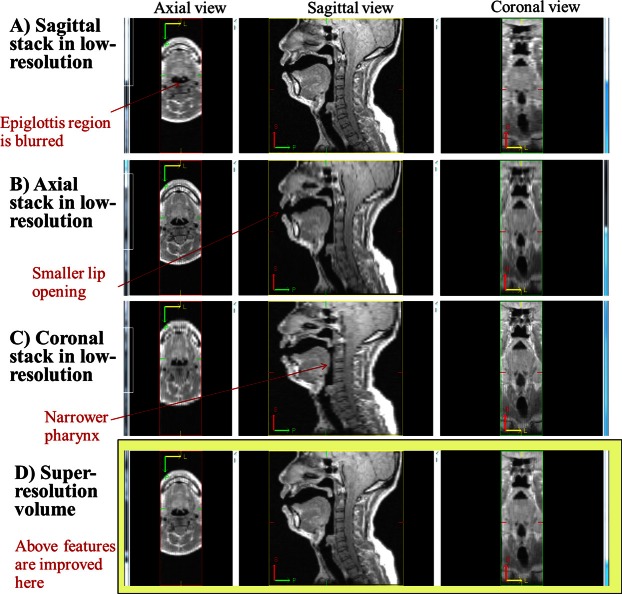
Using the vowel /a/ as an example, Fig. 2 shows the 3D views of the three low-resolution stacks and the super-resolution volume, respectively. Due to the large slice thickness (6 mm), detailed vocal tract structures in the low-resolution stacks might be blurred or distorted along the scanning direction. For example, as shown in Fig. 2, the epiglottis region is blurred in the sagittal stack [Fig. 2A], the lip opening smaller in the axial stack [Fig. 2B], and the pharyngeal region narrower in the coronal stack [Fig. 2C]. But these above mentioned issues in the low-resolution stacks are improved in the super-resolution volume [Fig. 2D] because its volume resolution is three times the low-resolution. So, as expected, the super-resolution volume provides better vocal tract visualization than any of the three low-resolution stacks. This improvement of vocal tract visualization in the super-resolution volume may help us better understand the roles of detailed structures in speech production.
Figure 2.
(Color online) 3D views of image stacks in simulated low-resolution (2 × 2 × 6 mm) or super-resolution (2 × 2 × 2 mm) (from left to right: Axial, sagittal, and coronal views). (A) Simulated sagittal stack, (B) simulated axial stack, (C) simulated coronal stack, and (D) super-resolution volume.
Vocal tract area functions and the corresponding acoustic responses
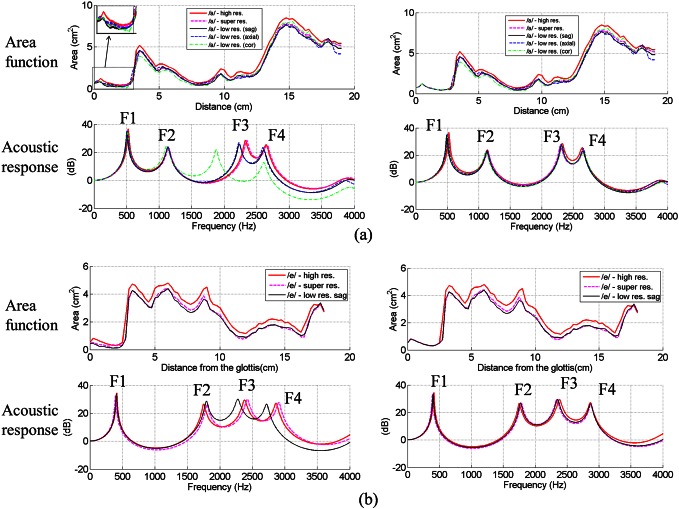
Figures 34 show the extracted area functions and the corresponding acoustic responses for the five vowels. For each vowel, area functions were extracted from MR data in high resolution, low-resolution, and super-resolution, respectively. The results from high resolution data are regarded as the vocal tract ground truth. For the vowel /a/ [Fig. 3a], area functions from three orthogonal low-resolution stacks were extracted respectively. The coronal low-resolution stack produces a relatively large area in the front but a relatively small area in the back compared to the other two low-resolution stacks. The axial stack is the opposite. The sagittal stack and the super-resolution volume produce areas mostly in between. For other vowels, we did not extract area functions from low-resolution coronal or axial stacks, since constrictions for those vowels might not be visible in those two stacks. For example, the constriction in the front for /i/ is not visible in the coronal and axial stacks.
Figure 3.
(Color online) Area functions of /a/ and /e/ and their corresponding acoustic responses. (a) /a/ and (b) /e/. Right side: Area functions are extracted from MR data, and the left side: Area functions are the same as the left side, except that the pharynx regions are made the same as the ground truth, indicated by the thick solid line.
Figure 4.
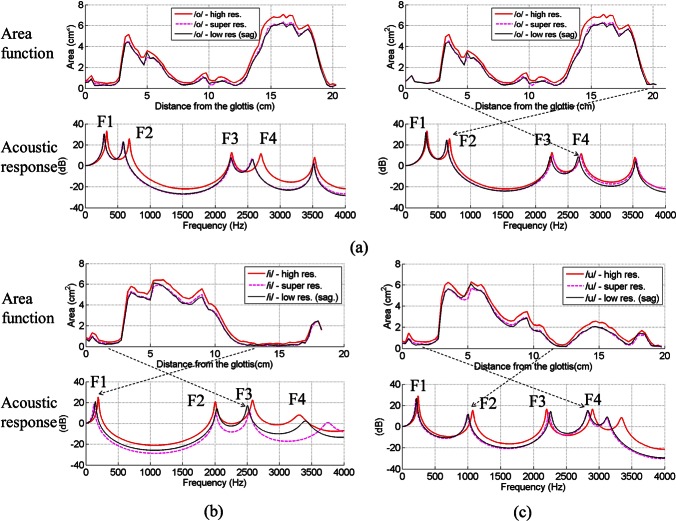
(Color online) Area functions of /o/, /i/, /u/ and their corresponding acoustic responses. (a) /o/ (left side: Area functions are extracted from MR, right side: Area functions are the same as in the left side, except that the pharynx and lip regions are made the same as the ground truth, indicated by the thick solid line, (b) /i/ and (c) /u/ (the dashed lines connect the region in the area function with the affected formant in the acoustic response).
Although the area functions from low-resolution stacks and super-resolution volumes have small differences, the super-resolution data in the vowels /a/ and /e/ (Fig. 3) produce formant patterns closer to the ground truth than the low-resolution data, specifically for the higher formants F3 and F4. These F3 and F4 differences are due to the area differences in the laryngeal cavity. When the area functions in the pharyngeal region are replaced with the ground truth, the acoustic responses are corrected to be almost identical to the ground truth. So the super-resolution data produces better area estimation in the laryngeal cavity, which leads to a better prediction of F3 and F4. The reason why we looked into the laryngeal constriction can be explained by how the formants are shifted with an area change. The formants change can be described as
| (1) |
where is the change of the nth formant , is the sensitivity function of (Story, 2006), and is the change of the ith section area . Section 1 is the first section starting from the glottis, and N is the last section number at the lips. An area change will lead to a much larger relative change in those constrictions. Based on Eq. 1, this large will accordingly affect those formants with a large sensitivity Sn in that constriction.
For the vowel /o/ [Fig. 4a], there is not much difference in formants between the outputs from the super-resolution data and the low-resolution data. Replacing the areas of the pharynx with the ground truth corrects F4 and replacing the areas in the lip region with the ground truth corrects F2. For the vowels /i/ and /u/ [Figs. 4b, 4c], the difference in formants between the outputs from the super-resolution data and the low-resolution data is also small. While replacing the laryngeal constriction with the ground truth corrects the formant errors, the errors are much smaller in these two high vowels because the pharynx is relatively larger and the area error is a smaller percentage (smaller ). As indicated in Figs. 4b, 4c, replacing the tongue constrictions with ground truth will correct F1 for /i/ and F2 for /u/.
The area differences across the MRI volumes are caused by the different voxel resolutions. The reason why the super-resolution technique helps with vowels /a/ and /e/ might be that vowels /a/ and /e/ have relatively small areas in the laryngeal cavities and the super-resolution technique makes that part better segmented compared to the cases in low-resolution volumes. For high vowels /i/ and /u/, the advantages of the super-resolution volumes are not apparent, which is probably related to their relatively large areas (smaller ) at pharynx.
Discussion
Our results indicate that in order to have formant predictions close to the ground truth, it is crucial for the vocal tract model to get accurate areas at the constrictions. This is because even a small area change in constriction might lead to a large percentage change in area and it will affect those formants sensitive to that area perturbation. The super-resolution volume does help measure the areas in the laryngeal cavity for low vowels (/a/ and /e/), but cannot improve measurements of structures that are smaller than the voxel resolution. A more advanced algorithm to segment the airway, such as those based on deformable models, might calculate narrow regions more accurately. A non-uniform sampling rate applied to MRI acquisition might allow a higher number of samples to be applied to regions that need a higher voxel resolution.
Summary
Through integrating information from multiple orthogonal low-resolution MR stacks, a super-resolution volume can provide better vocal tract visualization than any one of the low-resolution MR stacks. Overall, area functions derived from the super-resolution volumes produce better prediction of formants, particularly when those formants are sensitive to area perturbations at constrictions (such as the laryngeal cavity). However, phonetic qualities (F1 and F2) of vowels in area functions are not affected by the low image resolution. Our results also suggest that applying more advanced methods in segmentation or imaging to get accurate areas in constrictions may improve vocal tract modeling accuracy.
Acknowledgments
This work was supported by a grant from the National Institutes of Health (Grant No. R01CA133 015). The authors would like to thank Dr. Emi Murano at Johns Hopkins University for her comments and Dr. Tatsuya Kitamura at Konan University for sharing his area function extractor.
Footnotes
The ATR MRI database of Japanese vowel production was acquired at and released from ATR Human Information Science Laboratories. The use of the database is under the license agreement with ATR-Promotions Inc.
References and links
- Baer, T., Gore, J. C., Gracco, L. C., and Nye, P. W. (1991). “ Analysis of vocal tract shape and dimensions using magnetic resonance imaging: Vowels,” J. Acoust. Soc. Am. 90, 799–828. 10.1121/1.401949 [DOI] [PubMed] [Google Scholar]
- Dang, J. W., Honda, K., and Suzuki, H. (1994). “ Morphological and acoustical analysis of the nasal and the paranasal cavities,” J. Acoust. Soc. Am. 96, 2088–2100. 10.1121/1.410150 [DOI] [PubMed] [Google Scholar]
- Narayanan, S. S., Alwan, A. A., and Haker, K. (1995). “ An articulatory study of fricative consonants using magnetic-resonance-imaging,” J. Acoust. Soc. Am. 98, 1325–1347. 10.1121/1.413469 [DOI] [Google Scholar]
- Narayanan, S. S., Alwan, A. A., and Haker, K. (1997). “ Toward articulatory-acoustic models for liquid approximants based on MRI and EPG data. Part I. The laterals,” J. Acoust. Soc. Am. 101, 1064–1077. 10.1121/1.418030 [DOI] [PubMed] [Google Scholar]
- Schmidt, M. (2005). “ A method for standardizing MR intensities between slices and volumes,” Technical Rep. TR05-14, University of Alberta, Edmonton.
- Story, B. H. (2006). “ Technique for ‘tuning’ vocal tract area functions based on acoustic sensitivity functions (L),” J. Acoust. Soc. Am. 119, 715–718. 10.1121/1.2151802 [DOI] [PubMed] [Google Scholar]
- Story, B. H., Titze, I. R., and Hoffman, E. A. (1996). “ Vocal tract area functions from magnetic resonance imaging,” J. Acoust. Soc. Am. 100, 537–554. 10.1121/1.415960 [DOI] [PubMed] [Google Scholar]
- Takemoto, H., Honda, K., Masaki, S., Shimada, Y., and Fujimoto, I. (2006). “ Measurement of temporal changes in vocal tract area function from 3D cine-MRI data,” J. Acoust. Soc. Am. 119, 1037–1049. 10.1121/1.2151823 [DOI] [PubMed] [Google Scholar]
- Woo, J., Murano, E. Z., Stone, M., and Prince, J. L. (2012). “ Reconstruction of high resolution tongue volumes from MRI,” IEEE Trans. Biomed. Eng. 59, 3511–3524. [DOI] [PMC free article] [PubMed] [Google Scholar]
- Zhou, X., Espy-Wilson, C. Y., Tiede, M., Boyce, S., Holland, C., and Choe, A. (2008). “ An MRI-based articulatory and acoustic study of ‘retroflex’ and ‘bunched’ American English /r/ sounds,” J. Acoust. Soc. Am. 123, 4466–4481. 10.1121/1.2902168 [DOI] [PMC free article] [PubMed] [Google Scholar]


