

Abstract
In living cells, biochemical reaction networks often function in nonequilibrium steady states. Under these conditions, the networks necessarily have cyclic reaction kinetics that are maintained by sustained constant input and output, i.e., pumping. To differentiate this state from an equilibrium state without flux, we propose a microscopic method based on concentration fluctuation measurements, via fluorescence correlation spectroscopy, and statistical analyses of high-order correlations and cross correlations beyond the standard fluorescence correlation spectroscopy autocorrelation. We show that, for equilibrium systems with time reversibility, the correlation functions possess certain symmetries, the violation of which is a measure of steady-state fluxes in reaction cycles. This result demonstrates the theoretical basis for experimentally measuring reaction fluxes in a biochemical network in situ and the importance of single-molecule measurements in providing fundamental information on nonequilibrium steady-states in biochemistry.
Keywords: biochemical flux, concentration fluctuation, cycle kinetics, nanobiochemistry
Using fluorescence correlation spectroscopy [FCS (1–3)], a recent study on enzyme kinetics of single horseradish peroxidase molecules has observed an oscillatory time–correlation function, suggesting an irreversible, nonequilibrium nature of the biochemical reaction (4). In single-molecule enzymology (5, 6), the consecutive turnover of substrates to products catalyzed by a single enzyme molecule is recorded in terms of the fluorescence of enzyme–substrate or enzyme–product complexes. One essential feature of such a measurement is that the concentrations of the substrate, [S], and the product, [P], are approximately constant over the course of the entire experiment. Thus, although the enzyme molecule is subject to stochastic fluctuations, on average it participates in a stationary process with a net circular flux. The flux is zero if and only if the substrate and product concentrations satisfy conditions of [P]/[S] = Keq, where Keq is the equilibrium constant for the reaction S ⇌ P, both in the presence and absence of the enzyme. In this unique situation, the reaction is at a chemical equilibrium. A biochemical reaction with oscillatory kinetics is necessarily nonequilibrium (7–10). However, the converse is not true: A reaction in a nonequilibrium steady state (NESS) can be without oscillation. The present work introduces two sensitive methods for differentiating equilibrium from NESS in the context of single-molecule enzymology with FCS. Both methods are based on the fundamental principle of time irreversibility of a NESS (11, 12). More importantly, from a practical standpoint, we shall show how the nonequilibrium fluxes in a reaction network, such as those in living cells, can be measured directly in situ by using the recently developed dual-color FCS (13, 14). This article is the third in a series of investigations on the possibility and utility of applying single-molecule methods, especially FCS, to NESS kinetics (6, 15).
Macroscopically, the concentrations of all the states of an enzyme (i.e., E, ES, EP, etc.) are constant in a NESS, just as in an equilibrium. The constancy is sustained, however, by a set of nonzero but balanced biochemical fluxes, whereas in an equilibrium, these fluxes all vanish (16). Obviously, the condition for a NESS can be met only approximately in a closed system for a restricted period. It can be achieved rigorously, however, in an open system with balanced sources and sinks, such as in a metabolic network in a living cell (17). Although the probability that a single enzyme molecule is in a given state is constant over time, each molecule moves from one state to another stochastically because of thermal fluctuations. Then, one obtains the kinetics of the enzymatic catalysis by following these fluctuations for a sufficiently long time and carrying out a statistical analysis of the “noise.”
Biochemical reactions in living cells are highly connected in the form of complex networks (18, 19). Most of the reactions in such a network are not at their chemical equilibrium: The product of one specific reaction becomes the substrate of another, and the whole system is kept in a NESS by balanced sources and sinks. In the steady state, the concentration of each species fluctuates about a constant mean, and most of the reaction pathways have nonzero fluxes. According to Kirchoff's law, the balanced fluxes in such a state have to be circular (16, 17). These are the necessary situations for reaction networks in living organisms. Although, overall, the biochemical reaction network in a living cell has to be away from equilibrium, some of the reactions can be in chemical equilibrium. One example is the creatine kinase-catalyzed reaction creatine + ATP ⇌ phosphocreatine + ADP in a muscle cell (20).
The ability to determine the equilibrium or nonequilibrium nature of biochemical reaction(s) in living cells is becoming increasingly important in the postgenomic era, in which studying cellular metabolism in situ becomes a central issue (21). Being able to characterize reactions noninvasively in situ is obviously desirable, but this task is difficult for a simple reason: Substrate (and product) concentrations are constant in both equilibrium and NESS alike. Even with kinetic perturbation, both can exhibit monotonic relaxation kinetics. Therefore, the macroscopic behavior of an equilibrium and a NESS are not readily distinguished (18). Because of these difficulties, methods for quantitatively measuring fluxes in a metabolic network of living cells are currently being sought assiduously.
Although the macroscopic concentrations of all species are constant in a steady state, the microscopic spontaneous fluctuation goes on. These fluctuations are often small, but under favorable conditions, they can be measured experimentally (21–23). FCS is the method designed precisely for carrying out such measurements (2), and single-molecule enzymology has shown great promise (5). The “noisy” data from these measurements are analyzed by statistical methods: the distribution of the fluctuations, their moments, and autocorrelation function. These methods yield a wealth of information about the underlying kinetics. In general, the fluorescence intensity distribution and its moments yield information about molecular aggregation and association (24–28), and the autocorrelation function and higher-order time-correlation functions yield valuable dynamic information (4, 29).
In this article, we demonstrate that high-order autocorrelation functions from standard FCS measurements and the cross-correlation functions from dual-color FCS can provide direct information on whether a steady state is equilibrium or nonequilibrium. This idea has its origin in earlier, seminal work (30, 31), but our result is more straightforward and general. As we have shown (26), high-order time-correlation functions, for example  , should have multiple time arguments in general, and the single-time high-order correlation functions discussed in the earlier work are only special cases. By introducing the multiple-time high-order correlation function, the correspondence between time reversibility and a certain symmetry in the correlation function G2(τ1, τ2) in equilibrium becomes transparent. The result reflects the fundamental characters of equilibrium and nonequilibrium, reversibility and irreversibility, and the potential contribution of this kind of experimental measurement to understanding living systems.
Two additional points are no less significant. First, as a practical consequence, the cross-correlation function from dual-color FCS, as we shall show, provides a possibility for directly measuring kinetic fluxes in a reaction network noninvasively. Second, the multiple-time high-order correlation functions have their counterparts in macroscopic kinetics (H.Q., unpublished data), corresponding to the relaxation after a multiple-pulse perturbation (32) such as that used in multidimensional NMR (33). This relation is a generalization of the famous Green–Kubo formulae (34).
Equilibrium and Symmetry of the Third-Order Time-Correlation Function
We consider kinetics of a single enzyme molecule with approximately constant substrate and product concentrations. The kinetics of the enzyme is described by a set of first-order isomerization reactions with first-order or pseudo-first-order rate constants kij:
 |
[1] |
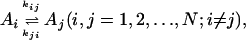
where, without loss of generality, we assume all transitions between states Ai and Aj are permissible. In equilibrium, the concentrations [Ai], [Aj] of states i and j, or the probabilities Pi, Pj for a single enzyme, are related directly to the rate constants between these two states:
 |
[2] |
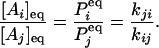
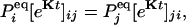
More importantly, for every pathway connecting states i and j, say i = i0, i1, i2,..., iN-1, in = j:
 |
[3] |
Note that some of the rate constants are pseudo-first-order with “hidden” concentration terms. This relationship indicates that all the hidden concentrations are in chemical equilibrium. Mathematically, it can be shown that if and only if Eq. 3 is satisfied for every possible cycle in the kinetic network, then the entire system is at equilibrium, and its stochastic dynamic is time-reversible (10, 35, 36). There is a branch of probability theory known as reversible (symmetric) Markov process that focuses on such stochastic systems (37).
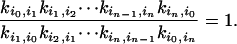
Eqs. 2 and 3 lead to a host of important consequences, among which it is well known that the eigenvalues of the matrix
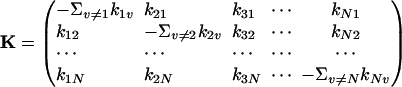 |
[4] |
for the system in Eq. 1 are all real and nonpositive (7, 8). We can rewrite the equation 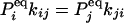 in a matrix form and then show
 |
[5] |
in which 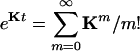 is an N × N matrix that represents the transition probability: [eKt]ij = Pij(t). The transition probability is the probability of the enzyme being in state j at time t when it is at state i at time 0 (6). The second-order time-correlation function can be calculated from
  and transition probability Pij(t):
 |
where we have assumed that the fluorescence signal for state i is Ii.
We now show that the relation in Eq. 3 immediately leads to a symmetric third-order time-correlation function:
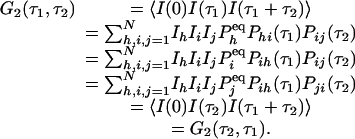 |
Therefore, for a reaction network in equilibrium, its third-order correlation function is necessarily symmetric. In order words, an experimental observation of nonsymmetric G2 is a very strong evidence for irreversibility. Fig. 1 shows an example from the simplest three-state cyclic reaction with reversibility, k12k23k31/k13k32k21 = 1, and irreversibility, k12k23k31/k13k32k21 > 1.
Fig. 1.

Simulation of fluctuations I(t) and high-order FCS correlation functions, G2(t1, t2) for the simplest three-state cycle kinetics: 1 ⇌ 2 ⇌ 3 ⇌ 1. (A) All six rate constants are the same with a value of 0.5; hence, the reaction is reversible. The fluctuation data are for signal I(t) with Ii = i for state i (i = 1, 2, 3). (B) NESS with all forward rate constants 1 but backward rate constants 0; hence, the reaction is irreversible. (C) The same kinetics as shown in B but for signal I(t) with Ii = 2[i + 2/2] - 1, which does not differentiate states 2 and 3 ([x] denotes the integer part of x). An additional 10% uncorrelated Gaussian noise is superimposed on the Ii. (D–F) High-order correlation function differences, G2(t1, t2) - G2(t2, t1) for A–C, respectively. It is seen that D and F are essentially zero; hence, the corresponding G2 values are symmetric. (E) An asymmetry in G2 for fluctuation data shown in B, as expected. Note the different scales in the ordinates.
Equilibrium and Symmetry of the Cross Correlation with Dual-Color FCS
Another consequence of Eqs. 2 and 3 is a symmetry in the cross-correlation function from dual-color FCS, which uses two different fluorescence probes specific for different chemical states (13, 14). Let us assume that signals Xi and Yi are from two different fluorescence probes for state i. Then, the cross correlation
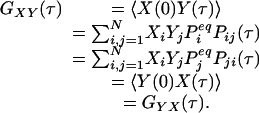 |
Asymmetry in GXY and Nonequilibrium Fluxes
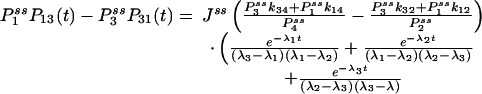
If some of the concentrations involved in the pseudo-first-order rate constants are being kept at a nonequilibrium condition, Eq. 3 no longer holds. Then it can be shown that there are nonzero circular fluxes in cyclic pathways (16, 35). Since GXY = GYX when the flux is zero, one expects that their difference measures the magnitude of the flux. This intuition indeed is correct if the two fluorescence probes are specific. In the most ideal situation, let us assume that signal X is specific for state ξ, and signal Y is specific for state η. Then
 |
[6] |
where  is now the probability of the enzyme being in state i in the NESS. In this situation, the term in parentheses is not zero. In fact, for small τ Pij(τ) ≈ kijτ, and
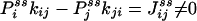 |
is exactly the NESS flux from state i to j. Therefore, the initial slope of Eq. 6 is directly related to the flux  ,
,
 |
and with appropriate normalization,
 |
[7] |
in which 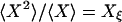 and
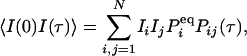
and 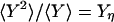 (2). Fig. 2 shows an example of cross-correlation functions, again from the simple three-state cyclic reaction.
Fig. 2.

Autocorrelation and cross-correlation functions for a simple three-state cycle 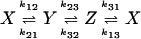 . The parameters used are k12 = 2, k23 = 3, k31 = 1/6. k12 = k32 = 1, k13 = 0.001. The NESS probabilities are
  ,
,  , and
, and  with flux 0.0998, which agrees with the initial slopes of GYX - GXY, etc. As a control, if k13 = 1 is used, then we have k12k23k31/k21k32k13 = 1, and all of the fluxes are zero. The differences in the cross correlations disappear (data not shown).
One not only obtains the net NESS flux between i and j,  , one in fact can obtain the “one-way flux” (16),
  and
and  , from the initial slopes of GXY(τ) and GYX(τ), respectively. In the past, such detailed kinetic information has been considered impossible to measure directly from experiment (16). Hence, the present analysis demonstrates a unique capability of single-molecule enzymology to dissect out the rates of individual reactions in a complex kinetic network in NESS in situ.
Finally, we point out that the function GXY(τ) also contains information on all the pathways connecting state i and j and also the average time the enzyme takes to move from i state to j state. Fig. 3 shows for a four-state cyclic reaction that the cross correlation between states 1 and 3 peaks after the cross correlation between states 1 and 2 when k12k23k34k41/(k14k43k32k21) > 1. Therefore, the function also provides the direction of the flux.
Fig. 3.

 |
 |
Identifiability and Signal Specificity
Although an asymmetric G2(τ1,τ2) necessarily means the underlying reaction is time-irreversible, a symmetric G2 does not guarantee the reversibility of the reaction. In FCS, the behavior of the time-correlation function G2 also depends on how specific the fluorescent signal is with respect to the states of an enzyme. We shall use a simple, three-state model as an illustration.
Let us consider a NESS between states A, B, and C. The derivation can be easily generalized to any N states, but the algebra will be more cumbersome. The three-state model has been investigated extensively in connection with motor protein kinetics (6, 38) and stochastic Michaelis–Menten kinetics (6). Fig. 1 B and E show that the high-order correlation function is asymmetric when IA, IB, and IC are not equal. If, however, we have a situation in which states B and C are indistinguishable with the fluorescence probe, i.e., IB = IC, then
 |
 |
We see here that G2 is symmetric with respect to τ1 and τ2 without the equilibrium condition. Therefore, if the fluorescence signal cannot distinguish at least three different states in a NESS, the irreversibility cannot be observed by using G2(τ1,τ2). This result is instructive. It is well known that a two-state model can only approach an equilibrium steady state because it contains no cycles (35). The three-state cyclic model is the simplest one capable of representing a NESS. Fig. 1 C and F show that with an irreversible reaction, the high-order correlation function, G2(τ1,τ2), for a degenerate probe will still be symmetric. On the other hand, it is worth pointing out that, even if there is such degeneracy in probes, the cross-correlation approach can still be used to show flux nevertheless.
Similarly, if a reaction network can be decomposed into subparts of equilibrium and NESS, but a fluorescence probe I cannot differentiate the latter part, then again the G2 based on I will not be useful to identify irreversibility. This result agrees with an earlier idea of Noyes (40) and is intimately related to the Gibbs' paradox.
The Nature of a NESS and Its Biological Significance
Many previous works have been devoted to establishing the fundamental difference between an equilibrium steady state and a NESS (16, 41, 42). In biology, the fundamental difference divides living from dead. It is clear that a living system has to be in open exchange with its surroundings, and the biochemical reactions are irreversible with circular fluxes. In the model system (Eq. 1), the sources and sinks are hidden in the pseudo-first-order rate constants. Strictly speaking, to keep the system running, work has to be done continuously to replenish the sources and to “drain” the sinks, and the circular fluxes also necessarily generate heat (11, 12, 16, 39). Hence, a biochemical network in NESS represents a rudimentary form of energy metabolism in a living system.
What are biological functions of NESS beside generating heat? One could argue that NESS is a necessity for many important biological processes: (i) efficient energy transduction (16), e.g., chemomechanics of motor proteins (38, 39); (ii) protein synthesis with high fidelity (43); (iii) sharp switching of phosphorylation-dephosphorylation signaling (44); and (iv) guanosine triphosphatase timer with high accuracy (45). A system of biochemical reactions in equilibrium would not be able to convert energy from one form to another, and it would not be able to process information with accuracy beyond the limitation imposed by thermal noise.
Nonlinear Biochemical Reactions and NESS
The present analysis is based on unimolecular reactions (Eq. 1) with linear kinetics. More-complex biochemical reactions in vivo are nonlinear; they remain to be analyzed in the context of single-molecule enzymology (36). Macroscopically, introducing nonlinearity into the kinetics leads to sustained biochemical oscillation, which does not happen with linear kinetics (46, 47). The relationship between the macroscopic biochemical oscillation and the oscillatory correlation function at the level of a single molecule remains to be elucidated (15, 48), although a phenomenon known as stochastic resonance without periodic forcing seems to be highly relevant (9, 10). At the present time, it is not clear what the signature of the macroscopic oscillation is, such as in glycolysis, if measured from single enzyme(s) turnover. Such questions become more relevant with the increasing intensity on metabolic research.
Conclusions
It is instructive to quote a statement made a quarter of century ago by Wyman (17), one of the luminaries in enzymology, when he turned his attention to NESS and independently recognized the significance of circular fluxes: “To an observer unaware of the irreversible process going on and concerned only with the amount of substrate combined with enzyme in relation to substrate activity, the steady-state would seem to be a true equilibrium...” In this article, we show that with the development of FCS and single-molecule enzymology, we now, at least in principle, can detect the difference between a NESS and a true equilibrium experimentally. Furthermore, even quantifying the steady-state fluxes in a network noninvasively becomes possible.
This paper was submitted directly (Track II) to the PNAS office.
Abbreviations: FCS, fluorescence correlation spectroscopy; NESS, nonequilibrium steady state.
References
- 1.Magde, D., Elson, E. L. & Webb, W. W. (1972) Phys. Rev. Lett. 29, 705-708. [Google Scholar]
- 2.Elson, E. L. & Magde, D. (1974) Biopolymers 13, 1-27. [DOI] [PubMed] [Google Scholar]
- 3.Rigler, R. & Elson, E. L., eds. (2001) Fluorescence Correlation Spectroscopy: Theory and Applications (Springer, New York).
- 4.Edman, L. & Rigler, R. (2000) Proc. Natl. Acad. Sci. USA 97, 8266-8271. [DOI] [PMC free article] [PubMed] [Google Scholar]
- 5.Xie, X. S. & Lu, H. P. (1999) J. Biol. Chem. 274, 15967-15970. [DOI] [PubMed] [Google Scholar]
- 6.Qian, H. & Elson, E. L. (2002) Biophys. Chem. 101, 565-576. [DOI] [PubMed] [Google Scholar]
- 7.Wei, J. & Prater, C. D. (1962) Adv. Catalysis 13, 203-392. [Google Scholar]
- 8.Chen, Y. D. (1978) Adv. Chem. Phys. 37, 67-97. [Google Scholar]
- 9.Qian, H. & Qian, M. (2000) Phys. Rev. Lett. 84, 2271-2274. [DOI] [PubMed] [Google Scholar]
- 10.Qian, M., Qian, M.-P. & Zhang, X.-J. (2003) Phys. Lett. A 309, 371-376. [Google Scholar]
- 11.Qian, H. (2001) Proc. R. Soc. London Ser. A 457, 1645-1655. [Google Scholar]
- 12.Qian, H. (2002) J. Phys. Chem. B. 106, 2065-2073. [Google Scholar]
- 13.Eigen, M. & Rigler, R. (1994) Proc. Natl. Acad. Sci. USA 91, 5740-5747. [DOI] [PMC free article] [PubMed] [Google Scholar]
- 14.Schwille, P., Meyer-Almes, F.-J. & Rigler, R. (1997) Biophys. J. 72, 1878-1886. [DOI] [PMC free article] [PubMed] [Google Scholar]
- 15.Qian, H., Saffarian, S. & Elson, E. L. (2002) Proc. Natl. Acad. Sci. USA 99, 10376-10381. [DOI] [PMC free article] [PubMed] [Google Scholar]
- 16.Hill, T. L. (1989) Free Energy Transduction and Biochemical Cycle Kinetics (Springer, New York).
- 17.Wyman, J. (1975) Proc. Natl. Acad. Sci. USA 72, 3983-3987. [DOI] [PMC free article] [PubMed] [Google Scholar]
- 18.Westerhoff, H. V. & van Dam, K. (1987) Thermodynamics and Control of Biological Free-Energy Transduction (Elsevier, Amsterdam).
- 19.Qian, H., Beard, D. A. & Liang, S. D. (2003) Eur. J. Biochem. 270, 415-421. [DOI] [PubMed] [Google Scholar]
- 20.Meyer, R. A., Sweeney, H. L. & Kushmerick, M. J. (1984) Am. J. Physiol. 246, C365-C377. [DOI] [PubMed] [Google Scholar]
- 21.Cluzel, P., Surette, M. & Leibler, S. (2000) Science 287, 1652-1655. [DOI] [PubMed] [Google Scholar]
- 22.Schwille, P., Haupts, U., Maiti, S. & Webb, W. W. (1999) Biophys. J. 77, 2251-2265. [DOI] [PMC free article] [PubMed] [Google Scholar]
- 23.Kohler, R. H., Schwille, P., Webb, W. W. & Hanson, M. R. (2000) J. Cell Sci. 113, 3921-3930. [DOI] [PubMed] [Google Scholar]
- 24.Palmer, A. G. & Thompson, N. L. (1987) Biophys. J. 52, 257-270. [DOI] [PMC free article] [PubMed] [Google Scholar]
- 25.Qian, H. & Elson, E. L. (1989) Appl. Polym. Symp. 43, 305-314. [Google Scholar]
- 26.Qian, H. & Elson, E. L. (1990) Biophys. J. 57, 375-380. [DOI] [PMC free article] [PubMed] [Google Scholar]
- 27.Qian, H. & Elson, E. L. (1990) Proc. Natl. Acad. Sci. USA 87, 5479-5483. [DOI] [PMC free article] [PubMed] [Google Scholar]
- 28.Kask, P., Palo, K., Ullmann, D. & Gall, K. (1999) Proc. Natl. Acad. Sci. USA 96, 13756-13761. [DOI] [PMC free article] [PubMed] [Google Scholar]
- 29.Qian, H. (1990) Biophys. Chem. 38, 49-57. [DOI] [PubMed] [Google Scholar]
- 30.Steinberg, I. Z. (1986) Biophys. J. 50, 171-179. [DOI] [PMC free article] [PubMed] [Google Scholar]
- 31.Steinberg, I. Z. (1987) Biopolymers 26, S161-S176. [DOI] [PubMed] [Google Scholar]
- 32.Wiener, N. (1958) Nonlinear Problems in Random Theory (MIT Press, Cambridge, MA).
- 33.Blümich, B. (1987) Prog. Nucl. Magn. Reson. Spectrosc. 19, 331-417. [DOI] [PubMed] [Google Scholar]
- 34.Dorfman, J. R. (1999) An Introduction to Chaos in Nonequilibrium Statistical Mechanics (Cambridge Univ. Press, Cambridge, U.K.).
- 35.Qian, M.-P. & Qian, M. (1979) Sci. Sin. Special Issue II, 69-79.
- 36.Schuster, S. & Schuster, R. (1989) J. Math. Chem. 3, 25-42. [Google Scholar]
- 37.Kelly, F. P. (1979) Reversibility and Stochastic Networks (Wiley, New York).
- 38.Qian, H. (1997) Biophys. Chem. 67, 263-267. [DOI] [PubMed] [Google Scholar]
- 39.Qian, H. (2000) Biophys. Chem. 83, 35-43. [DOI] [PubMed] [Google Scholar]
- 40.Noyes, R. M. (1961) J. Chem. Phys. 34, 1983-1985. [Google Scholar]
- 41.Nicolis, G. & Prigogine, I. (1977) Self-Organization in Nonequilibrium Systems (Wiley, New York).
- 42.Keizer, J. (1987) Statistical Thermodynamics of Nonequilibrium Processes (Springer, New York).
- 43.Hopfield, J. J. (1974) Proc. Natl. Acad. Sci. USA 71, 4135-4139. [DOI] [PMC free article] [PubMed] [Google Scholar]
- 44.Qian, H. (2003) Biophys. Chem. 105, 585-593. [DOI] [PubMed] [Google Scholar]
- 45.Li, G. P. & Qian, H. (2002) Traffic 3, 249-255. [DOI] [PubMed] [Google Scholar]
- 46.DiCera, E., Phillipson, P. E. & Wyman, J. (1988) Proc. Natl. Acad. Sci. USA 85, 5923-5926. [DOI] [PMC free article] [PubMed] [Google Scholar]
- 47.Goldbeter, A. (1996) Biochemical Oscillations and Cellular Rhythms: The Molecular Bases of Periodic and Chaotic Behaviour (Cambridge Univ. Press, New York).
- 48.Vilar, J. M. G., Kueh, H. Y., Barkai, N. & Leibler, S. (2002) Proc. Natl. Acad. Sci. USA 99, 5988-5992. [DOI] [PMC free article] [PubMed] [Google Scholar]